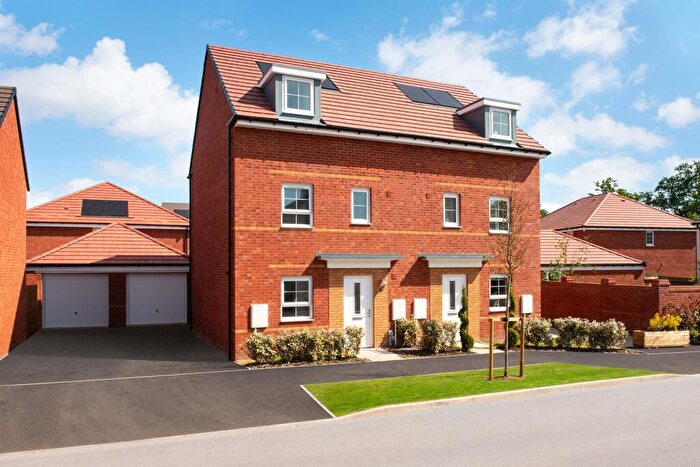
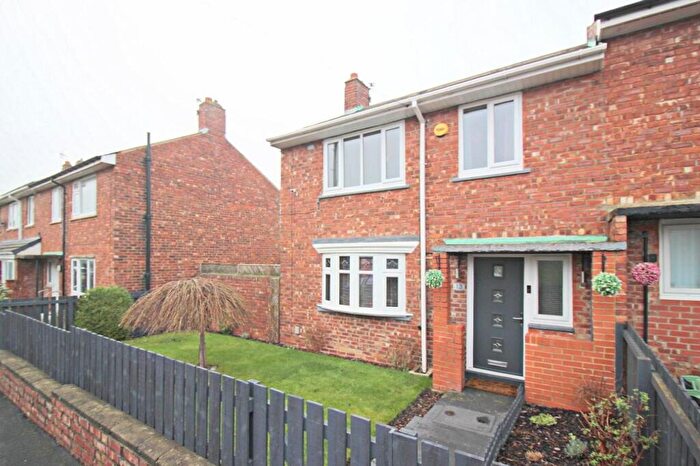
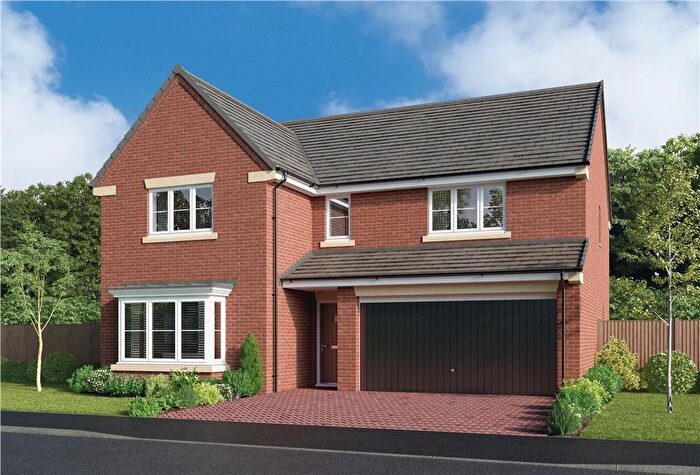
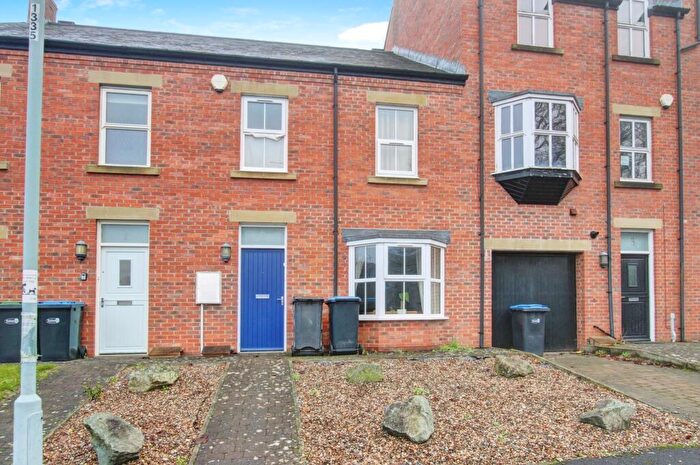
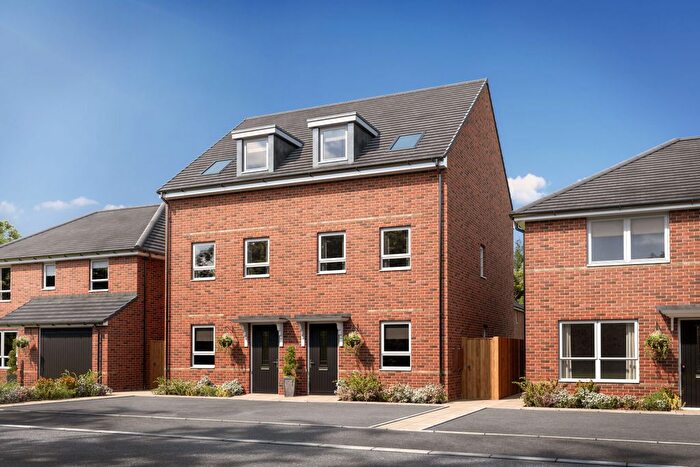
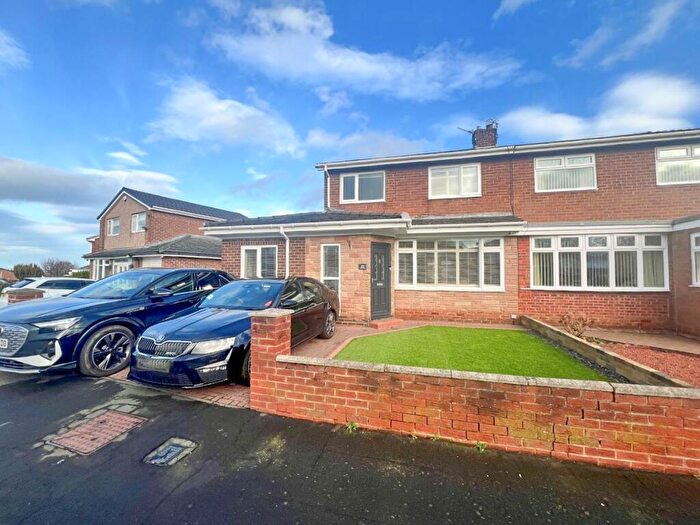
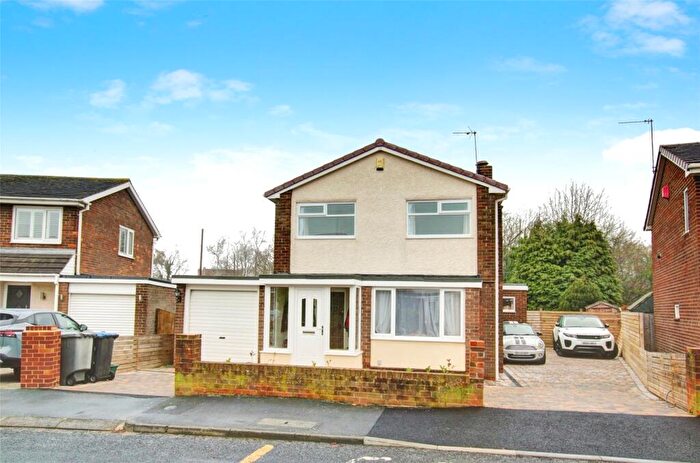
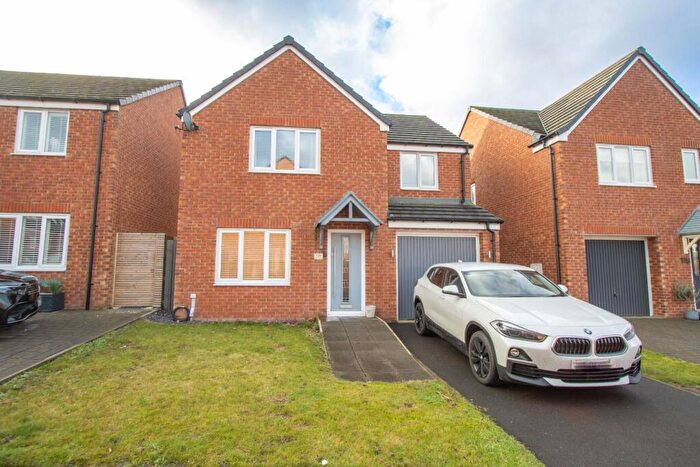
Houses for sale & to rent in Durham South, Durham
House Prices in Durham South
Properties in Durham South have an average house price of £341,768.00 and had 53 Property Transactions within the last 3 years¹.
Durham South is an area in Durham, County Durham with 739 households², where the most expensive property was sold for £1,040,000.00.
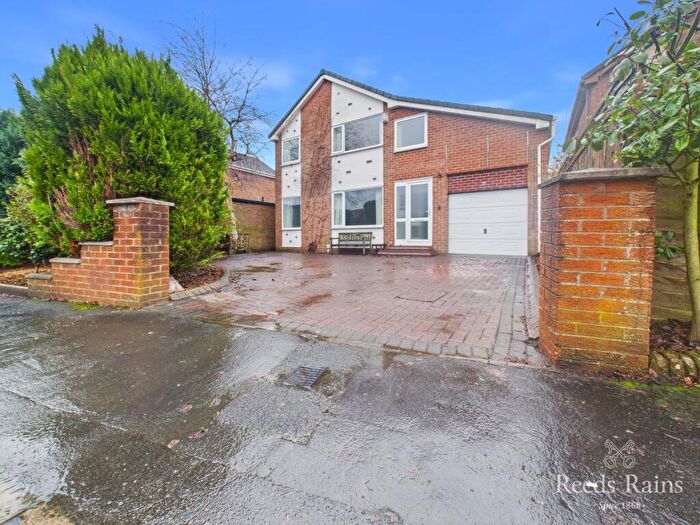
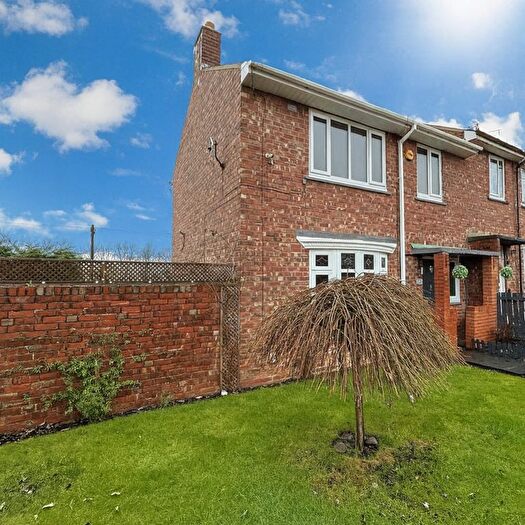
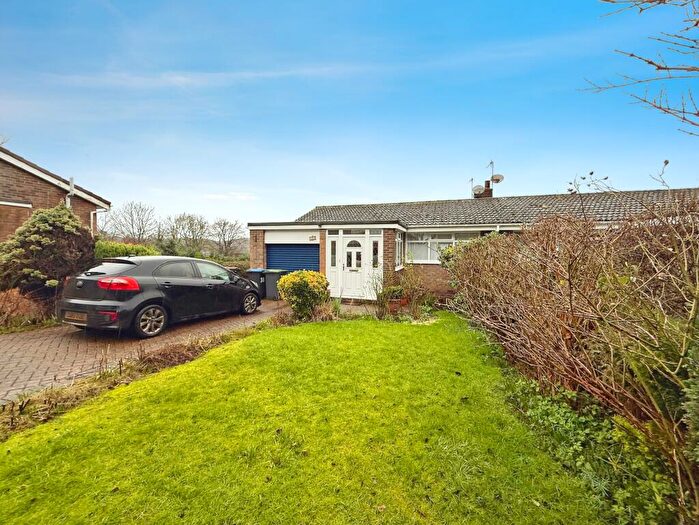
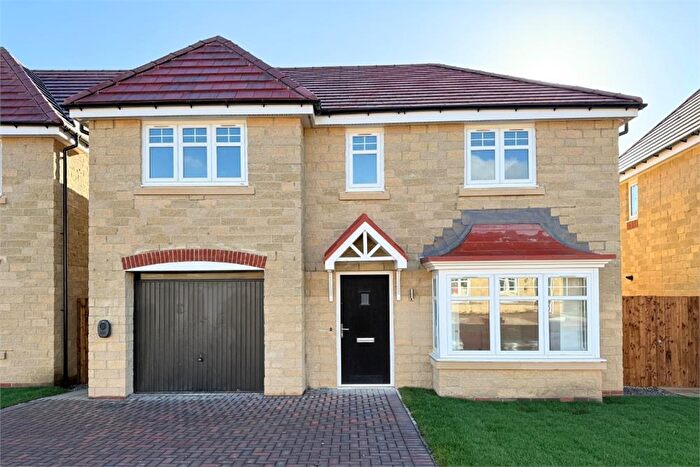
Properties for sale in Durham South
Roads and Postcodes in Durham South
Navigate through our locations to find the location of your next house in Durham South, Durham for sale or to rent.
| Streets | Postcodes |
|---|---|
| Ancroft Garth | DH1 2UD |
| Apperley Avenue | DH1 2TY |
| Avenue Street | DH1 2PT |
| Bank Foot | DH1 2PD |
| Beal Walk | DH1 2PL |
| Beech View | DH1 2SF |
| Bromley Close | DH1 2TZ |
| Bucks Hill | DH1 3TW |
| Chapel Place | DH1 2FD |
| Chapter Cottages | DH1 2NE |
| Darlington Road | DH1 3ST |
| Durham University Science Park | DH1 3YG |
| Farm Road | DH1 3SF |
| Foxton Way | DH1 2PJ |
| Grange Farm | DH1 2FB |
| Hall Farm | DH1 2UE |
| Hall Lane | DH1 2SZ DH1 2NG DH1 2SY |
| Hallgarth Street | DH1 3BB |
| Heathways | DH1 2PG DH1 2QB |
| High Street | DH1 2PF DH1 2PN |
| High Street North | DH1 2NJ DH1 2NH DH1 2NU |
| High Street South | DH1 2NN |
| Hill Meadows | DH1 2PE |
| Hillcrest | DH1 2PQ |
| Hollingside Lane | DH1 3TL DH1 3TN |
| Houghall Farm Lane | DH1 3PJ |
| Houghall Houses | DH1 3SJ |
| Langton Lea | DH1 2QF |
| Lindisfarne | DH1 2PH |
| Low Green | DH1 2NF |
| Low Road East | DH1 2NB |
| Low Road West | DH1 2LY |
| Manor Close | DH1 2NS |
| Meldon Way | DH1 2PZ |
| Mitford Close | DH1 2QE |
| Overman Street | DH1 2PU |
| Pond Street | DH1 2PS |
| Poplar Terrace | DH1 2NP |
| Prospect Terrace | DH1 2NR |
| Quality Street | DH1 2PP |
| Rectory Terrace | DH1 2NW |
| Robson Terrace | DH1 2NL |
| Rose Acre | DH1 2NT |
| Sherburn House | DH1 2SJ DH1 2SL DH1 2SW |
| Shincliffe Lane | DH1 2SH |
| Shincliffe Mill | DH1 2SU |
| South Road | DH1 3DE DH1 3DF DH1 3LE DH1 3LF DH1 3LG DH1 3LT DH1 3TB DH1 3TQ |
| St Marys Close | DH1 2ND |
| Stockton Road | DH1 2PB DH1 3LY |
| Telford Close | DH1 2YJ |
| The Bungalows | DH1 3SL |
| The Cottage | DH1 2SG |
| The Green | DH1 2UB |
| The Mews | DH1 2YH |
| Thropton Close | DH1 2QA |
| Whitwell Acres | DH1 2PX |
| Willow Tree Avenue | DH1 2NX DH1 2PA |
| Wood View | DH1 2NQ |
| DH1 2NA DH1 2PR DH1 2PW DH1 2SE DH1 2SQ DH1 2TA DH1 2TE DH1 2TQ DH1 2PY DH1 2ST DH1 2SX DH1 2TB DH1 2TD DH1 2TG DH1 2TH DH1 2TJ DH1 3SD DH1 3SE DH1 3SG DH1 3SN DH1 3SQ DH1 3UP DH1 3UZ DH6 5NE DH6 5NQ DH1 3SB |
Transport near Durham South
- FAQ
- Price Paid By Year
- Property Type Price
Frequently asked questions about Durham South
What is the average price for a property for sale in Durham South?
The average price for a property for sale in Durham South is £341,768. This amount is 97% higher than the average price in Durham. There are 999 property listings for sale in Durham South.
What streets have the most expensive properties for sale in Durham South?
The streets with the most expensive properties for sale in Durham South are Houghall Houses at an average of £1,040,000, Wood View at an average of £685,000 and Telford Close at an average of £525,000.
What streets have the most affordable properties for sale in Durham South?
The streets with the most affordable properties for sale in Durham South are High Street at an average of £180,000, Avenue Street at an average of £190,625 and Low Road West at an average of £202,333.
Which train stations are available in or near Durham South?
Some of the train stations available in or near Durham South are Durham, Chester-Le-Street and Bishop Auckland.
Property Price Paid in Durham South by Year
The average sold property price by year was:
| Year | Average Sold Price | Price Change |
Sold Properties
|
|---|---|---|---|
| 2025 | £288,970 | -42% |
17 Properties |
| 2024 | £409,482 | 20% |
17 Properties |
| 2023 | £328,423 | 6% |
19 Properties |
| 2022 | £308,604 | -7% |
31 Properties |
| 2021 | £331,408 | 9% |
34 Properties |
| 2020 | £302,238 | -3% |
21 Properties |
| 2019 | £311,186 | 1% |
22 Properties |
| 2018 | £309,351 | 22% |
32 Properties |
| 2017 | £240,810 | -7% |
20 Properties |
| 2016 | £258,820 | -22% |
20 Properties |
| 2015 | £314,640 | 2% |
21 Properties |
| 2014 | £307,702 | -3% |
19 Properties |
| 2013 | £317,522 | 21% |
20 Properties |
| 2012 | £250,555 | -19% |
17 Properties |
| 2011 | £296,950 | 9% |
12 Properties |
| 2010 | £270,700 | 14% |
17 Properties |
| 2009 | £233,265 | -55% |
13 Properties |
| 2008 | £361,716 | 23% |
15 Properties |
| 2007 | £279,085 | 2% |
26 Properties |
| 2006 | £273,238 | 21% |
36 Properties |
| 2005 | £217,104 | -7% |
22 Properties |
| 2004 | £232,375 | 7% |
29 Properties |
| 2003 | £215,472 | 26% |
31 Properties |
| 2002 | £159,211 | 20% |
31 Properties |
| 2001 | £126,881 | 14% |
32 Properties |
| 2000 | £109,503 | -13% |
35 Properties |
| 1999 | £123,393 | 21% |
40 Properties |
| 1998 | £97,239 | 3% |
34 Properties |
| 1997 | £94,081 | 14% |
33 Properties |
| 1996 | £80,774 | -23% |
27 Properties |
| 1995 | £99,729 | - |
27 Properties |
Property Price per Property Type in Durham South
Here you can find historic sold price data in order to help with your property search.
The average Property Paid Price for specific property types in the last three years are:
| Property Type | Average Sold Price | Sold Properties |
|---|---|---|
| Semi Detached House | £312,590.00 | 11 Semi Detached Houses |
| Detached House | £428,734.00 | 19 Detached Houses |
| Terraced House | £296,115.00 | 20 Terraced Houses |
| Flat | £202,333.00 | 3 Flats |

