Houses for sale & to rent in Lumley, Houghton Le Spring
House Prices in Lumley
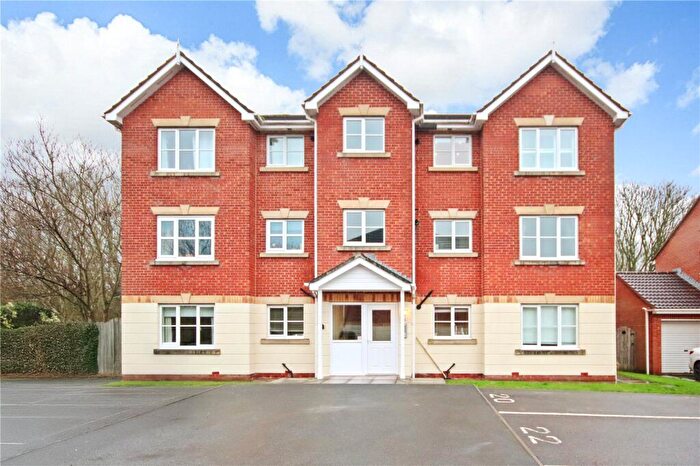
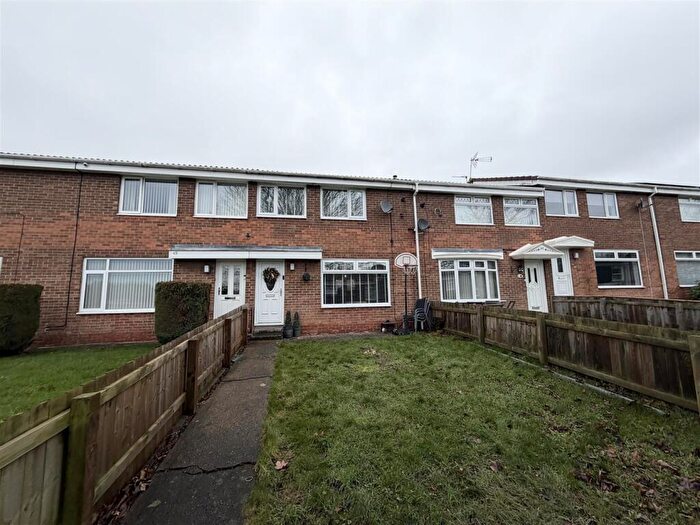
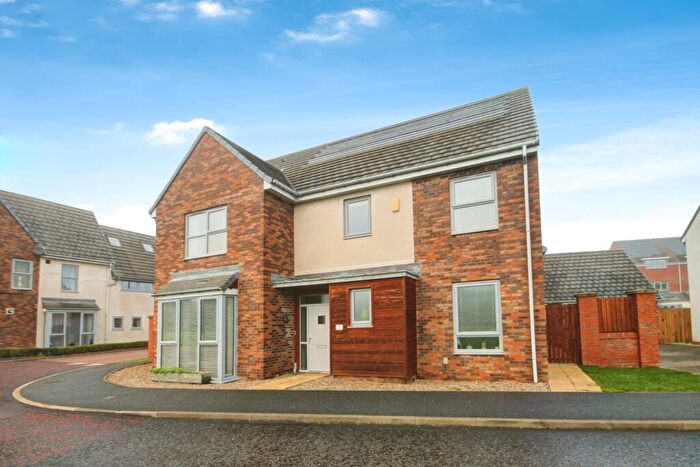
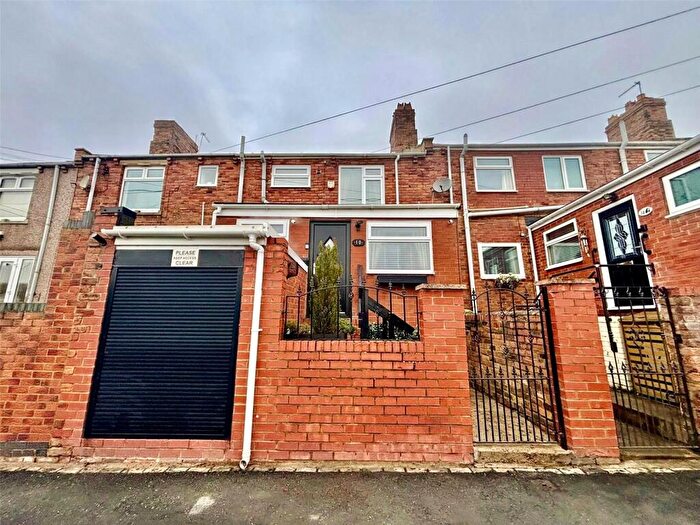
Properties in Lumley have an average house price of £161,081.00 and had 135 Property Transactions within the last 3 years¹.
Lumley is an area in Houghton Le Spring, County Durham with 1,530 households², where the most expensive property was sold for £1,400,000.00.
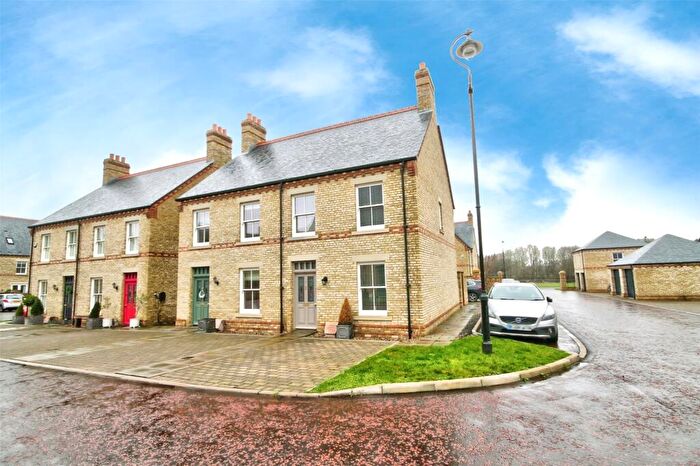
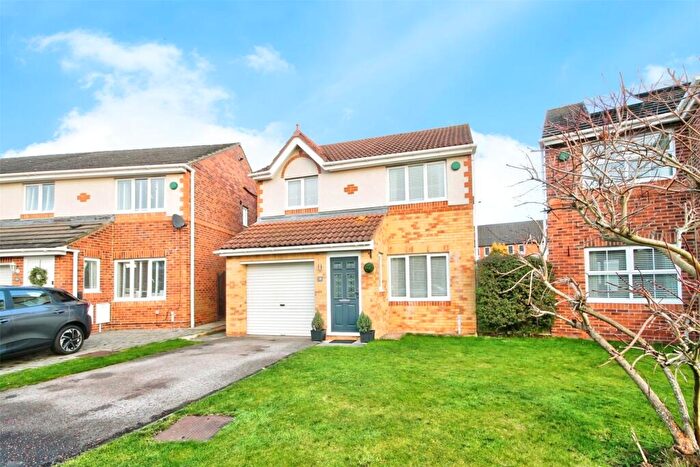
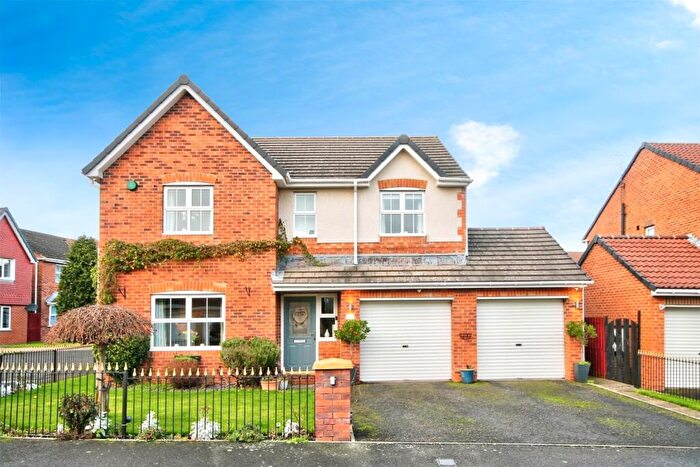
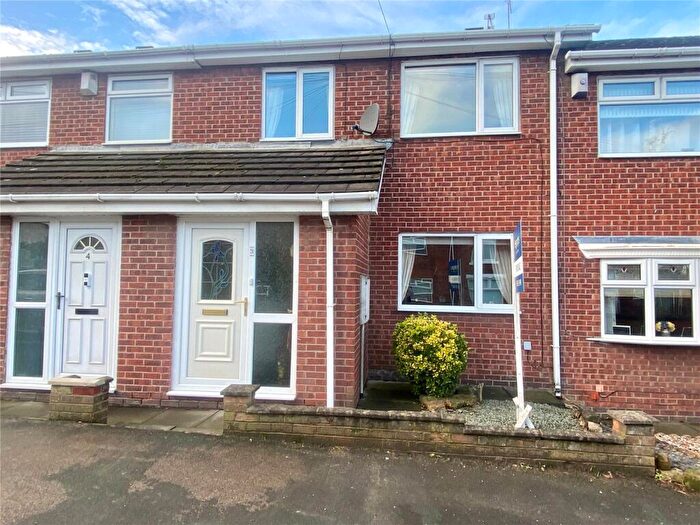
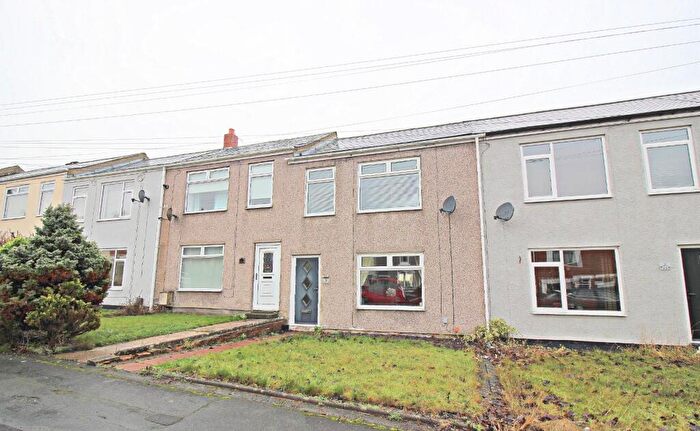
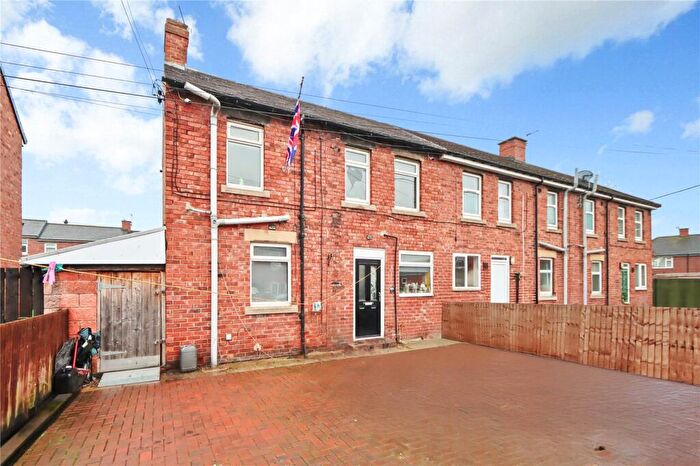
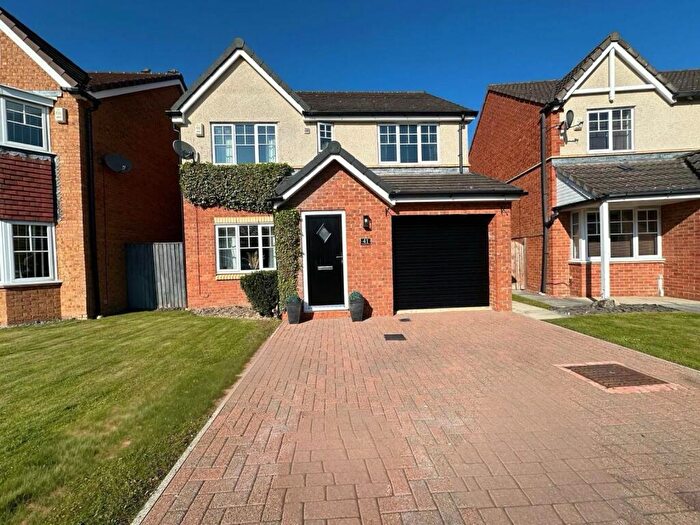
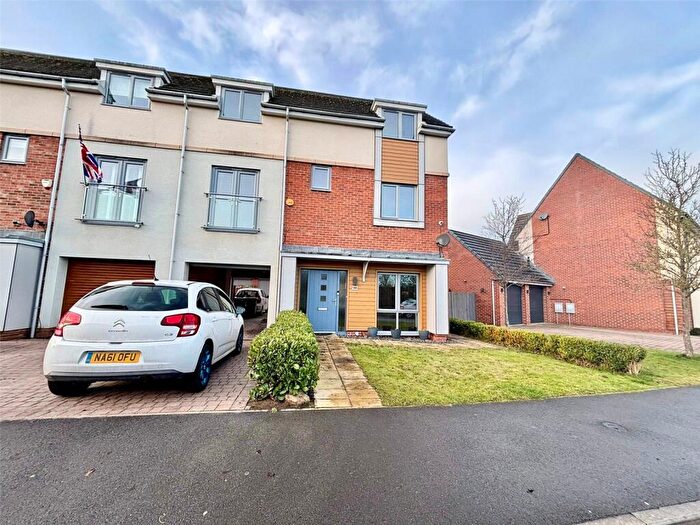
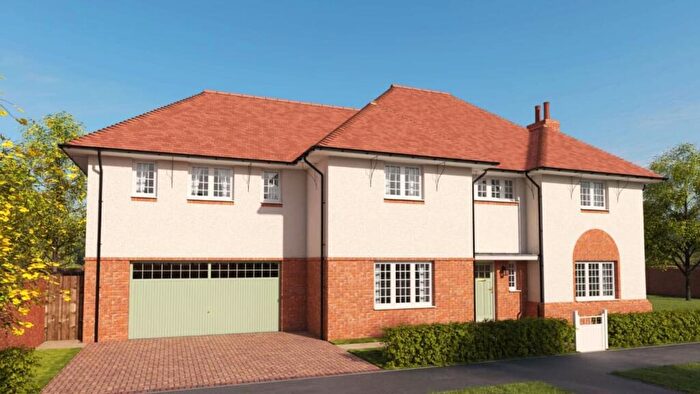
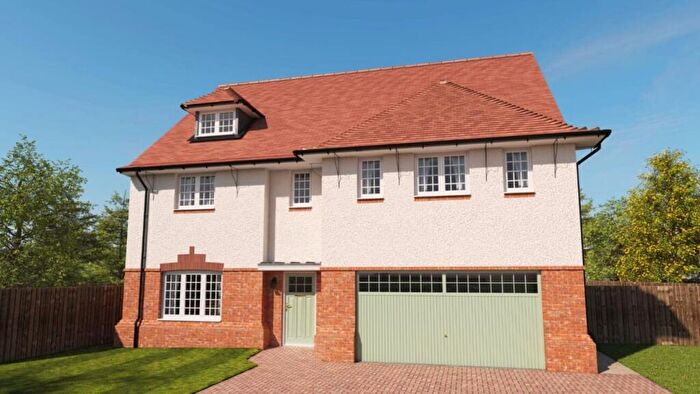
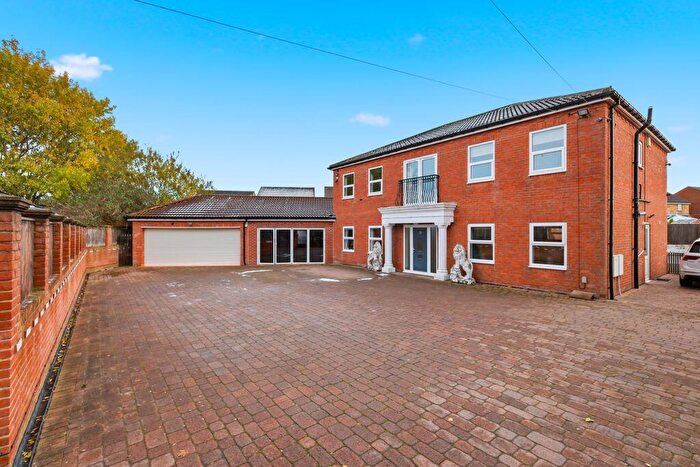
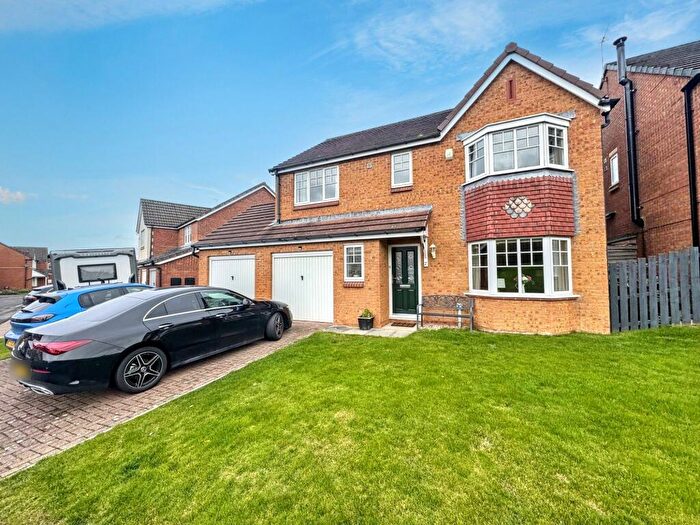
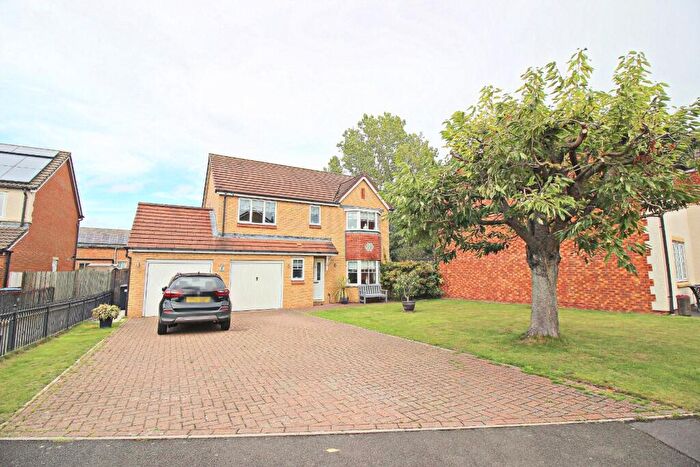
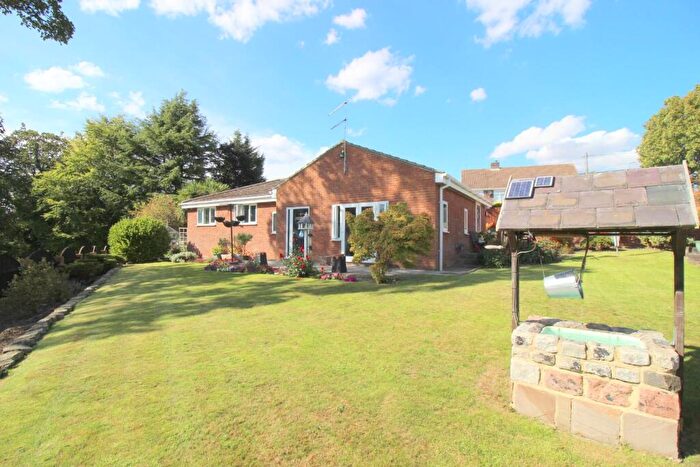
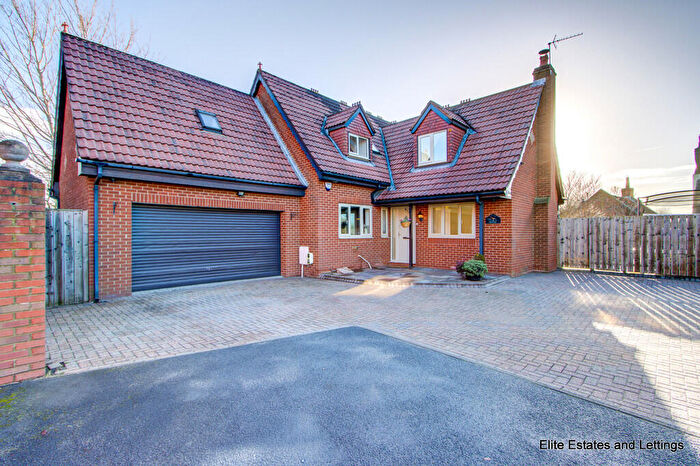
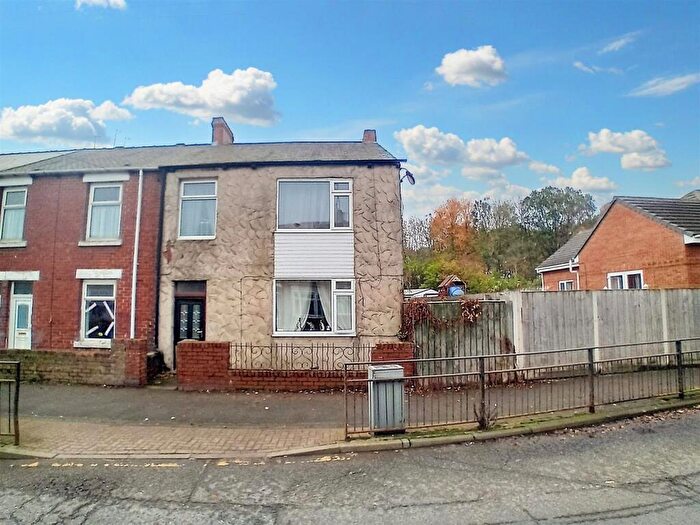
Properties for sale in Lumley
Roads and Postcodes in Lumley
Navigate through our locations to find the location of your next house in Lumley, Houghton Le Spring for sale or to rent.
| Streets | Postcodes |
|---|---|
| Aged Miners Homes | DH4 6DB |
| Alwyn Close | DH4 6ER |
| Appleby Court | DH4 6TL |
| Arlington Close | DH4 6HE |
| Barnard Court | DH4 6TS |
| Beaumaris | DH4 6EB |
| Briar Close | DH4 6BA |
| Briarwood Street | DH4 6AZ |
| Burnside | DH4 6AH |
| Callington Close | DH4 6BJ DH4 6BL |
| Carnation Avenue | DH4 6EJ |
| Castlefields | DH4 6HH DH4 6HJ |
| Castlemaine Close | DH4 6UB |
| Castlereigh Close | DH4 6UA |
| Chipchase Court | DH4 6TT |
| Church Close | DH4 6HQ |
| Cooperative Terrace | DH4 6AE |
| Dunstanburgh Court | DH4 6TU |
| Ellesmere | DH4 6DZ DH4 6EA |
| Elmwood Street | DH4 6AU |
| Estate Houses | DH4 6HB |
| Finchale Terrace | DH4 6BB |
| Gill Crescent North | DH4 6AW |
| Gill Crescent South | DH4 6AP |
| Glamis Court | DH4 6TR |
| Henry Terrace | DH4 6AJ |
| High Primrose Hill | DH4 6DX |
| High Row | DH4 6BD |
| Iris Terrace | DH4 6EL |
| Lambourne Close | DH4 6EP DH4 6EW |
| Langtons Terrace | DH4 6BP |
| Lilac Square | DH4 6EQ |
| Lumley New Road | DH4 6FE |
| Lumley Sixth Pit | DH4 6DU |
| Maplewood Street | DH4 6AX |
| Marigold Crescent | DH4 6EF DH4 6EG |
| Meadow Grange | DH4 6DW |
| Medwyn Close | DH4 6ES |
| Middle Row | DH4 6BE |
| Mill Court | DH4 6DJ |
| Moor Court | DH4 6EE |
| Morton Crescent | DH4 6AD DH4 6AQ |
| Morton Grange Terrace | DH4 6AL |
| Morton Mews | DH4 6QZ |
| Norham Court | DH4 6TP |
| North View | DH4 6DA |
| Oak Street | DH4 6AT |
| Old Station Close | DH4 6FB |
| Orchid Square | DH4 6BZ |
| Panfield Terrace | DH4 6BW |
| Park View | DH4 6FD DH4 6HA |
| Pinewood Street | DH4 6AY |
| Primrose Crescent | DH4 6EN |
| Primrose Hill | DH4 6BH DH4 6DY |
| Richmond Drive | DH4 6TX DH4 6TY |
| Rose Crescent | DH4 6ED |
| School Terrace | DH4 6AS |
| Short Row | DH4 6EZ |
| South Crescent | DH4 6AG |
| St Barnabas | DH4 6ET DH4 6EU |
| Sydney Street | DH4 6AN |
| Tantallon Court | DH4 6TJ |
| The Meadows | DH4 6HG |
| The Woodlands | DH4 6DL |
| Violet Terrace | DH4 6EH |
| West View | DH4 6BN |
| Woodburn Close | DH4 6DH |
| Woodland Grange | DH4 6AF |
| Woodstone Terrace | DH4 6DP |
| Woodstone Village | DH4 6DR DH4 6BG DH4 6BQ DH4 6DS DH4 6FF |
| DH4 6DD DH4 6EX DH4 6EY DH4 6QA DH4 6QB DH4 6AB DH4 6AR DH4 6DE DH4 6DQ DH4 6HF DH4 6QD |
Transport near Lumley
-
Chester-Le-Street Station
-
Durham Station
-
Sunderland Station
-
Seaham Station
-
Heworth Station
-
Dunston Station
-
Newcastle Station
-
Manors Station
-
MetroCentre Station
- FAQ
- Price Paid By Year
- Property Type Price
Frequently asked questions about Lumley
What is the average price for a property for sale in Lumley?
The average price for a property for sale in Lumley is £161,081. This amount is 7% lower than the average price in Houghton Le Spring. There are 423 property listings for sale in Lumley.
What streets have the most expensive properties for sale in Lumley?
The streets with the most expensive properties for sale in Lumley are Primrose Hill at an average of £504,833, Morton Mews at an average of £450,000 and Chipchase Court at an average of £364,333.
What streets have the most affordable properties for sale in Lumley?
The streets with the most affordable properties for sale in Lumley are Marigold Crescent at an average of £39,333, Primrose Crescent at an average of £39,999 and Gill Crescent North at an average of £43,166.
Which train stations are available in or near Lumley?
Some of the train stations available in or near Lumley are Chester-Le-Street, Durham and Sunderland.
Property Price Paid in Lumley by Year
The average sold property price by year was:
| Year | Average Sold Price | Price Change |
Sold Properties
|
|---|---|---|---|
| 2025 | £177,420 | 27% |
47 Properties |
| 2024 | £128,821 | -41% |
49 Properties |
| 2023 | £181,923 | 9% |
39 Properties |
| 2022 | £165,607 | 3% |
56 Properties |
| 2021 | £160,518 | 23% |
63 Properties |
| 2020 | £122,909 | -46% |
41 Properties |
| 2019 | £179,631 | 24% |
40 Properties |
| 2018 | £136,673 | 10% |
49 Properties |
| 2017 | £123,598 | -20% |
51 Properties |
| 2016 | £148,793 | 8% |
40 Properties |
| 2015 | £136,491 | 11% |
49 Properties |
| 2014 | £120,913 | -22% |
37 Properties |
| 2013 | £147,749 | 2% |
50 Properties |
| 2012 | £144,456 | 17% |
24 Properties |
| 2011 | £120,080 | -15% |
30 Properties |
| 2010 | £138,104 | 2% |
34 Properties |
| 2009 | £135,372 | -19% |
24 Properties |
| 2008 | £161,336 | 14% |
26 Properties |
| 2007 | £139,003 | 3% |
91 Properties |
| 2006 | £134,685 | 8% |
49 Properties |
| 2005 | £123,346 | 14% |
62 Properties |
| 2004 | £106,407 | 5% |
77 Properties |
| 2003 | £101,040 | 16% |
88 Properties |
| 2002 | £85,320 | -7% |
108 Properties |
| 2001 | £91,096 | 6% |
158 Properties |
| 2000 | £85,893 | 46% |
134 Properties |
| 1999 | £46,565 | 4% |
40 Properties |
| 1998 | £44,783 | -7% |
37 Properties |
| 1997 | £47,948 | 9% |
54 Properties |
| 1996 | £43,514 | 14% |
56 Properties |
| 1995 | £37,456 | - |
36 Properties |
Property Price per Property Type in Lumley
Here you can find historic sold price data in order to help with your property search.
The average Property Paid Price for specific property types in the last three years are:
| Property Type | Average Sold Price | Sold Properties |
|---|---|---|
| Semi Detached House | £185,052.00 | 18 Semi Detached Houses |
| Detached House | £320,861.00 | 37 Detached Houses |
| Terraced House | £81,762.00 | 77 Terraced Houses |
| Flat | £82,500.00 | 3 Flats |

