Houses for sale & to rent in Lumley, Chester Le Street
House Prices in Lumley
Properties in Lumley have an average house price of £198,006.00 and had 216 Property Transactions within the last 3 years¹.
Lumley is an area in Chester Le Street, County Durham with 1,680 households², where the most expensive property was sold for £644,950.00.
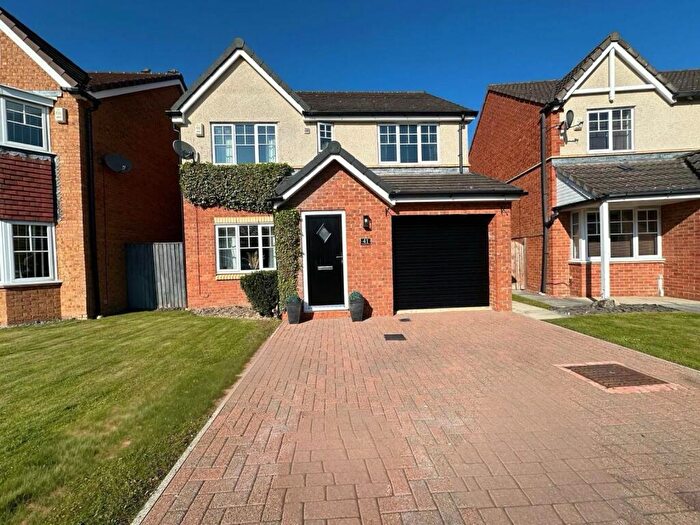
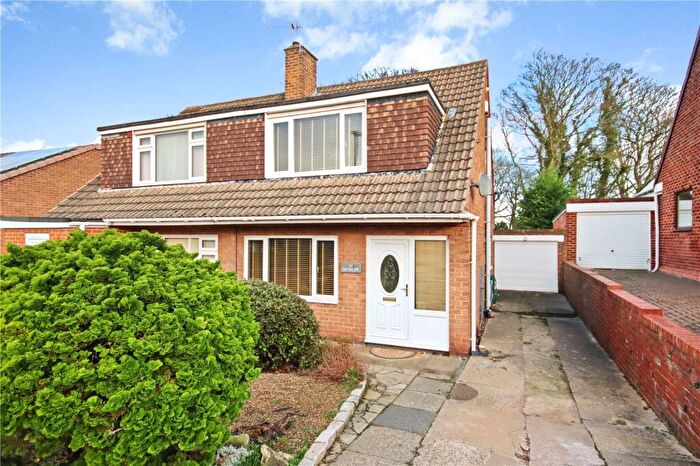
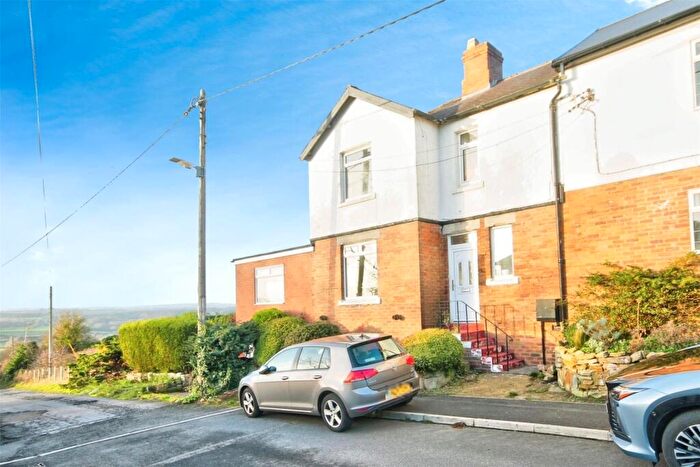
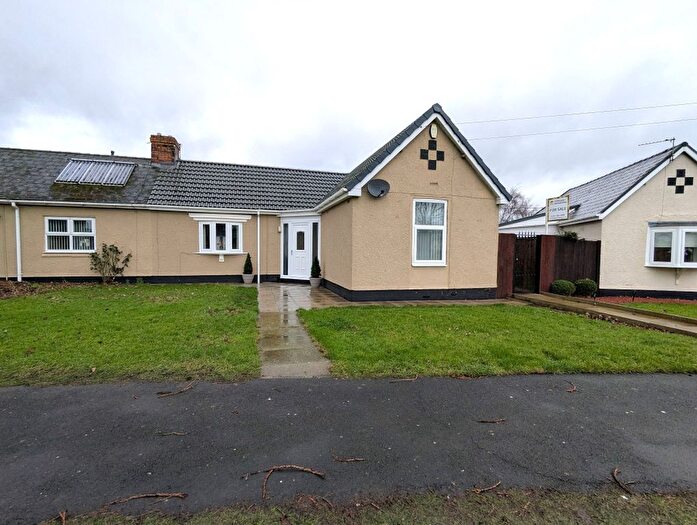
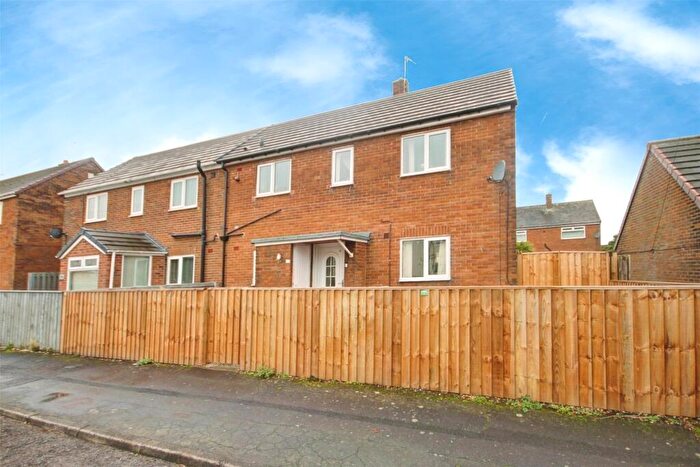
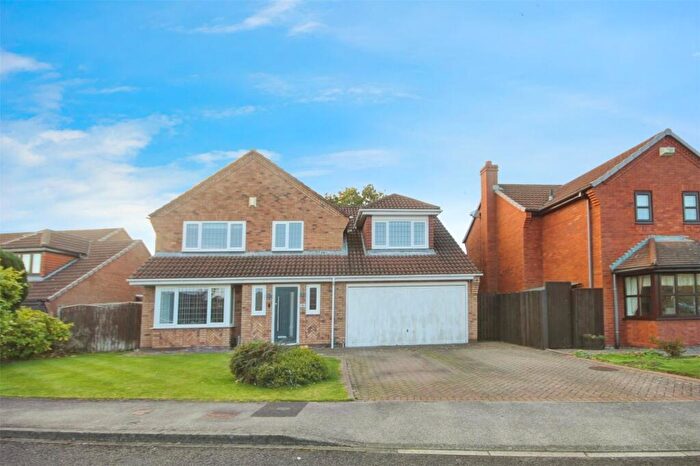
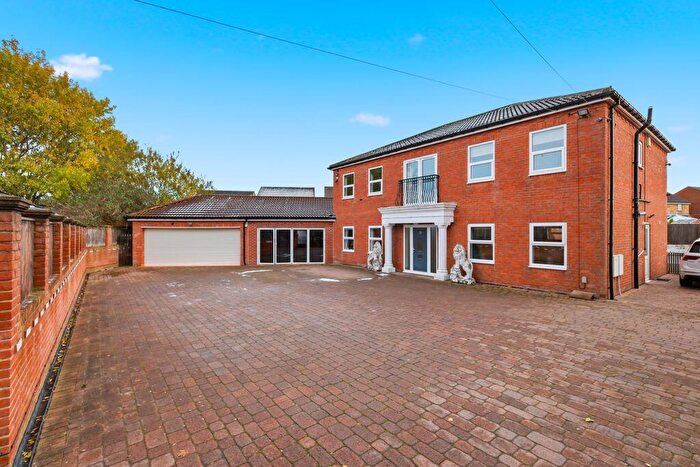
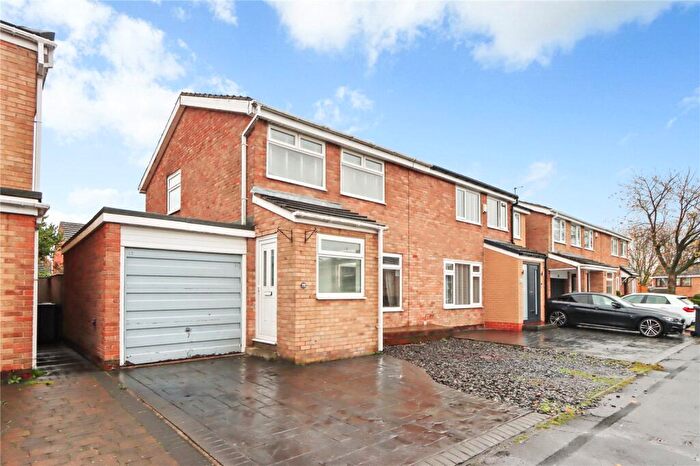
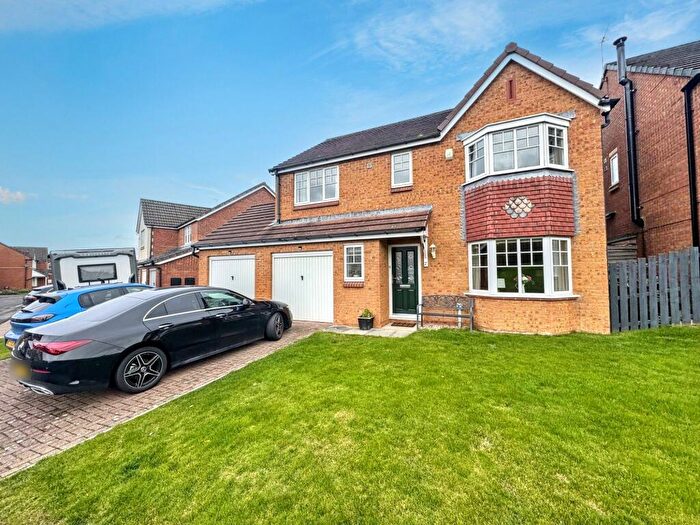
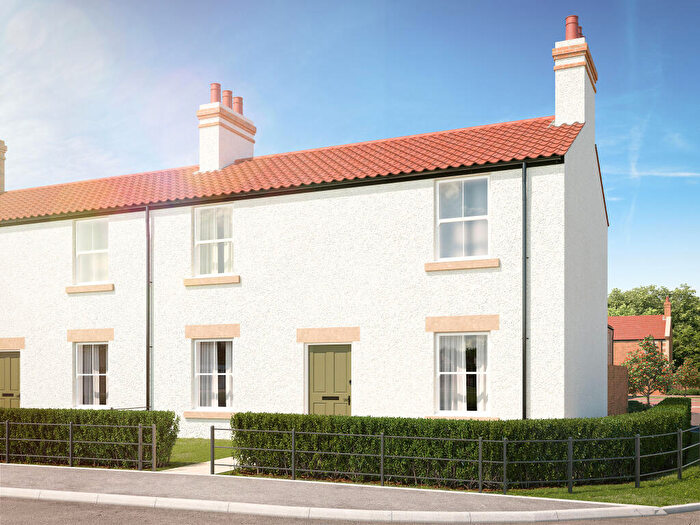
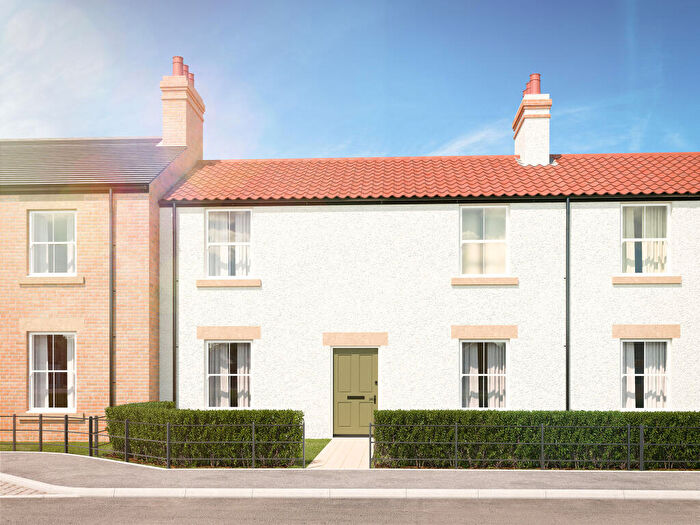
Properties for sale in Lumley
Roads and Postcodes in Lumley
Navigate through our locations to find the location of your next house in Lumley, Chester Le Street for sale or to rent.
| Streets | Postcodes |
|---|---|
| Aged Miners Homes | DH3 4HA |
| Balmoral | DH3 4LP |
| Bank Top | DH3 4HZ |
| Birkot Close | DH3 4EA |
| Bowes Offices | DH3 4AN |
| Brignall Close | DH3 4SU |
| Broadviews | DH3 4HL DH3 4HN |
| Brugeford Way | DH3 4DT |
| Caledonia | DH3 4LR |
| Cambridge Drive | DH3 4QR |
| Canterbury Close | DH3 4LG |
| Churchside | DH3 4JG |
| Cocken Lane | DH3 4JJ |
| Cornriggs Road | DH3 4DX |
| Coverley | DH3 4LS DH3 4LT |
| Cranleigh | DH3 4JN |
| Danelaw | DH3 4LU |
| Derwent Crescent | DH3 4JX |
| Don Crescent | DH3 4JY |
| Durham View | DH3 4QB |
| Eden Crescent | DH3 4DR |
| Eggleston Close | DH3 4SR |
| Esk Avenue | DH3 4LA |
| Exeter Close | DH3 4LJ |
| Featherstone | DH3 4NB |
| Fernleigh | DH3 4JF |
| Front Street | DH3 4ER DH3 4JB DH3 4JE DH3 4QS DH3 4JD |
| Frosterley Drive | DH3 4SJ |
| Gloucester Close | DH3 4LH |
| Grosmont | DH3 4NG DH3 4NQ |
| Hamsterley Close | DH3 4SL |
| Hazel Leigh | DH3 4NL |
| Healeyfield | DH3 4DU |
| Hedworths Drive | DH3 4EB |
| High Barnes | DH3 4HX DH3 4HY |
| Holyrood | DH3 4LY |
| Houghton Gate | DH3 4PD DH3 4PE |
| Kenilworth | DH3 4LZ |
| Lambton Park | DH3 4PF DH3 4PG DH3 4PH DH3 4PJ DH3 4PL DH3 4PQ DH3 4PT DH3 4PU DH3 4PX DH3 4QA |
| Land Associated With | DH3 4LQ |
| Lartington Court | DH3 4ST |
| Launceston | DH3 4NJ |
| Lichfield Close | DH3 4QH |
| Lincoln Walk | DH3 4QN |
| Loefield | DH3 4HR DH3 4HS |
| Lombard Place | DH3 4LE DH3 4QP |
| Lumley Park | DH3 4BF DH3 4NT DH3 4PA DH3 4PB |
| Lumley Thicks | DH3 4HF |
| Lunedale Close | DH3 4SS |
| Medway | DH3 4HT DH3 4HU |
| Melbeck Court | DH3 4GW |
| Mickleton Close | DH3 4SN |
| Minsterley | DH3 4NH |
| Nenthead Close | DH3 4SP |
| New Bridge Bank | DH3 4NU |
| Norwich Close | DH3 4QL |
| Ouse Crescent | DH3 4LB |
| Pear Tree Terrace | DH3 4HD |
| Pendragon | DH3 4NA |
| Rectory Green | DH3 4DZ |
| Riding Hill | DH3 4HP DH3 4HW DH3 4HH |
| Runnymede | DH3 4LN DH3 4LW |
| Sandbach | DH3 4LL |
| Scorers Lane | DH3 4JH |
| Scott Court | DH3 4SX |
| Seven Acres | DH3 4JS DH3 4JT |
| Sherborne | DH3 4ND |
| St Albans Close | DH3 4QJ |
| St Elvins Place | DH3 4JW |
| Stainmore Drive | DH3 4SH |
| Startforth Close | DH3 4SW |
| Strathmore | DH3 4LX |
| Swale Crescent | DH3 4JU |
| The Crossways | DH3 4JP |
| Tinkler Terrace | DH3 4HB |
| Tintagel | DH3 4NE DH3 4NF |
| Trent Crescent | DH3 4LD |
| Tyne Close | DH3 4DP |
| Waskerley Avenue | DH3 4DW |
| Wear Crescent | DH3 4JZ |
| Winchester Close | DH3 4LF |
| Windsor Terrace | DH3 4JR |
| Worcester Close | DH3 4QQ |
| DH3 4EX DH3 4HE DH3 4DS DH3 4ES DH3 4EU DH3 4EY DH3 4HG DH3 4JL DH3 4NS DH3 4NX DH3 4QW |
Transport near Lumley
-
Chester-Le-Street Station
-
Durham Station
-
Heworth Station
-
Sunderland Station
-
Seaham Station
-
Dunston Station
-
Newcastle Station
-
Manors Station
-
MetroCentre Station
- FAQ
- Price Paid By Year
- Property Type Price
Frequently asked questions about Lumley
What is the average price for a property for sale in Lumley?
The average price for a property for sale in Lumley is £198,006. This amount is 22% higher than the average price in Chester Le Street. There are 483 property listings for sale in Lumley.
What streets have the most expensive properties for sale in Lumley?
The streets with the most expensive properties for sale in Lumley are Sandbach at an average of £385,000, Eden Crescent at an average of £377,071 and Brignall Close at an average of £376,666.
What streets have the most affordable properties for sale in Lumley?
The streets with the most affordable properties for sale in Lumley are Lincoln Walk at an average of £61,222, Canterbury Close at an average of £76,500 and Land Associated With at an average of £81,500.
Which train stations are available in or near Lumley?
Some of the train stations available in or near Lumley are Chester-Le-Street, Durham and Heworth.
Property Price Paid in Lumley by Year
The average sold property price by year was:
| Year | Average Sold Price | Price Change |
Sold Properties
|
|---|---|---|---|
| 2025 | £212,363 | 11% |
33 Properties |
| 2024 | £188,946 | -0,1% |
53 Properties |
| 2023 | £189,088 | -7% |
47 Properties |
| 2022 | £203,133 | -15% |
83 Properties |
| 2021 | £233,188 | 11% |
90 Properties |
| 2020 | £208,392 | 17% |
76 Properties |
| 2019 | £173,921 | 19% |
73 Properties |
| 2018 | £140,944 | -12% |
44 Properties |
| 2017 | £157,433 | -1% |
46 Properties |
| 2016 | £159,026 | 7% |
36 Properties |
| 2015 | £147,342 | 7% |
40 Properties |
| 2014 | £137,056 | 13% |
50 Properties |
| 2013 | £119,685 | -7% |
30 Properties |
| 2012 | £127,868 | -9% |
27 Properties |
| 2011 | £138,859 | -0,1% |
22 Properties |
| 2010 | £138,981 | 5% |
33 Properties |
| 2009 | £131,841 | -29% |
35 Properties |
| 2008 | £170,008 | 9% |
29 Properties |
| 2007 | £154,399 | 3% |
68 Properties |
| 2006 | £149,126 | -10% |
57 Properties |
| 2005 | £163,353 | 25% |
49 Properties |
| 2004 | £123,040 | 5% |
44 Properties |
| 2003 | £116,933 | 16% |
65 Properties |
| 2002 | £98,758 | 20% |
59 Properties |
| 2001 | £79,482 | 9% |
70 Properties |
| 2000 | £72,568 | 0,5% |
77 Properties |
| 1999 | £72,232 | 0,1% |
75 Properties |
| 1998 | £72,152 | 16% |
64 Properties |
| 1997 | £60,364 | 8% |
57 Properties |
| 1996 | £55,275 | -25% |
69 Properties |
| 1995 | £68,824 | - |
98 Properties |
Property Price per Property Type in Lumley
Here you can find historic sold price data in order to help with your property search.
The average Property Paid Price for specific property types in the last three years are:
| Property Type | Average Sold Price | Sold Properties |
|---|---|---|
| Semi Detached House | £179,799.00 | 118 Semi Detached Houses |
| Detached House | £326,495.00 | 33 Detached Houses |
| Terraced House | £180,564.00 | 34 Terraced Houses |
| Flat | £149,661.00 | 31 Flats |

