
Houses for sale in Sherburn, Houghton Le Spring
House Prices in Sherburn
Properties in Sherburn have an average house price of £189k and had 100 Property Transactions within the last 3 years¹.
Sherburn is an area in Houghton Le Spring, County Durham with 1,101 households², where the most expensive property was sold for £675k.
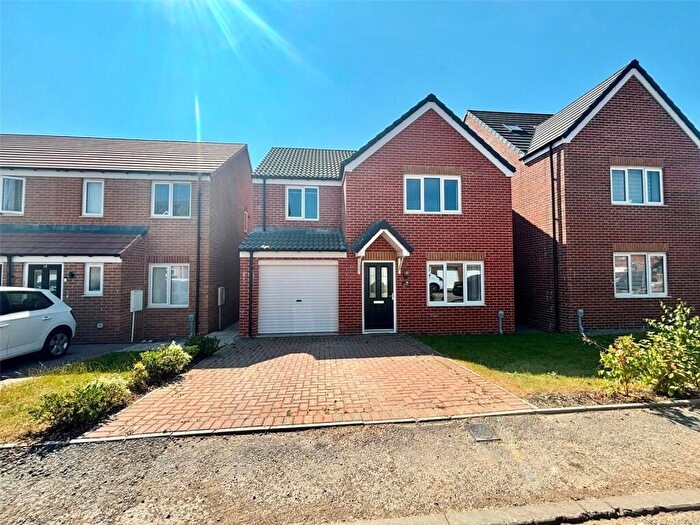
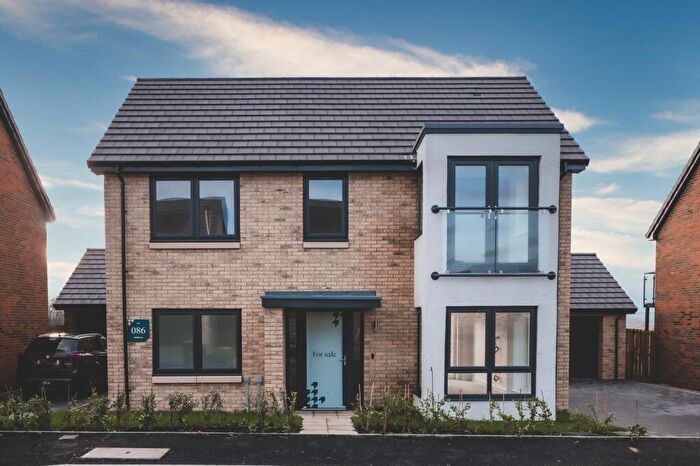
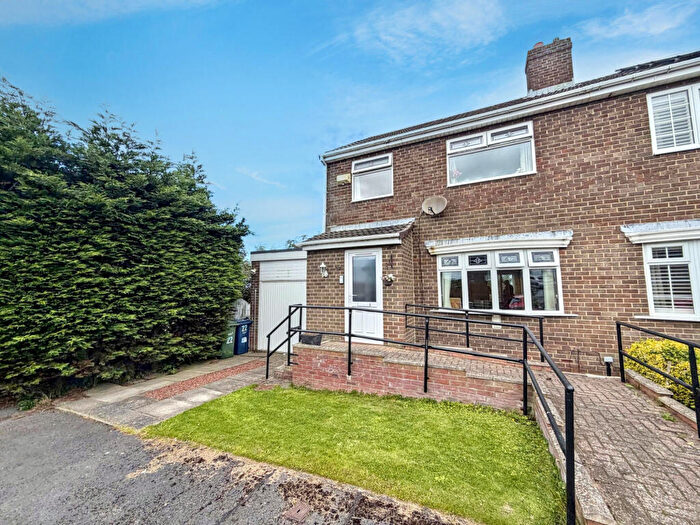
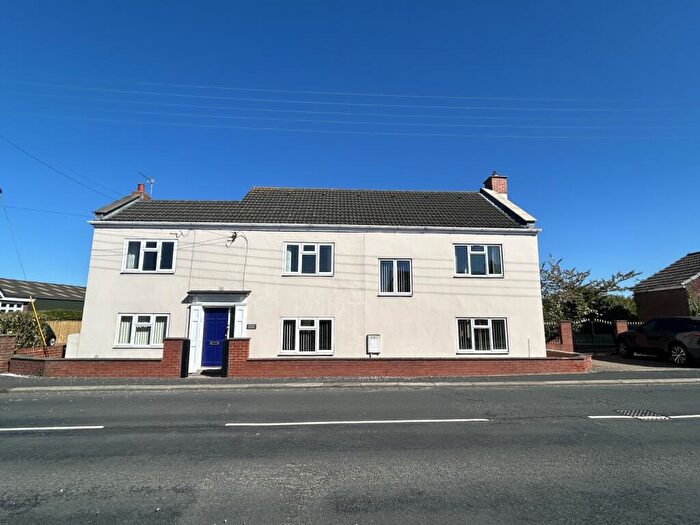
Properties for sale in Sherburn
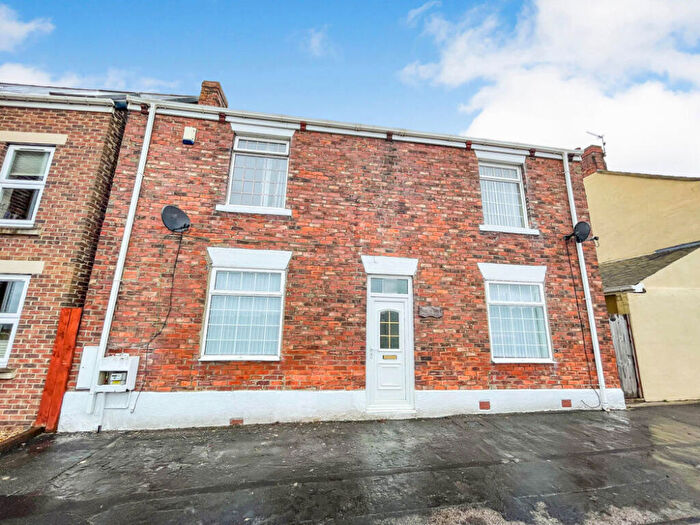
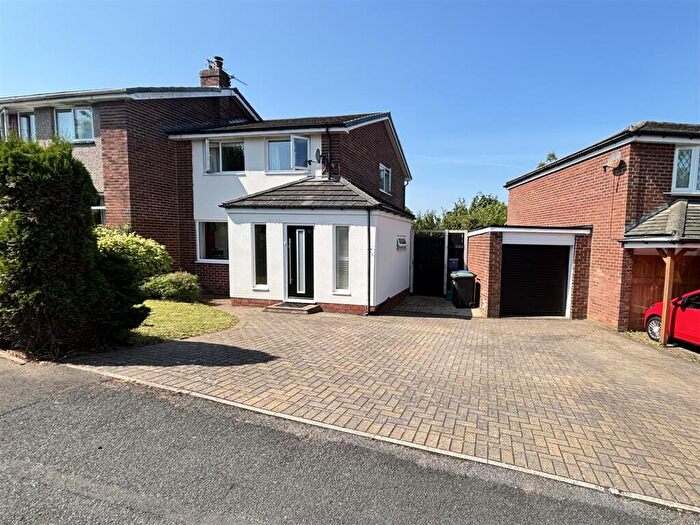
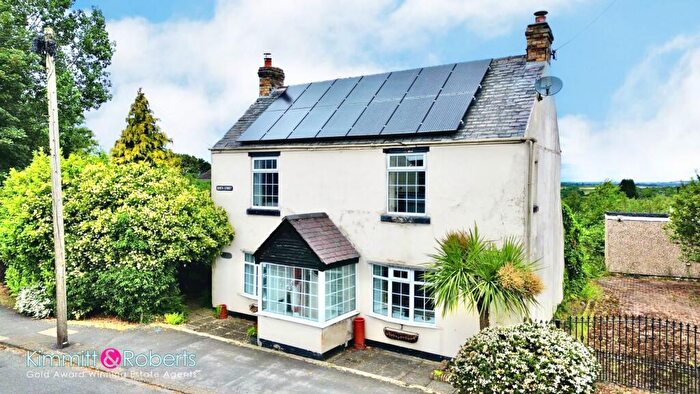
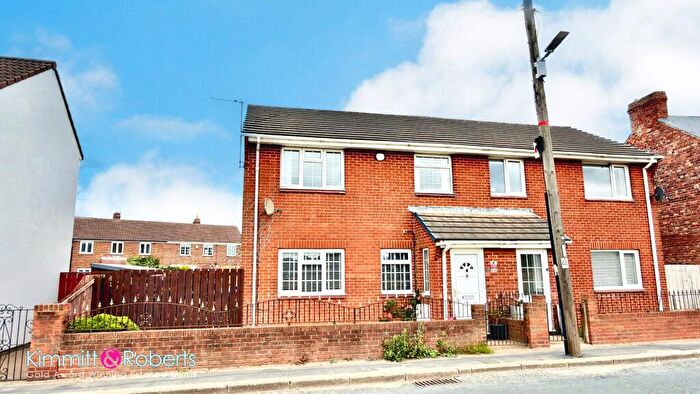
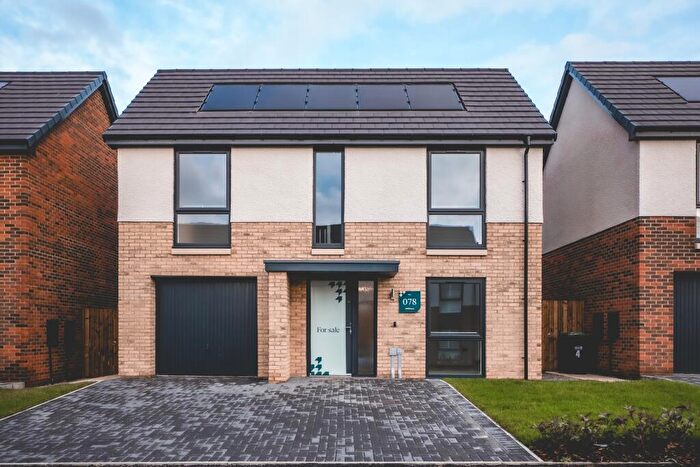
![]()
If you are looking to sell your house, let it out, or receive a property valuation, an expert can help you.
Click the button below to get started.
Roads and Postcodes in Sherburn
Navigate through our locations to find the location of your next house in Sherburn, Houghton Le Spring for sale or to rent.
| Streets | Postcodes |
|---|---|
| Adventure Lane | DH4 6PW |
| Allenson View | DH4 6RE |
| Benridge Bank | DH4 6NN DH4 6SW |
| Burns Close | DH4 6SY |
| Carr Row | DH4 6QH |
| Chantry Place | DH4 6PP |
| Chapel View | DH4 6RS |
| Church Street | DH4 6NR |
| Cocken Road | DH4 6QN |
| Currys Buildings | DH4 6QU |
| Dene View | DH4 6NS |
| Fair View | DH4 6RU DH4 6RX DH4 6RY |
| Finchale Court | DH4 6SS |
| Finchale View | DH4 6SD |
| Hall Close | DH4 6PQ |
| Hall Lane | DH4 6PF |
| Jellicoe Terrace | DH4 6QW |
| Lambton View | DH4 6QL |
| Lea Rigg | DH4 6SR |
| Leamside | DH4 6QF DH4 6QJ DH4 6QS DH4 6QT |
| Low Station Road | DH4 6QX |
| Marks Lane | DH4 6NX |
| Masons Court | DH4 6FS |
| North Street | DH4 6NU |
| Pit House Lane | DH4 6QQ DH4 6QR |
| Pittington Road | DH5 9RG |
| Prospect View | DH4 6RP DH4 6RW |
| Rainton Gate | DH4 6QY DH4 6SQ |
| Rainton View | DH4 6RT |
| Ronan Mews | DH4 6SX |
| School Avenue | DH4 6RZ DH4 6SA |
| School View | DH4 6RR |
| Sheen Close | DH4 6PE |
| South Street | DH4 6PA DH4 6PD |
| St Godrics Drive | DH4 6SZ |
| St Marys Drive | DH4 6SP |
| Station Road | DH4 6SE DH4 6SF DH4 6SG |
| The Crescent | DH4 6SB |
| The Dene | DH4 6PR |
| The Meadows | DH4 6NP |
| Tollgate Fields | DH4 6SJ |
| Woodland View | DH4 6RH DH4 6RJ DH4 6RL DH4 6RQ |
| DH4 6RN DH5 9RH DH4 6NT DH4 6PY DH4 6QG DH4 6RG DH4 6SH |
Property price trends in Sherburn
According to the latest Land Registry data, the average home in Sherburn sold for £222,500 in 2026. That figure comes from 1,138 sales logged over the past 31 years.
Prices have continued to climb over the last three years. Compared with 2023, when the typical sale came in around £159,189, that's a rise of roughly 39.8%.
Looking back five years, average prices are up about 50.1% since 2021, a gain of around £74,261 in cash terms.
Zoom out to the past decade for the fuller picture. Back in 2016, homes here averaged £174,741, so the typical sold price has climbed about 27.3% since then, roughly 2.4% a year. Stretch the view to fifteen years and that annual pace edges up closer to 4.2%.
Frequently asked questions about Sherburn
What is the average price for a property for sale in Sherburn?
The average price for a property for sale in Sherburn is £189,423. This amount is 9% higher than the average price in Houghton Le Spring. There are 638 property listings for sale in Sherburn.
What streets have the most expensive properties for sale in Sherburn?
The streets with the most expensive properties for sale in Sherburn are Pittington Road at an average of £675,000, Marks Lane at an average of £482,500 and The Dene at an average of £440,000.
What streets have the most affordable properties for sale in Sherburn?
The streets with the most affordable properties for sale in Sherburn are Rainton View at an average of £77,050, The Crescent at an average of £80,000 and Woodland View at an average of £89,286.
Which train stations are available in or near Sherburn?
Some of the train stations available in or near Sherburn are Durham, Chester-Le-Street and Seaham.
Property Price Paid in Sherburn by Year
The average sold property price by year was:
| Year | Average Sold Price | Price Change |
Sold Properties
|
|---|---|---|---|
| 2026 | £222,500 | -4% |
2 Properties |
| 2025 | £230,676 | 21% |
29 Properties |
| 2024 | £182,721 | 13% |
35 Properties |
| 2023 | £159,189 | 5% |
34 Properties |
| 2022 | £150,829 | 2% |
47 Properties |
| 2021 | £148,239 | -1% |
62 Properties |
| 2020 | £149,967 | 7% |
35 Properties |
| 2019 | £139,406 | 15% |
36 Properties |
| 2018 | £119,028 | -7% |
32 Properties |
| 2017 | £127,805 | -37% |
36 Properties |
Property Price per Property Type in Sherburn
Here you can find historic sold price data in order to help with your property search.
The average Property Paid Price for specific property types in the last three years are:
| Property Type | Average Sold Price | Sold Properties |
|---|---|---|
| Semi Detached House | £135,589.00 | 45 Semi Detached Houses |
| Detached House | £352,378.00 | 25 Detached Houses |
| Terraced House | £141,090.00 | 26 Terraced Houses |
| Flat | £90,750.00 | 4 Flats |
