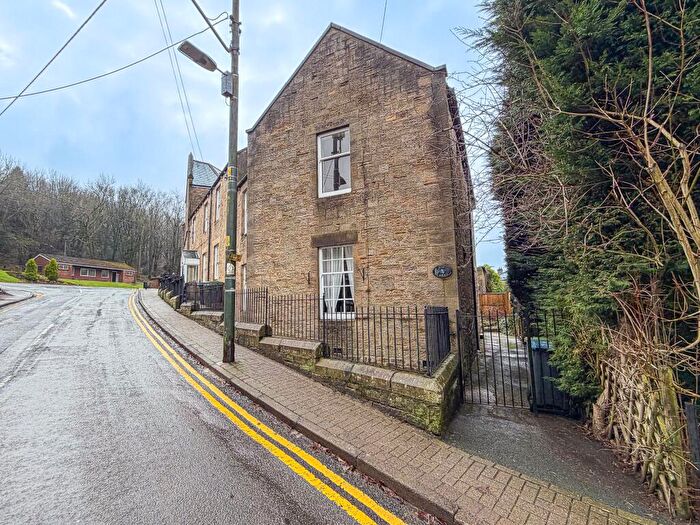
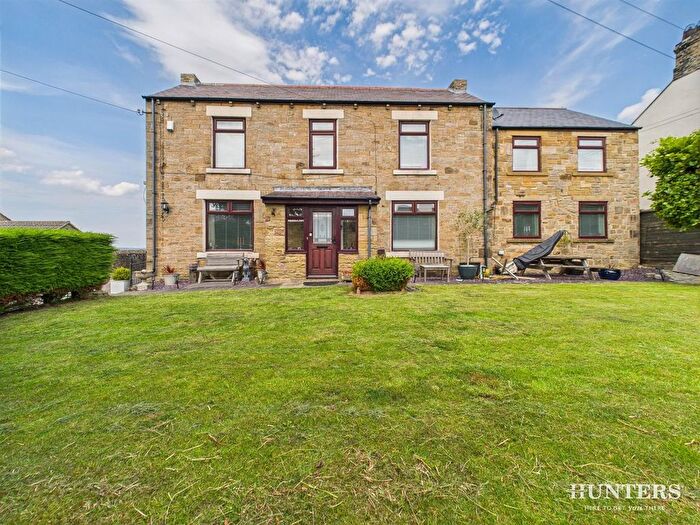
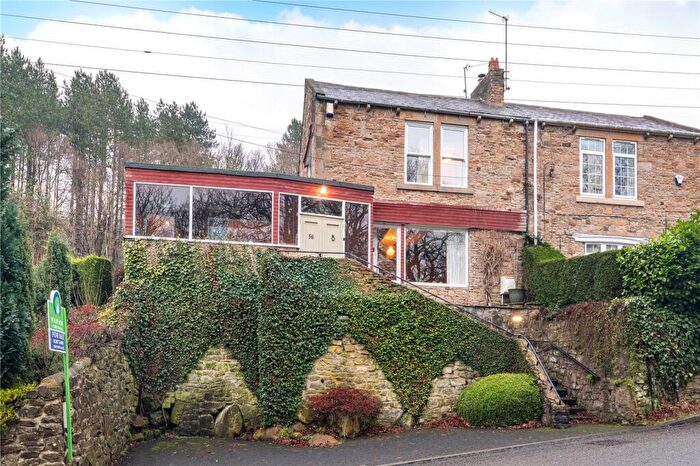
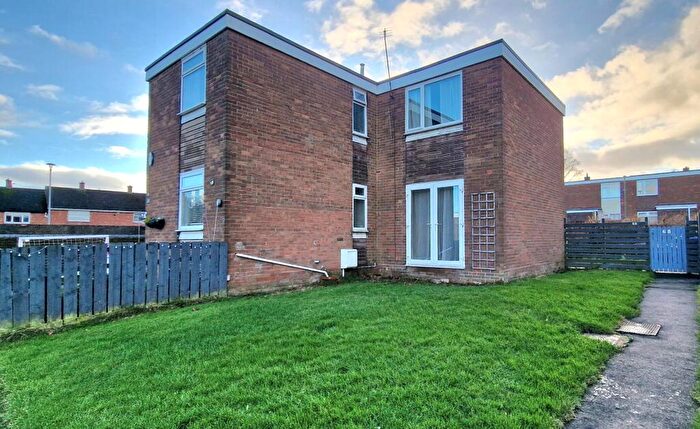
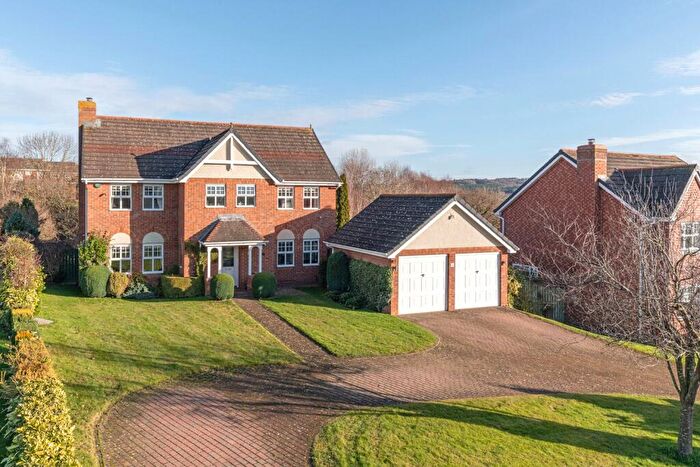
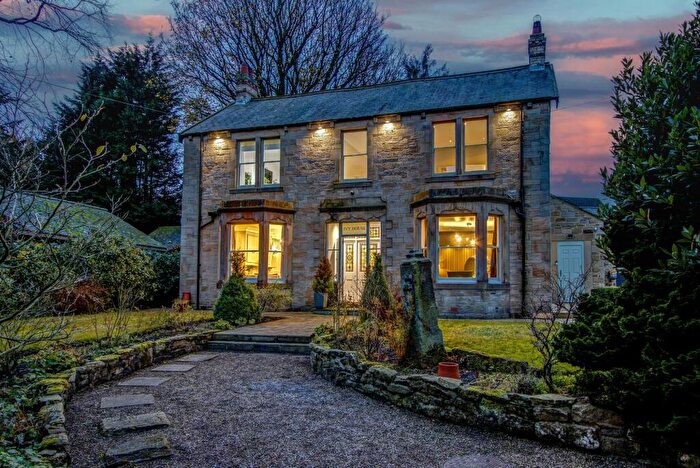
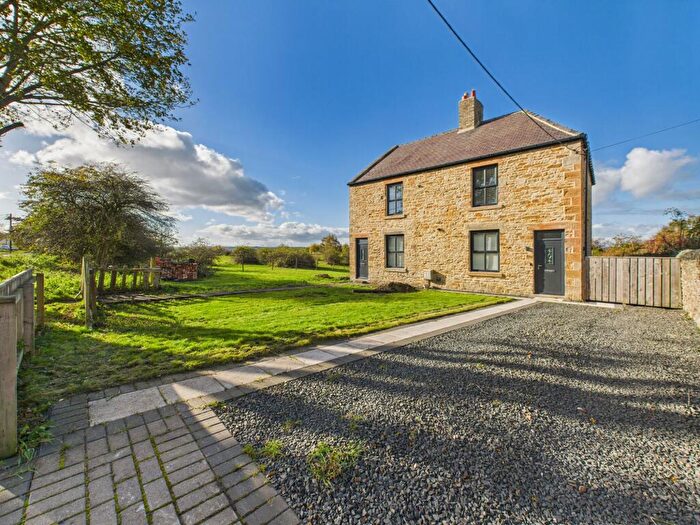
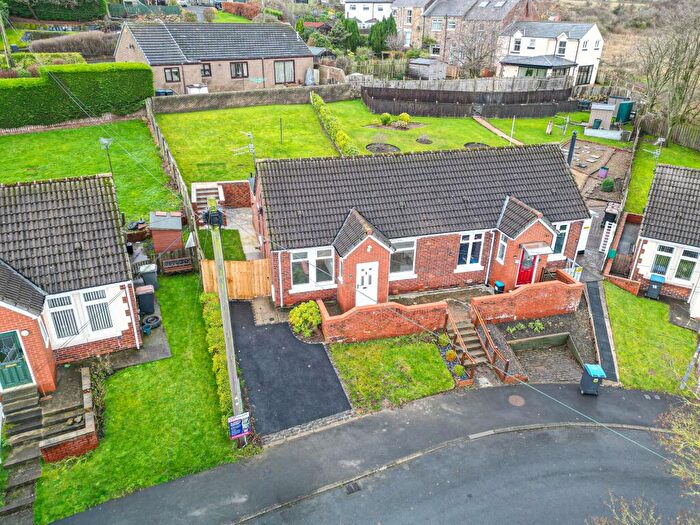
Houses for sale & to rent in Burnopfield And Dipton, Newcastle Upon Tyne
House Prices in Burnopfield And Dipton
Properties in Burnopfield And Dipton have an average house price of £163,776.00 and had 244 Property Transactions within the last 3 years¹.
Burnopfield And Dipton is an area in Newcastle Upon Tyne, County Durham with 2,217 households², where the most expensive property was sold for £600,000.00.
Properties for sale in Burnopfield And Dipton
Roads and Postcodes in Burnopfield And Dipton
Navigate through our locations to find the location of your next house in Burnopfield And Dipton, Newcastle Upon Tyne for sale or to rent.
| Streets | Postcodes |
|---|---|
| Aged Miners Homes | NE16 6QJ |
| Albion Court | NE16 6LS |
| Albion Gardens | NE16 6JR NE16 6JS NE16 6JT |
| Anderson Court | NE16 6LY |
| Aspen Grove | NE16 6QP |
| Beech Terrace | NE16 6DT |
| Birch Crescent | NE16 6JJ NE16 6JQ |
| Birch Mews | NE16 6LL |
| Bowesville | NE16 6DZ |
| Brackenridge | NE16 6LH |
| Briar Terrace | NE16 6DX |
| Briardene | NE16 6LJ |
| Broom Terrace | NE16 6DS |
| Bryans Leap | NE16 6BL NE16 6BN NE16 6BP NE16 6BS NE16 6BT NE16 6BU NE16 6BW NE16 6BX NE16 6HH NE16 6HQ |
| Burneze Place | NE16 6ES |
| Busty Bank | NE16 6BQ NE16 6NF NE16 6NG NE16 6BH NE16 6BJ |
| Cavendish Place | NE16 6EN |
| Cawthorne Terrace | NE16 6EJ |
| Cedar Crescent | NE16 6HU |
| Chapel Avenue | NE16 6NW |
| Cooperative Terrace | NE16 6NH |
| Cragleas | NE16 6EH |
| Crathorne Court | NE16 6DA |
| Cricket Terrace | NE16 6QL |
| Crookwell Hill | NE16 6DG |
| Dene View | NE16 6QA |
| Derwent Terrace | NE16 6NE |
| Derwent View | NE16 6PZ |
| East View | NE16 6HP |
| Eden Avenue | NE16 6QQ |
| Edward Street | NE16 6EP |
| Elm Grove | NE16 6HF |
| Fair View | NE16 6AW |
| Fell Terrace | NE16 6DW |
| Fieldfare Court | NE16 6LW |
| Fir Terrace | NE16 6DP |
| Folly Close | NE16 6DF |
| Friars Row | NE16 6JZ |
| Friarside Gardens | NE16 6JW |
| Front Street | NE16 6EE NE16 6EF NE16 6HG NE16 6LU NE16 6LZ NE16 6PT NE16 6PU NE16 6PX NE16 6PY NE16 6LX |
| Garesfield Gardens | NE16 6LB NE16 6LD NE16 6LE NE16 6LF NE16 6LG NE16 6LQ |
| Gibside Terrace | NE16 6NJ |
| Grove Terrace | NE16 6NP |
| Hazel Grove | NE16 6DU |
| Heather Terrace | NE16 6DR |
| High Friarside | NE16 6AN |
| Hill Crest | NE16 6ND |
| Hobson Industrial Estate | NE16 6EA |
| Holly Terrace | NE16 6DY |
| Lambton Gardens | NE16 6JY |
| Lapwing Court | NE16 6LP |
| Laurel Terrace | NE16 6HY |
| Leazes Villas | NE16 6HN NE16 6HW |
| Lilac Crescent | NE16 6QF |
| Lintz Lane | NE16 6AT NE16 6AS |
| Lintz Terrace | NE16 6JN |
| Low Friarside Lane | NE16 6BR |
| Lumley Gardens | NE16 6JX |
| Magnolia Grove | NE16 6QN |
| Maple Terrace | NE16 6JB |
| Moor Close | NE16 6DE |
| Mountsett | NE16 6AZ NE16 6BA |
| Moyle Terrace | NE16 6EQ |
| Mulberry Grove | NE16 6ET |
| Myrtle Grove | NE16 6HX |
| Oak Terrace | NE16 6NR |
| Oakfields | NE16 6PQ |
| Park Terrace | NE16 6QD |
| Park View | NE16 6QE |
| Pickering Lodge Court | NE16 6DB |
| Pine Avenue | NE16 6JA |
| Plover Drive | NE16 6LR |
| Police Houses | NE16 6JH |
| Poplar Avenue | NE16 6HZ |
| Priestfield Gardens | NE16 6JL |
| Prospect Terrace | NE16 6EL |
| Raby Gardens | NE16 6JU |
| Raglan Place | NE16 6NN |
| Robinson Terrace | NE16 6EG |
| Rose Cottages | NE16 6AP |
| Rowan Court | NE16 6PJ |
| Sandy Path Lane | NE16 6BY |
| Sheephill | NE16 6NA NE16 6NB |
| Stone Drive | NE16 6DD |
| Syke Road | NE16 6AU NE16 6JE NE16 6JF NE16 6HD NE16 6JG |
| The Close | NE16 6LN |
| The Copse | NE16 6HA |
| The Fell | NE16 6DN |
| The Fold | NE16 6AQ |
| The Leazes | NE16 6HL NE16 6HR NE16 6HS NE16 6HT NE16 6HJ |
| The Meadows | NE16 6QW |
| The Rookery | NE16 6HB |
| The Sycamores | NE16 6PH |
| Thornhill Gardens | NE16 6JP |
| Valley View | NE16 6JD |
| Waggon Hill Farm Cottages | NE16 6AY |
| Watson Street | NE16 6NL |
| West View | NE16 6QH |
| Westwood Close | NE16 6NQ |
| Wigham Terrace | NE16 6EW |
| Willow View | NE16 6QB |
| Wood Street | NE16 6QG |
| Woodland Mews | NE16 6BF |
| NE16 6AF NE16 6AH NE16 6AJ NE16 6AR NE16 6DL NE16 6EB NE16 6ER NE16 6AG NE16 6AL NE16 6BB NE16 6BZ NE16 6ED NE16 6EU |
Transport near Burnopfield And Dipton
- FAQ
- Price Paid By Year
- Property Type Price
Frequently asked questions about Burnopfield And Dipton
What is the average price for a property for sale in Burnopfield And Dipton?
The average price for a property for sale in Burnopfield And Dipton is £163,776. This amount is 2% lower than the average price in Newcastle Upon Tyne. There are 745 property listings for sale in Burnopfield And Dipton.
What streets have the most expensive properties for sale in Burnopfield And Dipton?
The streets with the most expensive properties for sale in Burnopfield And Dipton are The Fell at an average of £371,500, Plover Drive at an average of £297,500 and Valley View at an average of £287,500.
What streets have the most affordable properties for sale in Burnopfield And Dipton?
The streets with the most affordable properties for sale in Burnopfield And Dipton are Birch Mews at an average of £59,000, Mountsett at an average of £65,000 and Wigham Terrace at an average of £71,500.
Which train stations are available in or near Burnopfield And Dipton?
Some of the train stations available in or near Burnopfield And Dipton are Blaydon, MetroCentre and Dunston.
Property Price Paid in Burnopfield And Dipton by Year
The average sold property price by year was:
| Year | Average Sold Price | Price Change |
Sold Properties
|
|---|---|---|---|
| 2025 | £162,871 | 1% |
73 Properties |
| 2024 | £161,097 | -4% |
96 Properties |
| 2023 | £168,087 | 9% |
75 Properties |
| 2022 | £153,002 | -3% |
103 Properties |
| 2021 | £157,271 | 6% |
112 Properties |
| 2020 | £147,749 | -4% |
88 Properties |
| 2019 | £153,280 | 7% |
87 Properties |
| 2018 | £142,865 | 1% |
74 Properties |
| 2017 | £140,932 | 1% |
95 Properties |
| 2016 | £139,928 | -3% |
108 Properties |
| 2015 | £143,959 | 12% |
116 Properties |
| 2014 | £127,270 | 1% |
95 Properties |
| 2013 | £126,189 | -13% |
70 Properties |
| 2012 | £143,116 | 6% |
48 Properties |
| 2011 | £134,197 | -5% |
48 Properties |
| 2010 | £141,171 | 9% |
59 Properties |
| 2009 | £128,752 | -2% |
60 Properties |
| 2008 | £131,212 | -9% |
66 Properties |
| 2007 | £142,561 | 6% |
127 Properties |
| 2006 | £134,638 | 1% |
128 Properties |
| 2005 | £133,164 | 6% |
94 Properties |
| 2004 | £124,795 | 22% |
108 Properties |
| 2003 | £97,228 | 18% |
135 Properties |
| 2002 | £79,728 | 10% |
137 Properties |
| 2001 | £71,960 | 3% |
152 Properties |
| 2000 | £69,676 | 19% |
151 Properties |
| 1999 | £56,328 | 8% |
94 Properties |
| 1998 | £52,069 | 2% |
83 Properties |
| 1997 | £51,262 | 11% |
83 Properties |
| 1996 | £45,531 | -9% |
74 Properties |
| 1995 | £49,597 | - |
62 Properties |
Property Price per Property Type in Burnopfield And Dipton
Here you can find historic sold price data in order to help with your property search.
The average Property Paid Price for specific property types in the last three years are:
| Property Type | Average Sold Price | Sold Properties |
|---|---|---|
| Semi Detached House | £160,403.00 | 78 Semi Detached Houses |
| Detached House | £272,490.00 | 45 Detached Houses |
| Terraced House | £127,432.00 | 112 Terraced Houses |
| Flat | £101,722.00 | 9 Flats |

