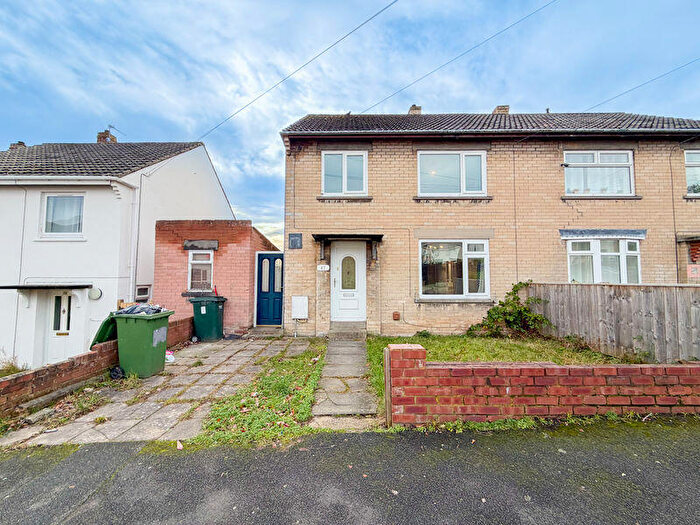
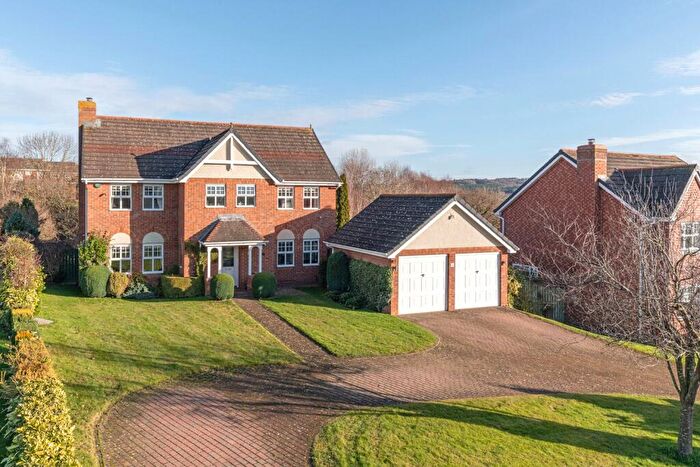
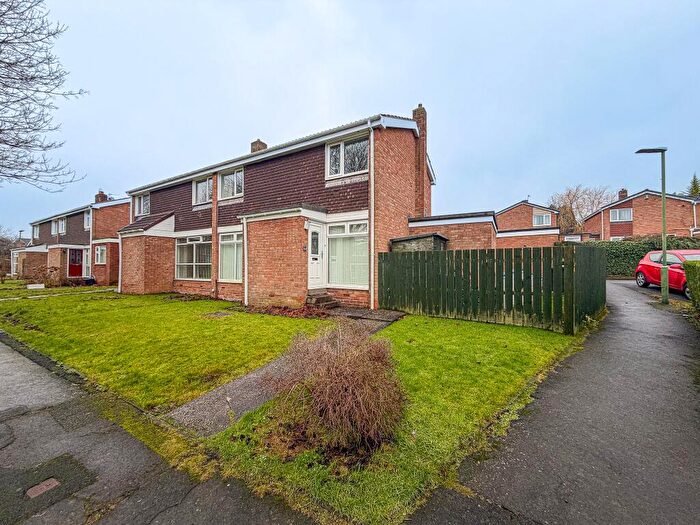
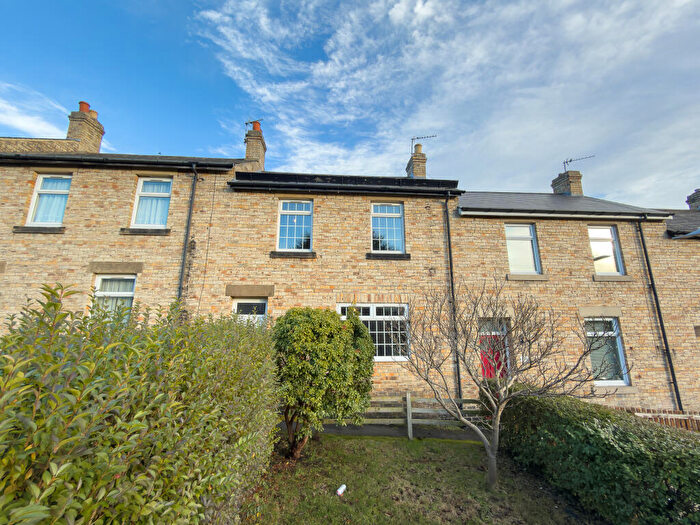
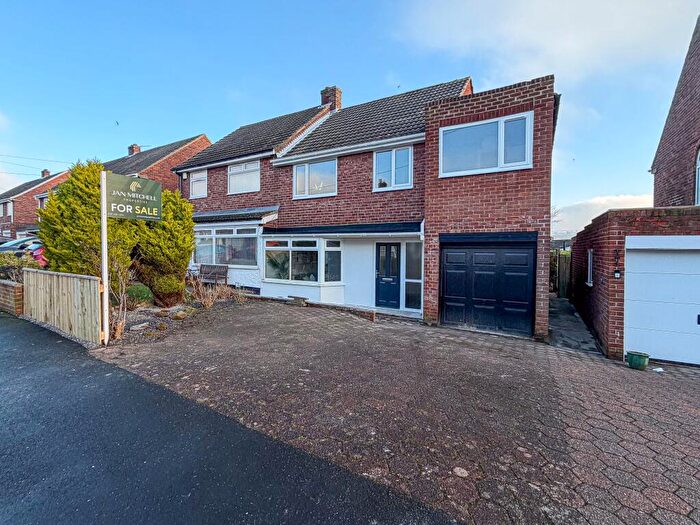
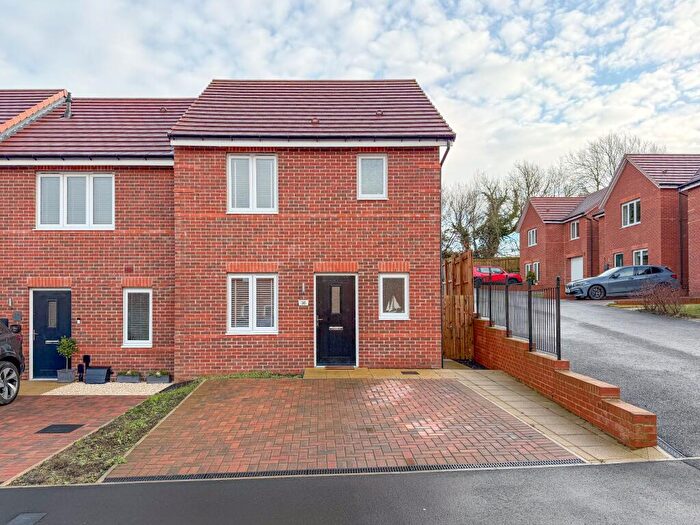
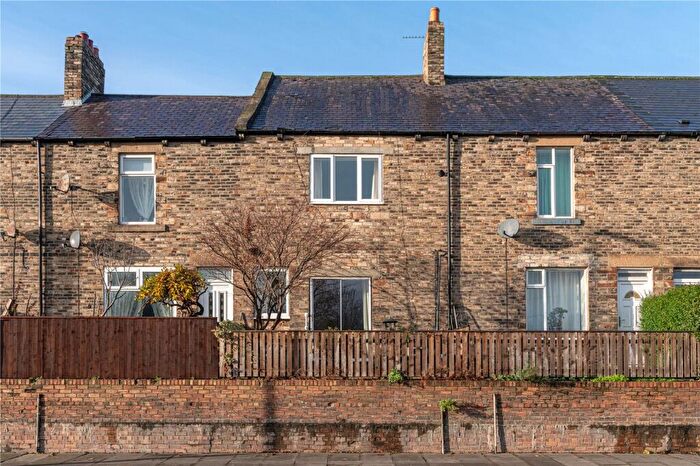
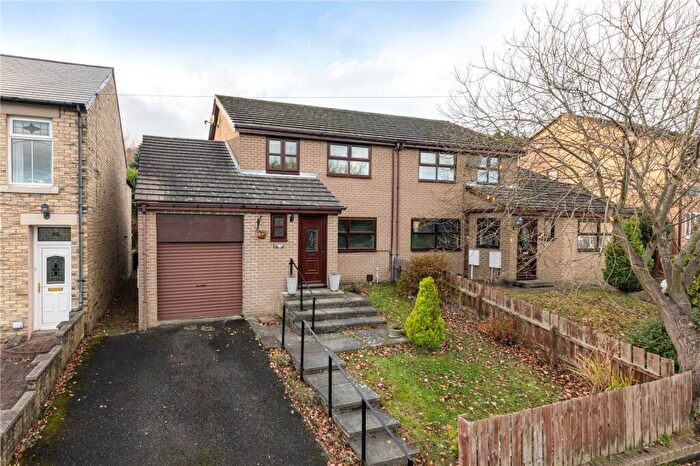
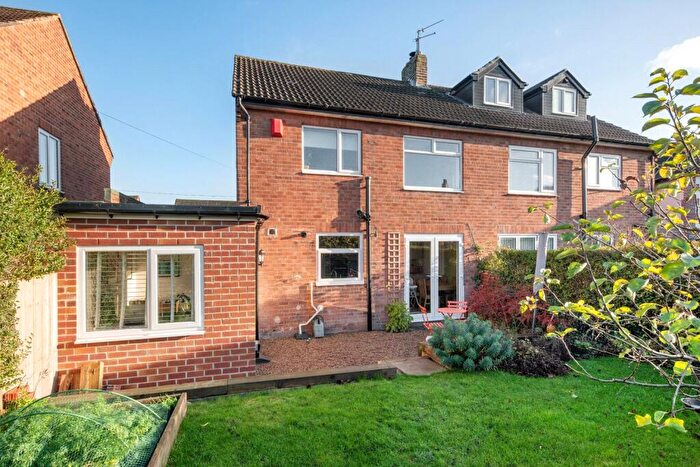
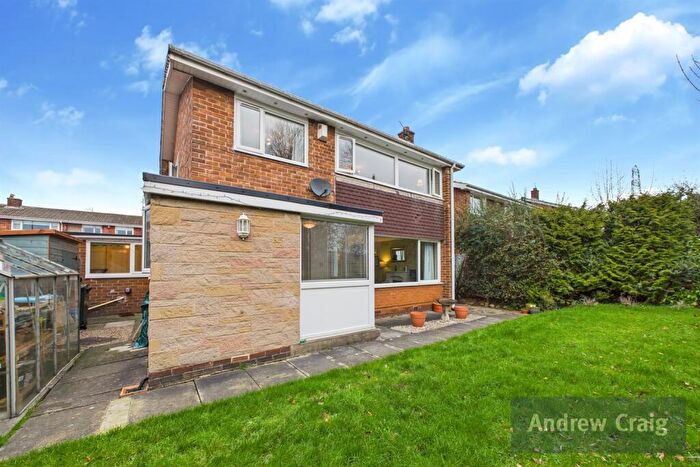
Houses for sale & to rent in Chopwell And Rowlands Gill, Rowlands Gill
House Prices in Chopwell And Rowlands Gill
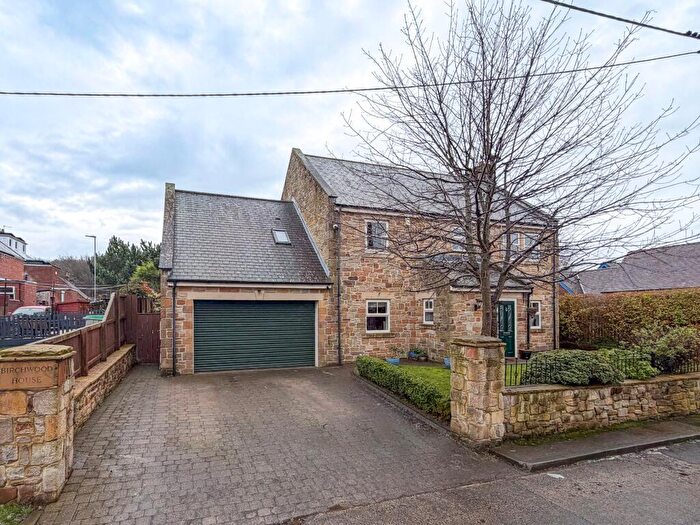
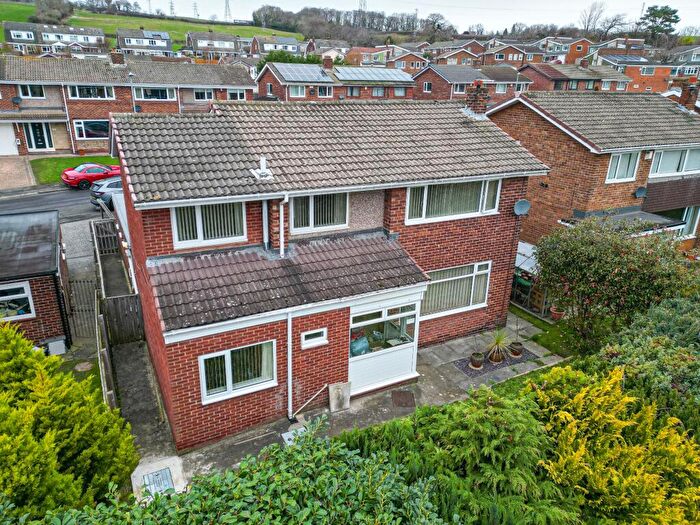
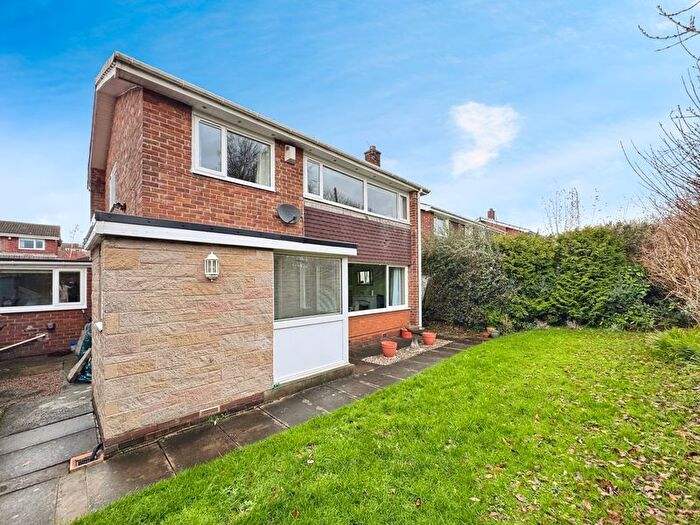
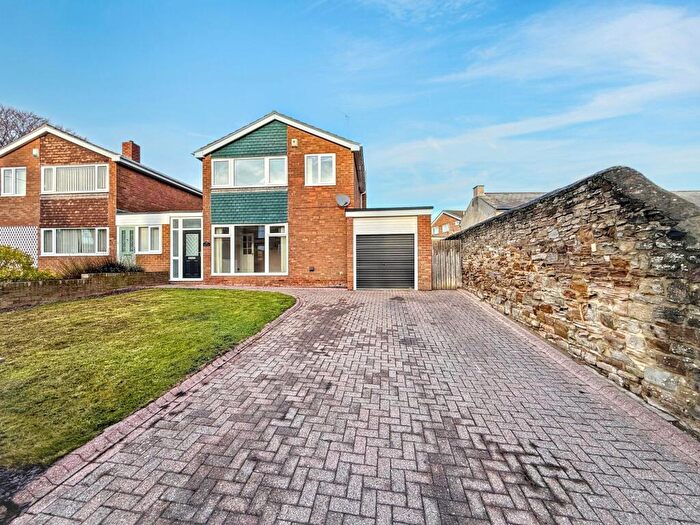
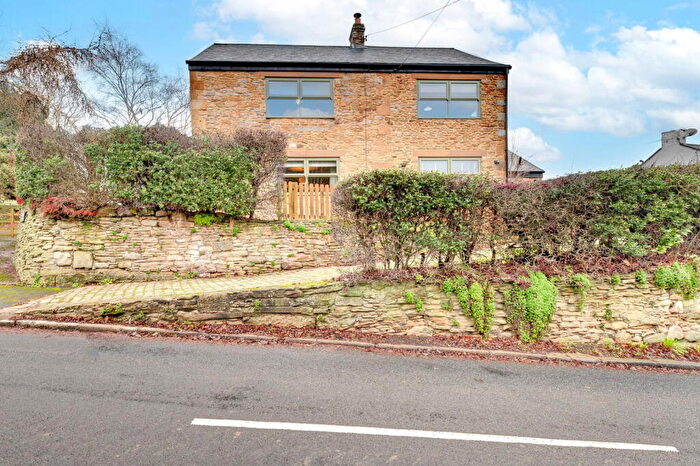
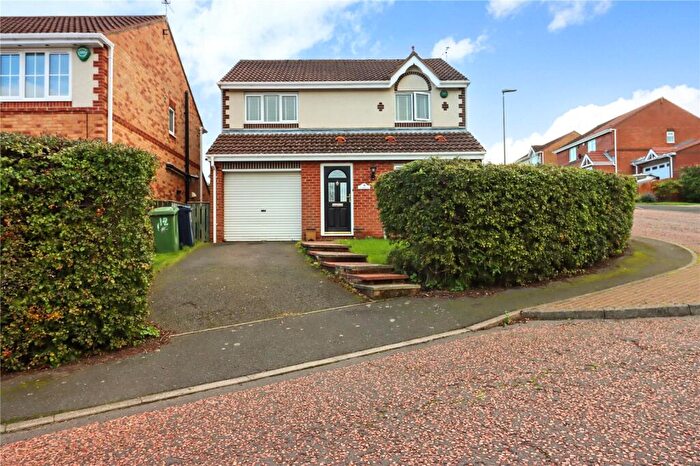
Properties in Chopwell And Rowlands Gill have an average house price of £204,914.00 and had 169 Property Transactions within the last 3 years¹.
Chopwell And Rowlands Gill is an area in Rowlands Gill, Gateshead with 2,433 households², where the most expensive property was sold for £758,000.00.
Properties for sale in Chopwell And Rowlands Gill
Roads and Postcodes in Chopwell And Rowlands Gill
Navigate through our locations to find the location of your next house in Chopwell And Rowlands Gill, Rowlands Gill for sale or to rent.
| Streets | Postcodes |
|---|---|
| A J Cooks Cottages | NE39 2DA |
| Albert Street | NE39 2JA |
| Alexandra Street | NE39 2JB |
| Alloy Terrace | NE39 2ND |
| Ashtree Close | NE39 1RA |
| Avon Close | NE39 1AE |
| Barkwood Road | NE39 2LD NE39 2LE NE39 2LF |
| Bowes Lyon Close | NE39 1EW |
| Briar Road | NE39 2JS |
| Brockwell Drive | NE39 2PX |
| Burnopfield Road | NE39 1QQ NE39 1QG NE39 1QH |
| Burnside Road | NE39 2JZ NE39 2LB |
| Carnforth Gardens | NE39 2PQ |
| Chapel View | NE39 2PN |
| Cowell Grove | NE39 2JQ |
| Cowen Terrace | NE39 2PB |
| Cross Terrace | NE39 1DP |
| Dene Avenue | NE39 1DR NE39 1DX NE39 1DY NE39 1DZ |
| Dene Crescent | NE39 1DS |
| Dene Road | NE39 1DU |
| Dene View | NE39 2LH |
| Derwent Avenue | NE39 1BZ |
| Derwent Valley Cottages | NE39 1PT |
| Dipwood Road | NE39 1BX NE39 1BY NE39 1DA NE39 1DB NE39 1DD |
| Dipwood Way | NE39 1DH |
| Dominies Close | NE39 1PA NE39 1PB NE39 2PP |
| East View | NE39 2LQ |
| Elgin Villas | NE39 1EE |
| Engel Street | NE39 2DE |
| Friarside Crescent | NE39 1DQ |
| Garesfield Gardens | NE39 2PG |
| Gibside Chase | NE39 1BN |
| Gill Burn | NE39 2PT |
| Glen Close | NE39 1QX |
| Glencoe Rise | NE39 2NL |
| Glencoe Terrace | NE39 2NA |
| Highfield Road | NE39 2LZ |
| Hillcroft | NE39 2DL |
| Hillside Close | NE39 2PW |
| Hollinside Terrace | NE39 2JW |
| Hollydene | NE39 1LQ |
| Holmewood Drive | NE39 1EL |
| Hookergate Lane | NE39 2AF |
| Keir Hardie Street | NE39 2DF |
| Kells Way | NE39 1LD |
| Leazes View | NE39 2JN NE39 2JR NE39 2JT NE39 2JU |
| Lilley Croft | NE39 2PF |
| Lilley Terrace | NE39 2PD |
| Lintzford Close | NE39 1GG |
| Lintzford Gardens | NE39 1DJ |
| Lintzford Grange | NE39 1HL |
| Lintzford Road | NE39 1DE NE39 1DF NE39 1DG |
| Lockhaugh Road | NE39 2PR NE39 1QN |
| Low West Avenue | NE39 1EA |
| Margaret Terrace | NE39 2NG |
| Middleton Avenue | NE39 1JU |
| Nell Terrace | NE39 2NQ |
| Norman Road | NE39 1JS NE39 1JT |
| North View East | NE39 2NH |
| North View West | NE39 2DQ |
| Norwood Crescent | NE39 2PA |
| Olga Terrace | NE39 2NE |
| Orchard Avenue | NE39 1EF |
| Orchard Close | NE39 1EQ |
| Orchard Dene | NE39 1DW |
| Orchard Road | NE39 1DL NE39 1DN NE39 1ED |
| Orchard Terrace | NE39 1EG |
| Park Road | NE39 2JJ |
| Ponthaugh | NE39 1AB NE39 1AD NE39 1AF |
| Pontop View | NE39 2JP |
| Red Kite Way | NE39 2NJ |
| Redstart Court | NE39 1JR |
| Riverside Way | NE39 1EJ |
| Rookswood Gardens | NE39 2PH |
| Rowland Burn Way | NE39 2PU |
| School Houses | NE39 1LU |
| Sherburn Green | NE39 1QS |
| Sherburn Park Drive | NE39 1QP NE39 1QR NE39 1QU NE39 1QW NE39 1QY NE39 1QZ |
| Smailes Lane | NE39 1JE NE39 1JF NE39 1JG NE39 1JQ NE39 2LS NE39 1PG NE39 2DB NE39 2LR |
| Snipes Dene | NE39 2PJ |
| South Sherburn | NE39 1JX NE39 1JY NE39 1JZ NE39 1LA NE39 1LB NE39 1LE |
| South View East | NE39 2DJ |
| South View West | NE39 2DH |
| Southwood Crescent | NE39 2PE |
| Springfield Cottages | NE39 2LY |
| Station Cottages | NE39 1QE |
| Station Road | NE39 1JH NE39 1JJ NE39 1JP NE39 1PY NE39 1QD NE39 1PZ NE39 1QF NE39 1QJ |
| Stewartsfield | NE39 1PE NE39 1PF |
| Stirling Avenue | NE39 1PU |
| Stirling Lane | NE39 1PP NE39 1PR NE39 1PS |
| Strathmore Avenue | NE39 1HY |
| Strathmore Road | NE39 1HX NE39 1HZ NE39 1JA NE39 1JB NE39 1JD |
| Taylor Avenue | NE39 1QA |
| The Avenue | NE39 1QB |
| The Crescent | NE39 1JL NE39 1JN NE39 1JW |
| The Green | NE39 2LL |
| The Grove | NE39 1PN NE39 1PW |
| Thornfield Place | NE39 2PL |
| Thornley View | NE39 1QL |
| Tindale Terrace | NE39 2NN |
| Towneley Fields | NE39 1RB |
| Townley Road | NE39 2JX |
| Valley View | NE39 2JH |
| Victoria Terrace | NE39 2NB |
| Wellfield Road | NE39 2NF |
| West Avenue | NE39 1EB |
| Whinfield Cottages | NE39 1PQ |
| Whinfield Industrial Estate | NE39 1EH NE39 1EN |
| Whinfield Terrace | NE39 2JG NE39 2JL NE39 2JY NE39 2LG |
| Whinfield Way | NE39 2JE |
| William Morris Avenue | NE39 2DD |
| Windsor Court | NE39 1BF |
| Wingrove | NE39 1DT |
| Woodlands Road | NE39 2LA |
| Woodlea Road | NE39 2DG |
| NE39 1LT NE39 1LZ NE39 2AG NE39 1AG NE39 1BP NE39 1LF NE39 1LG NE39 1LX NE39 1LY NE39 2AA NE39 2JD |
Transport near Chopwell And Rowlands Gill
- FAQ
- Price Paid By Year
- Property Type Price
Frequently asked questions about Chopwell And Rowlands Gill
What is the average price for a property for sale in Chopwell And Rowlands Gill?
The average price for a property for sale in Chopwell And Rowlands Gill is £204,914. This amount is 2% higher than the average price in Rowlands Gill. There are 578 property listings for sale in Chopwell And Rowlands Gill.
What streets have the most expensive properties for sale in Chopwell And Rowlands Gill?
The streets with the most expensive properties for sale in Chopwell And Rowlands Gill are Rowland Burn Way at an average of £610,000, Brockwell Drive at an average of £548,750 and Gill Burn at an average of £515,000.
What streets have the most affordable properties for sale in Chopwell And Rowlands Gill?
The streets with the most affordable properties for sale in Chopwell And Rowlands Gill are South View East at an average of £78,000, Park Road at an average of £80,000 and Margaret Terrace at an average of £84,505.
Which train stations are available in or near Chopwell And Rowlands Gill?
Some of the train stations available in or near Chopwell And Rowlands Gill are Blaydon, MetroCentre and Wylam.
Property Price Paid in Chopwell And Rowlands Gill by Year
The average sold property price by year was:
| Year | Average Sold Price | Price Change |
Sold Properties
|
|---|---|---|---|
| 2025 | £205,358 | -1% |
42 Properties |
| 2024 | £207,326 | 3% |
72 Properties |
| 2023 | £201,417 | 1% |
55 Properties |
| 2022 | £199,277 | -0,4% |
75 Properties |
| 2021 | £200,013 | 10% |
112 Properties |
| 2020 | £180,148 | -2% |
59 Properties |
| 2019 | £183,169 | 5% |
79 Properties |
| 2018 | £174,800 | -8% |
75 Properties |
| 2017 | £188,952 | 14% |
76 Properties |
| 2016 | £162,893 | -16% |
79 Properties |
| 2015 | £188,665 | 8% |
57 Properties |
| 2014 | £173,686 | 11% |
58 Properties |
| 2013 | £154,420 | -3% |
60 Properties |
| 2012 | £159,011 | 6% |
41 Properties |
| 2011 | £149,558 | 11% |
64 Properties |
| 2010 | £132,361 | -33% |
42 Properties |
| 2009 | £176,064 | 6% |
46 Properties |
| 2008 | £165,718 | 11% |
56 Properties |
| 2007 | £147,636 | -15% |
90 Properties |
| 2006 | £170,452 | 12% |
78 Properties |
| 2005 | £150,193 | -4% |
82 Properties |
| 2004 | £156,758 | 15% |
92 Properties |
| 2003 | £132,474 | 24% |
120 Properties |
| 2002 | £100,390 | 6% |
103 Properties |
| 2001 | £94,465 | 2% |
120 Properties |
| 2000 | £92,794 | 26% |
118 Properties |
| 1999 | £68,966 | 9% |
131 Properties |
| 1998 | £62,834 | 9% |
109 Properties |
| 1997 | £57,093 | -7% |
76 Properties |
| 1996 | £61,235 | 10% |
78 Properties |
| 1995 | £55,288 | - |
64 Properties |
Property Price per Property Type in Chopwell And Rowlands Gill
Here you can find historic sold price data in order to help with your property search.
The average Property Paid Price for specific property types in the last three years are:
| Property Type | Average Sold Price | Sold Properties |
|---|---|---|
| Flat | £133,000.00 | 6 Flats |
| Semi Detached House | £191,366.00 | 68 Semi Detached Houses |
| Detached House | £414,733.00 | 33 Detached Houses |
| Terraced House | £115,053.00 | 62 Terraced Houses |

