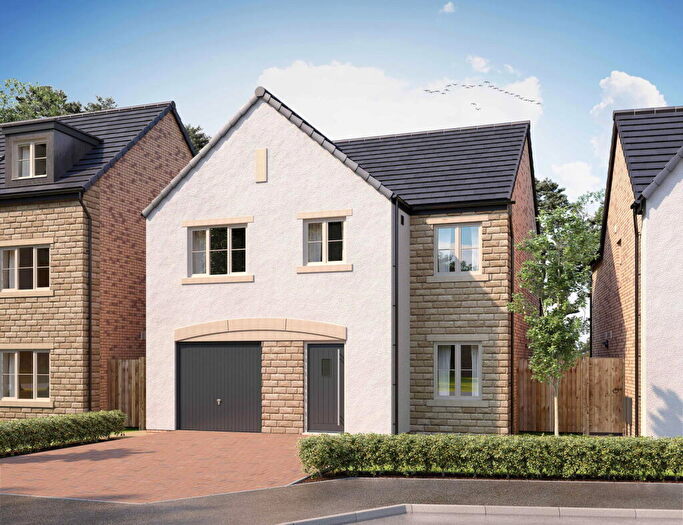
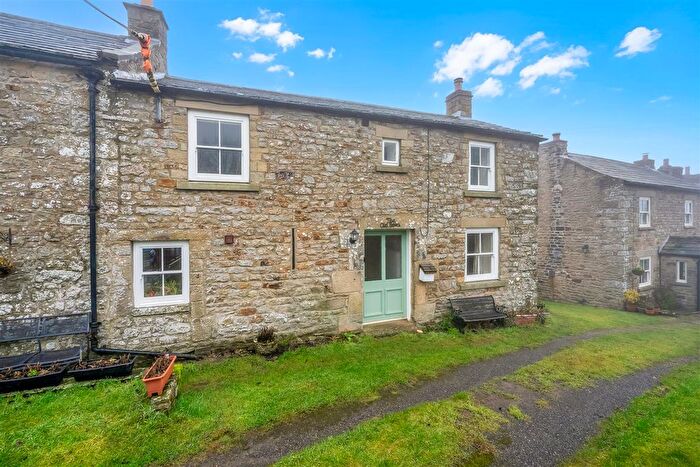
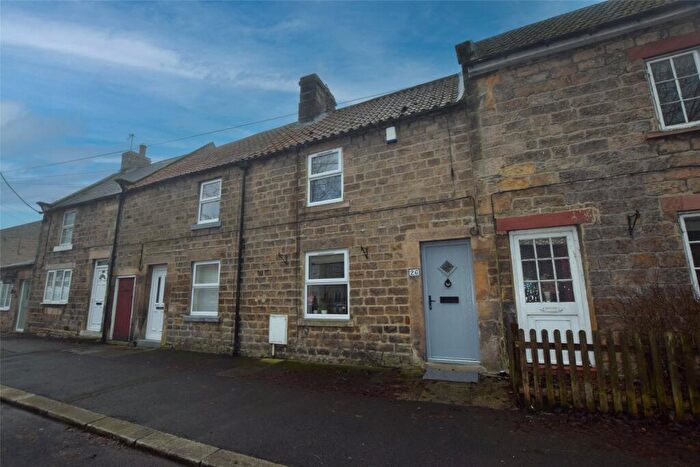
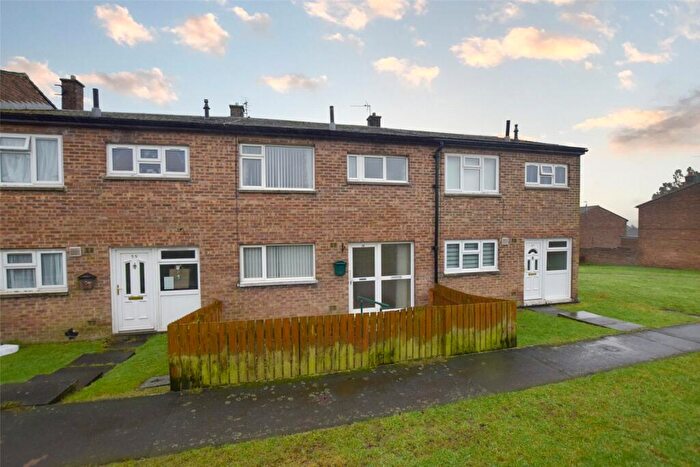
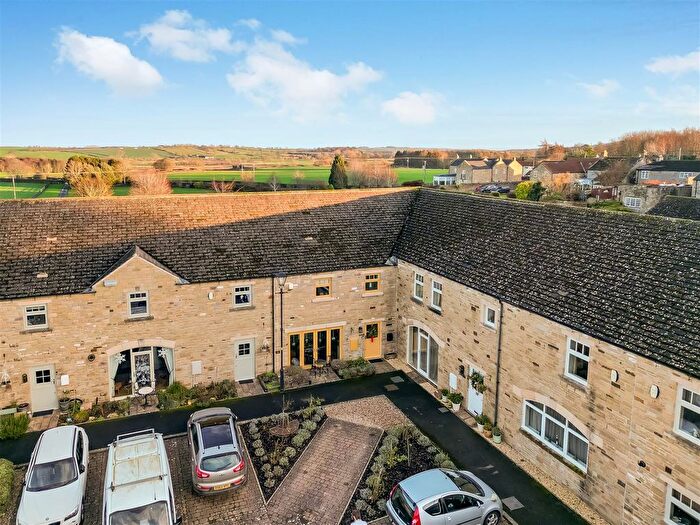
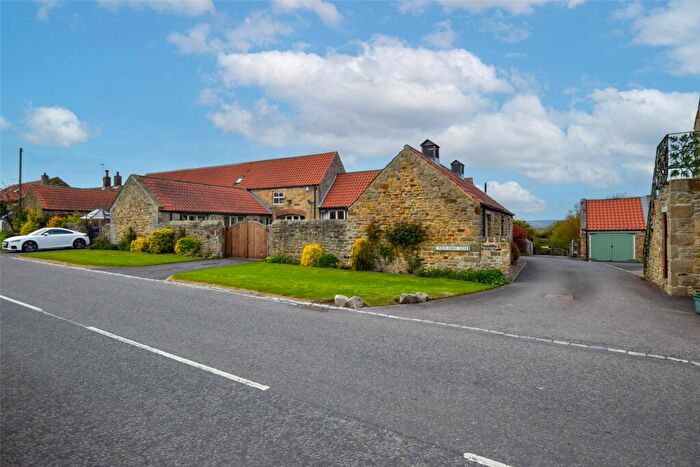
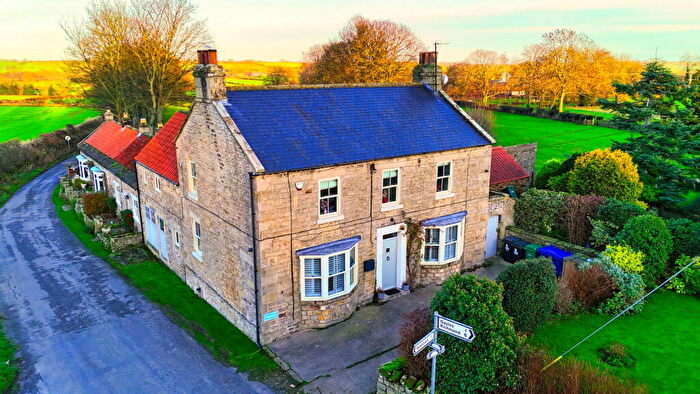
Houses for sale & to rent in Barnard Castle East, Richmond
House Prices in Barnard Castle East
Properties in Barnard Castle East have an average house price of £353,375.00 and had 8 Property Transactions within the last 3 years¹.
Barnard Castle East is an area in Richmond, County Durham with 214 households², where the most expensive property was sold for £552,000.00.
Properties for sale in Barnard Castle East
Roads and Postcodes in Barnard Castle East
Navigate through our locations to find the location of your next house in Barnard Castle East, Richmond for sale or to rent.
| Streets | Postcodes |
|---|---|
| Church View | DL11 7DP |
| Cliffords View | DL11 7DB |
| Glen View | DL11 7BN |
| Heath Cottages | DL11 7DT |
| Lanehead | DL11 7HF |
| Park View | DL11 7DR DL11 7DS |
| DL11 7BL DL11 7BP DL11 7BW DL11 7DA DL11 7DE DL11 7DU DL11 7DW DL11 7DZ DL11 7EB DL11 7HH DL11 7HN DL11 7HQ DL11 7UD DL11 7UG DL11 7DD DL11 7DF DL11 7DX DL11 7DY DL11 7EA DL11 7HG DL11 7HJ DL11 7HL DL11 7UE DL11 7UF DL11 7UL DL11 7UN |
Transport near Barnard Castle East
-
North Road Station
-
Shildon Station
-
Darlington Station
-
Heighington Station
-
Bishop Auckland Station
-
Newton Aycliffe Station
-
Dinsdale Station
- FAQ
- Price Paid By Year
- Property Type Price
Frequently asked questions about Barnard Castle East
What is the average price for a property for sale in Barnard Castle East?
The average price for a property for sale in Barnard Castle East is £353,375. There are 675 property listings for sale in Barnard Castle East.
Which train stations are available in or near Barnard Castle East?
Some of the train stations available in or near Barnard Castle East are North Road, Shildon and Darlington.
Property Price Paid in Barnard Castle East by Year
The average sold property price by year was:
| Year | Average Sold Price | Price Change |
Sold Properties
|
|---|---|---|---|
| 2025 | £442,500 | 3% |
2 Properties |
| 2024 | £429,000 | 49% |
3 Properties |
| 2023 | £218,333 | -136% |
3 Properties |
| 2022 | £515,791 | 38% |
6 Properties |
| 2021 | £320,000 | 15% |
8 Properties |
| 2020 | £271,249 | -29% |
8 Properties |
| 2019 | £350,200 | -18% |
5 Properties |
| 2018 | £411,600 | 24% |
5 Properties |
| 2017 | £312,954 | -30% |
11 Properties |
| 2016 | £408,285 | 36% |
7 Properties |
| 2015 | £262,833 | 3% |
6 Properties |
| 2014 | £254,500 | 14% |
5 Properties |
| 2013 | £220,000 | -4% |
2 Properties |
| 2012 | £228,333 | -81% |
3 Properties |
| 2011 | £412,571 | 38% |
7 Properties |
| 2010 | £256,250 | -31% |
4 Properties |
| 2009 | £335,000 | 15% |
1 Property |
| 2008 | £285,000 | -66% |
2 Properties |
| 2007 | £471,995 | 42% |
12 Properties |
| 2006 | £273,772 | 21% |
11 Properties |
| 2005 | £215,214 | -22% |
7 Properties |
| 2004 | £262,500 | 26% |
8 Properties |
| 2003 | £194,450 | 30% |
10 Properties |
| 2002 | £135,264 | 8% |
14 Properties |
| 2001 | £124,399 | 14% |
5 Properties |
| 2000 | £106,994 | 19% |
9 Properties |
| 1999 | £86,310 | 1% |
7 Properties |
| 1998 | £85,250 | 9% |
10 Properties |
| 1997 | £77,756 | 11% |
8 Properties |
| 1996 | £69,445 | 14% |
10 Properties |
| 1995 | £59,616 | - |
3 Properties |
Property Price per Property Type in Barnard Castle East
Here you can find historic sold price data in order to help with your property search.
The average Property Paid Price for specific property types in the last three years are:
| Property Type | Average Sold Price | Sold Properties |
|---|---|---|
| Semi Detached House | £361,400.00 | 5 Semi Detached Houses |
| Detached House | £340,000.00 | 3 Detached Houses |

