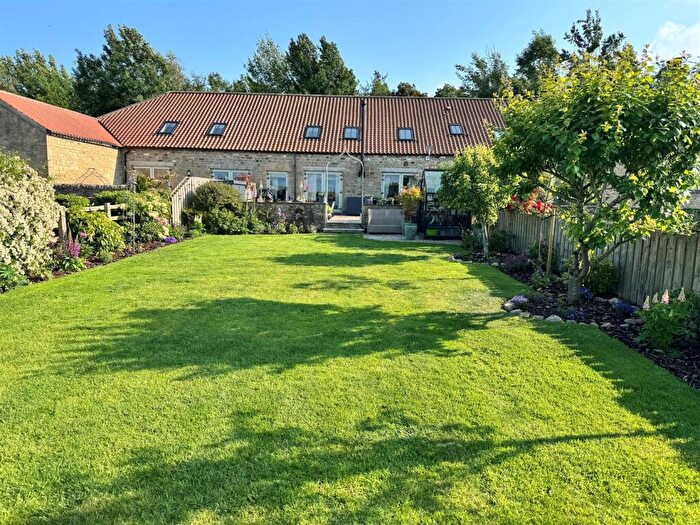
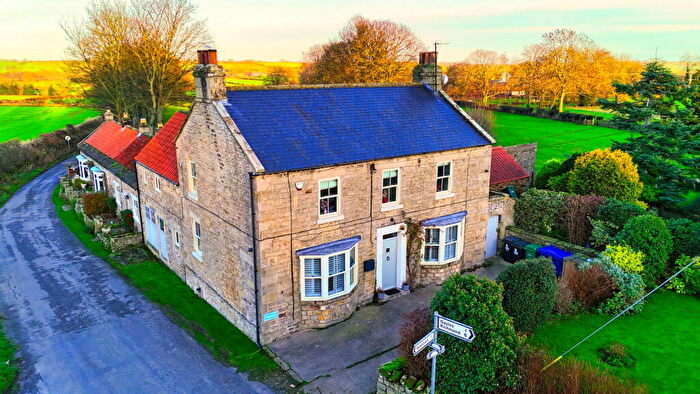
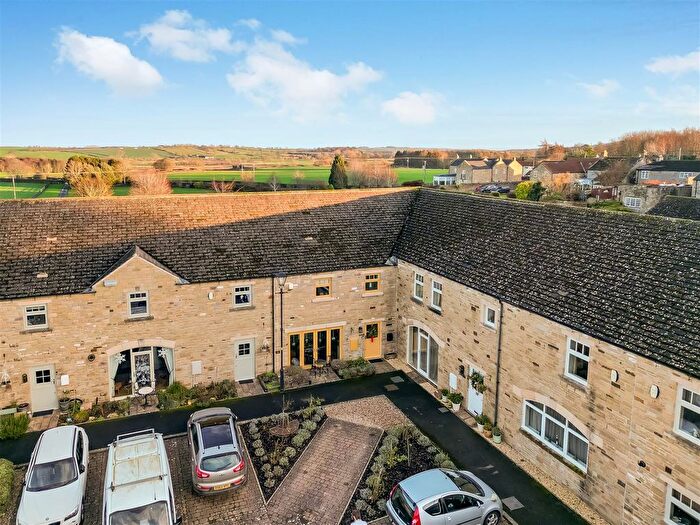
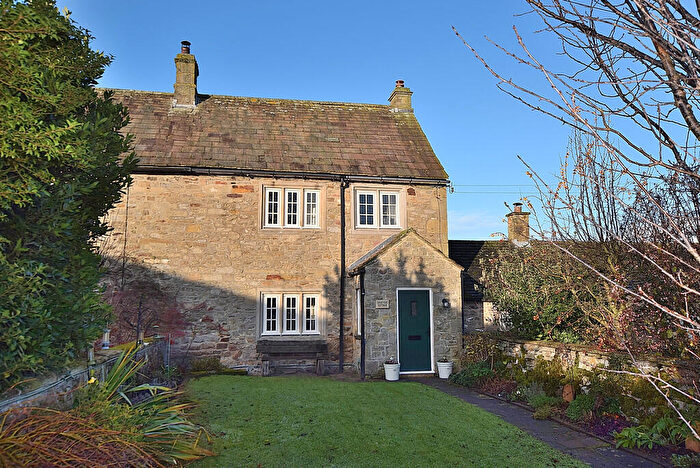
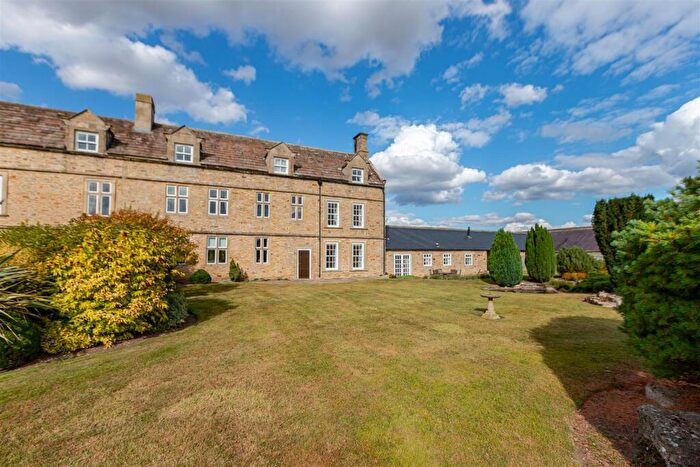
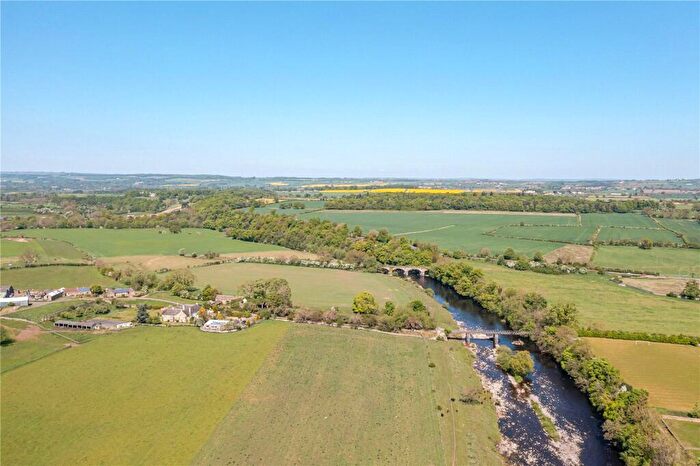
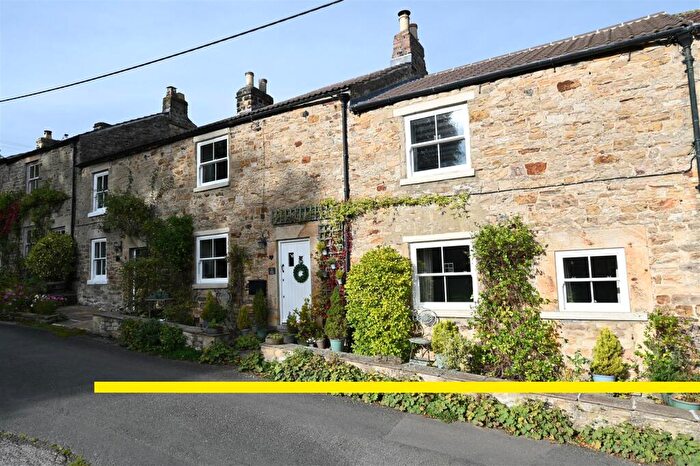
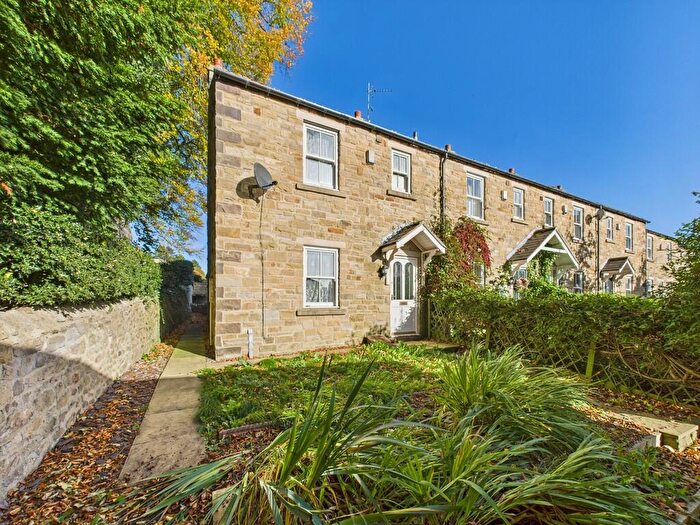
Houses for sale & to rent in Newsham With Eppleby, Richmond
House Prices in Newsham With Eppleby
Properties in Newsham With Eppleby have an average house price of £414,838.00 and had 38 Property Transactions within the last 3 years¹.
Newsham With Eppleby is an area in Richmond, North Yorkshire with 455 households², where the most expensive property was sold for £1,500,000.00.
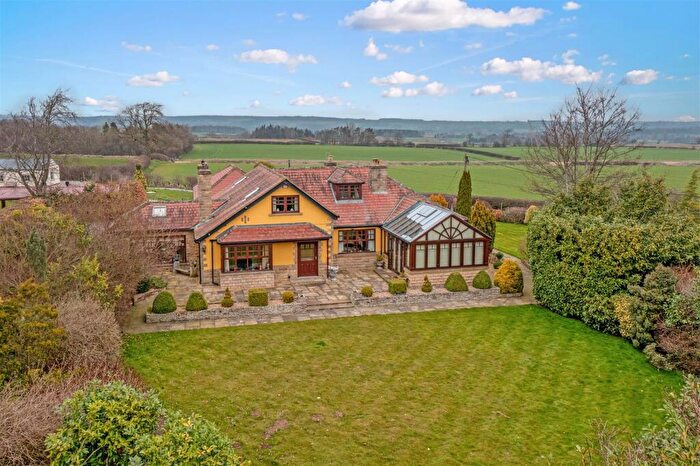
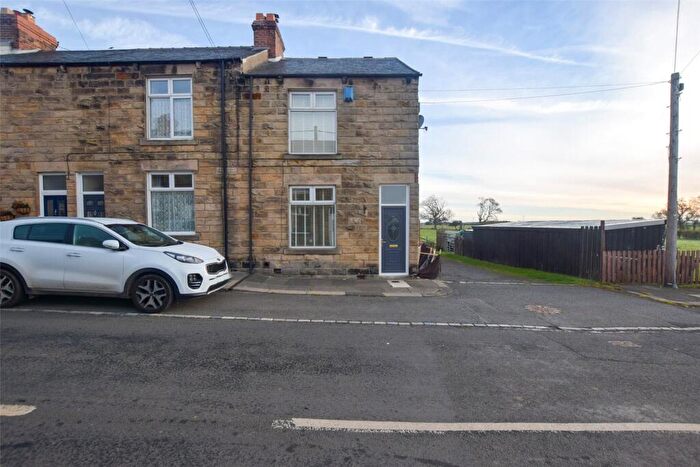
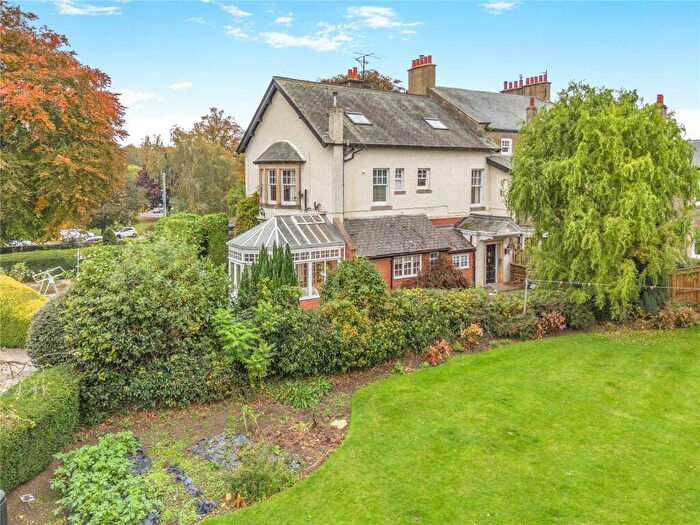
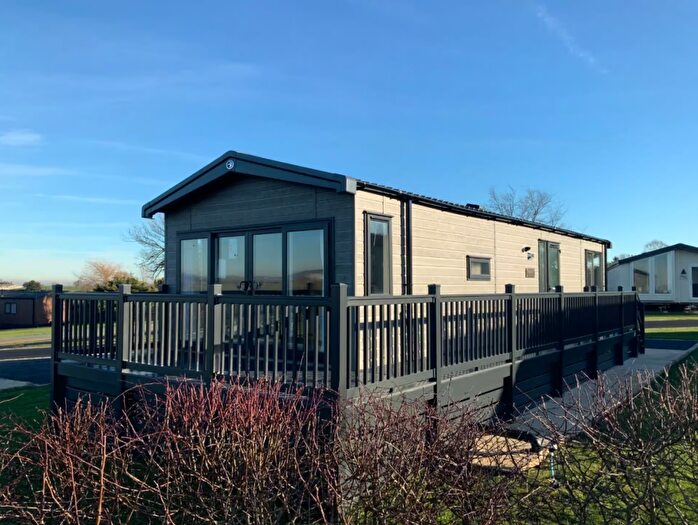
Properties for sale in Newsham With Eppleby
Roads and Postcodes in Newsham With Eppleby
Navigate through our locations to find the location of your next house in Newsham With Eppleby, Richmond for sale or to rent.
| Streets | Postcodes |
|---|---|
| Barningham Road | DL11 7QT |
| Carkin Grange | DL10 5PX |
| Chapel Row | DL11 7AU |
| Coronation Cottages | DL11 7AS |
| Dalton Fields | DL11 7RF |
| Dalton Heights | DL11 7LA |
| Dyson Lane | DL11 7BF |
| East View | DL11 7QG |
| Eppleby Road | DL11 7PZ |
| Flax Mill Close | DL11 7RL |
| Forcett Close | DL11 7RH |
| Hallgarth Court | DL11 7RN |
| High Row | DL11 7QQ |
| Jubilee Cottages | DL11 7BA |
| Low Green | DL11 7BB |
| Manor Farm Cottages | DL11 7PT |
| Mill View | DL11 7BJ |
| New Row | DL11 7AW |
| Reading Room Row | DL11 7RX |
| Rose Cottages | DL11 7QB |
| School Lane | DL11 7DQ |
| The Curtain | DL11 7AX |
| The Ford | DL11 7PG |
| Victoria Row | DL11 7BE |
| Westgarth | DL11 7DH |
| DL11 7AG DL11 7AJ DL11 7AP DL11 7AR DL11 7AY DL11 7AZ DL11 7BH DL11 7DN DL11 7ED DL11 7GU DL11 7HS DL11 7HU DL11 7HX DL11 7HY DL11 7JX DL11 7PE DL11 7PP DL11 7PQ DL11 7PS DL11 7QA DL11 7QD DL11 7QE DL11 7QF DL11 7QH DL11 7QJ DL11 7QU DL11 7QW DL11 7QX DL11 7QZ DL11 7RA DL11 7RD DL11 7RJ DL11 7RS DL11 7RT DL11 7RU DL11 7RY DL11 7RZ DL11 7UQ |
Transport near Newsham With Eppleby
-
North Road Station
-
Darlington Station
-
Heighington Station
-
Shildon Station
-
Newton Aycliffe Station
-
Bishop Auckland Station
-
Dinsdale Station
-
Teesside Airport Station
- FAQ
- Price Paid By Year
- Property Type Price
Frequently asked questions about Newsham With Eppleby
What is the average price for a property for sale in Newsham With Eppleby?
The average price for a property for sale in Newsham With Eppleby is £414,838. This amount is 36% higher than the average price in Richmond. There are 183 property listings for sale in Newsham With Eppleby.
What streets have the most expensive properties for sale in Newsham With Eppleby?
The streets with the most expensive properties for sale in Newsham With Eppleby are High Row at an average of £457,500, Hallgarth Court at an average of £409,166 and Forcett Close at an average of £385,000.
What streets have the most affordable properties for sale in Newsham With Eppleby?
The streets with the most affordable properties for sale in Newsham With Eppleby are Low Green at an average of £118,000, Chapel Row at an average of £186,000 and The Curtain at an average of £292,500.
Which train stations are available in or near Newsham With Eppleby?
Some of the train stations available in or near Newsham With Eppleby are North Road, Darlington and Heighington.
Property Price Paid in Newsham With Eppleby by Year
The average sold property price by year was:
| Year | Average Sold Price | Price Change |
Sold Properties
|
|---|---|---|---|
| 2025 | £454,150 | 5% |
13 Properties |
| 2024 | £431,177 | 15% |
11 Properties |
| 2023 | £365,496 | -27% |
14 Properties |
| 2022 | £465,615 | 31% |
13 Properties |
| 2021 | £321,500 | -18% |
29 Properties |
| 2020 | £378,630 | 2% |
15 Properties |
| 2019 | £370,818 | 31% |
19 Properties |
| 2018 | £254,062 | -22% |
16 Properties |
| 2017 | £309,845 | -1% |
20 Properties |
| 2016 | £312,950 | 16% |
20 Properties |
| 2015 | £262,870 | -12% |
14 Properties |
| 2014 | £293,375 | 6% |
27 Properties |
| 2013 | £275,938 | 18% |
9 Properties |
| 2012 | £227,555 | -43% |
9 Properties |
| 2011 | £326,192 | -26% |
13 Properties |
| 2010 | £411,499 | 16% |
17 Properties |
| 2009 | £346,015 | 21% |
16 Properties |
| 2008 | £272,250 | -20% |
10 Properties |
| 2007 | £327,447 | -21% |
18 Properties |
| 2006 | £395,588 | 33% |
19 Properties |
| 2005 | £266,379 | 12% |
29 Properties |
| 2004 | £235,070 | 11% |
27 Properties |
| 2003 | £210,363 | 24% |
22 Properties |
| 2002 | £158,959 | 6% |
26 Properties |
| 2001 | £149,906 | 27% |
16 Properties |
| 2000 | £109,221 | -36% |
19 Properties |
| 1999 | £148,052 | 43% |
21 Properties |
| 1998 | £84,908 | -23% |
23 Properties |
| 1997 | £104,056 | 14% |
22 Properties |
| 1996 | £89,202 | 4% |
18 Properties |
| 1995 | £85,500 | - |
14 Properties |
Property Price per Property Type in Newsham With Eppleby
Here you can find historic sold price data in order to help with your property search.
The average Property Paid Price for specific property types in the last three years are:
| Property Type | Average Sold Price | Sold Properties |
|---|---|---|
| Semi Detached House | £485,995.00 | 10 Semi Detached Houses |
| Detached House | £473,912.00 | 12 Detached Houses |
| Terraced House | £326,060.00 | 16 Terraced Houses |

