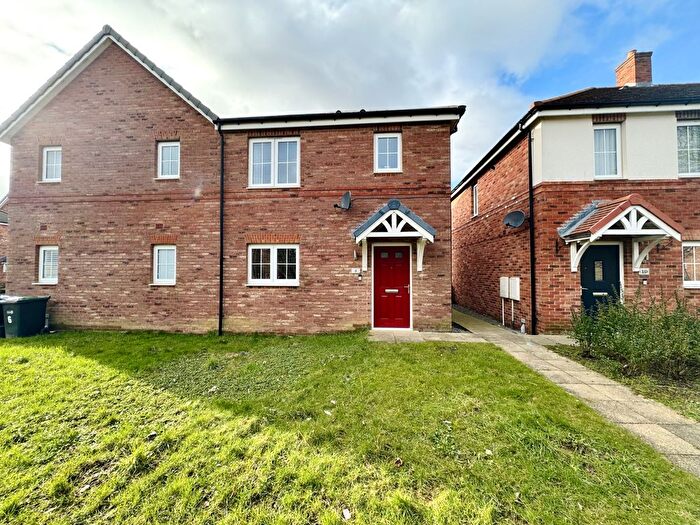
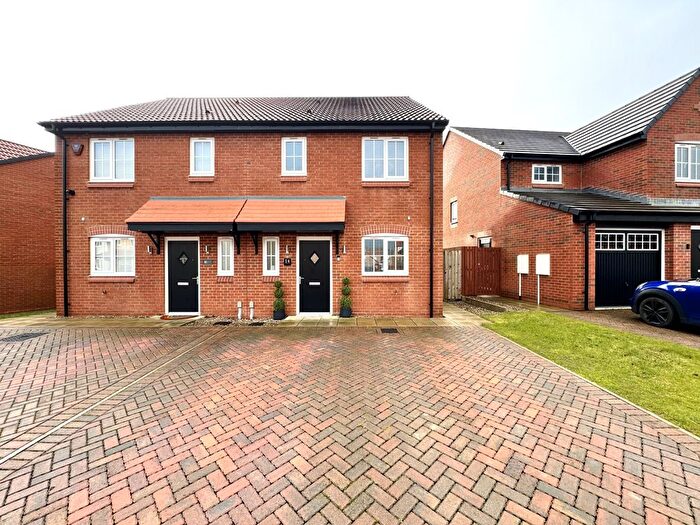
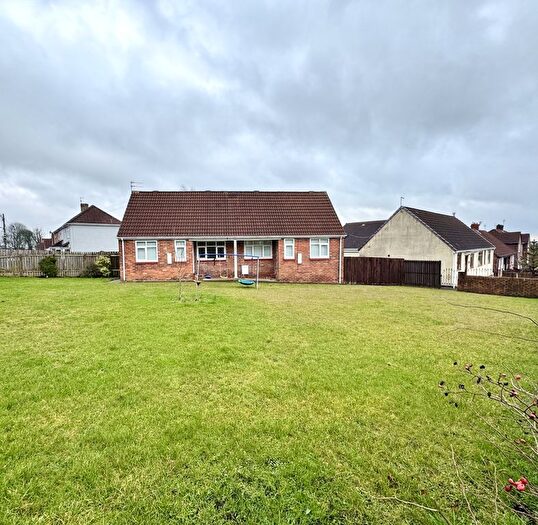
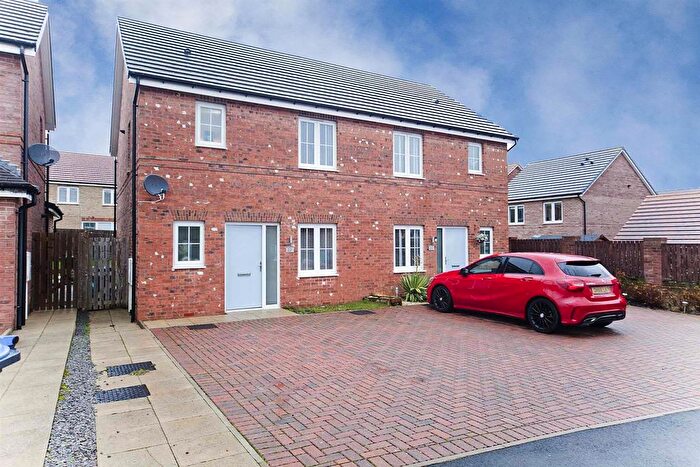
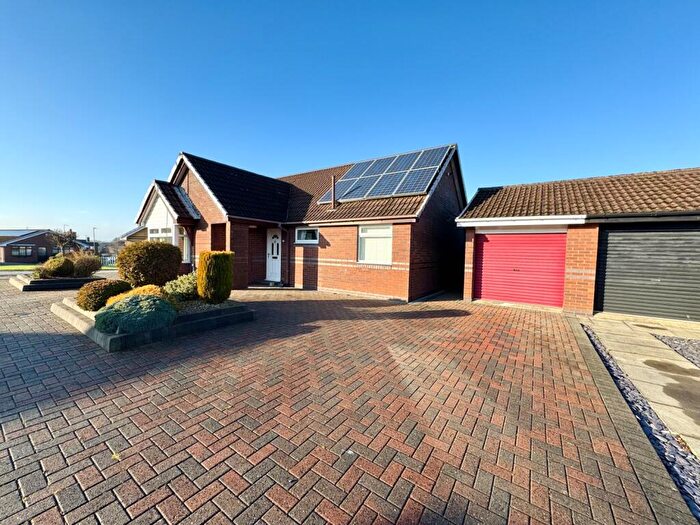
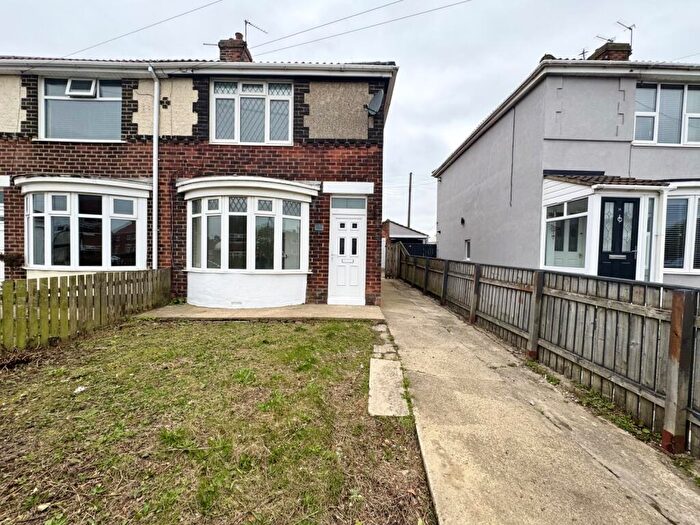
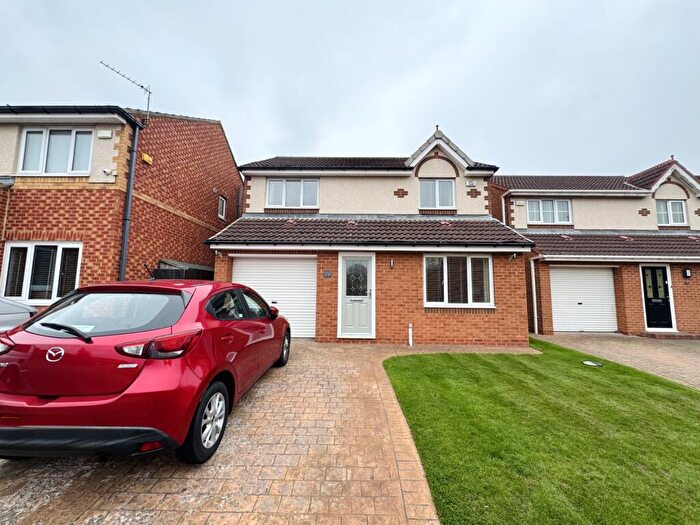
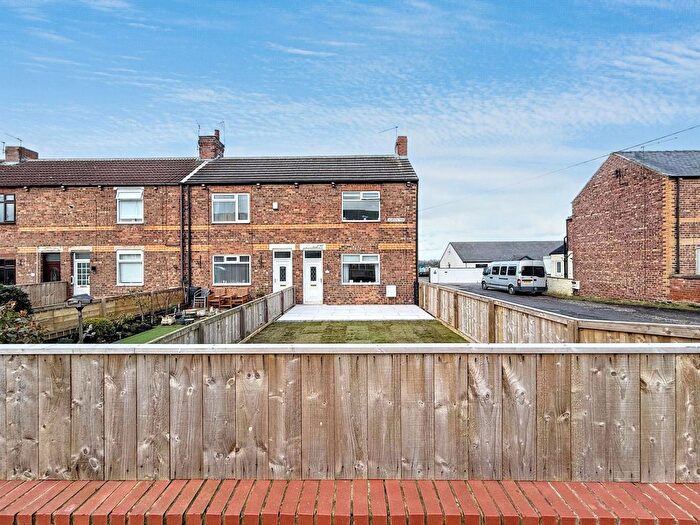
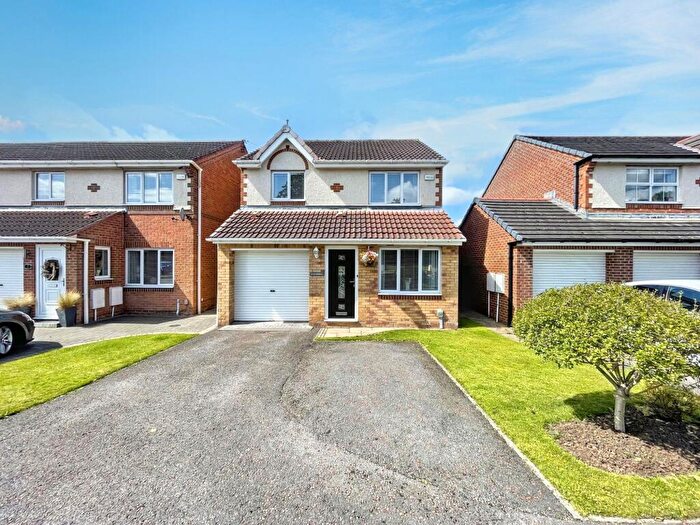
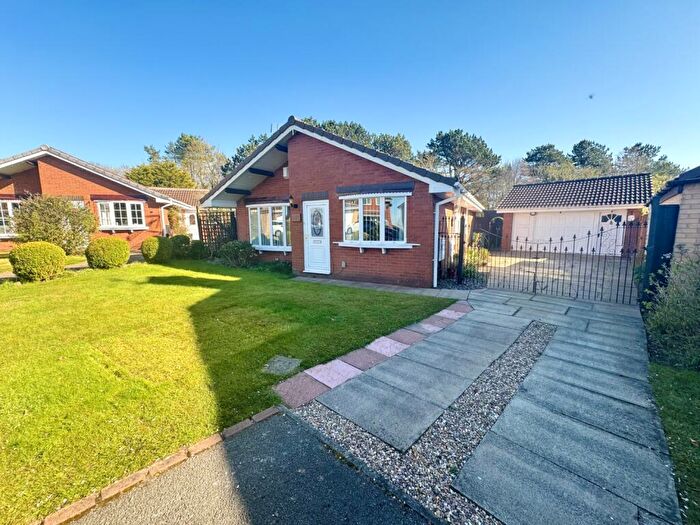
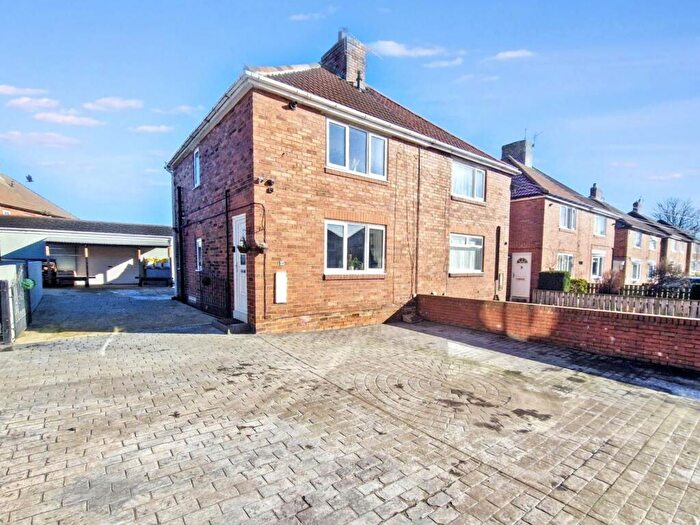
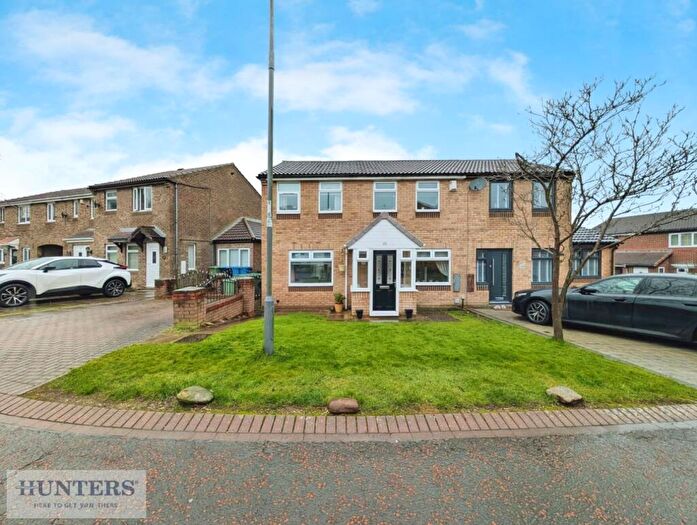
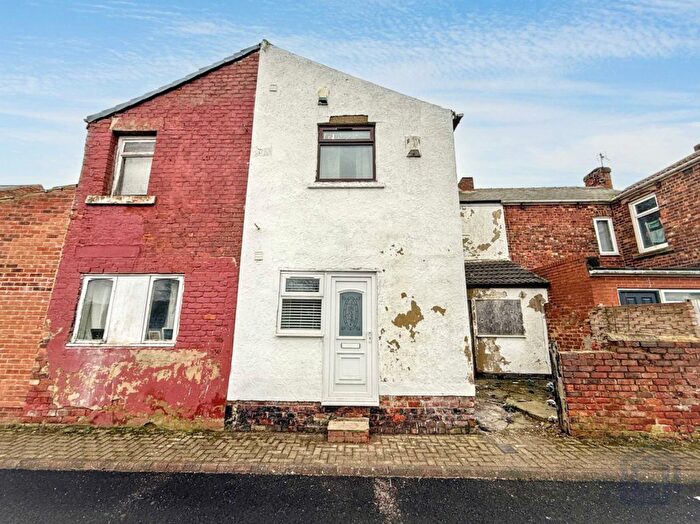
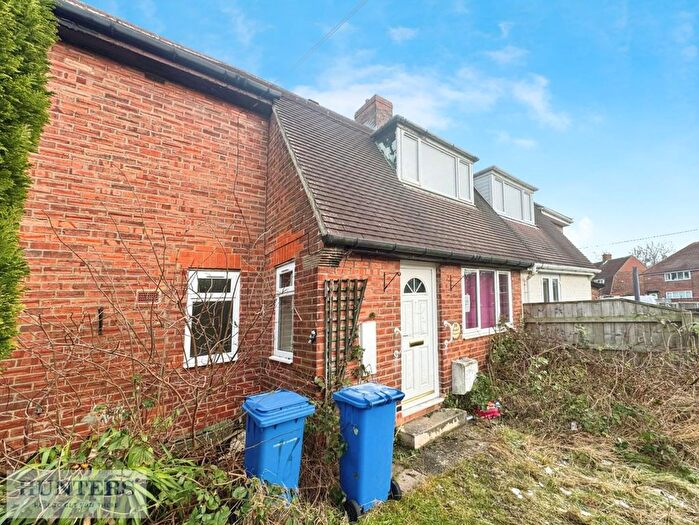
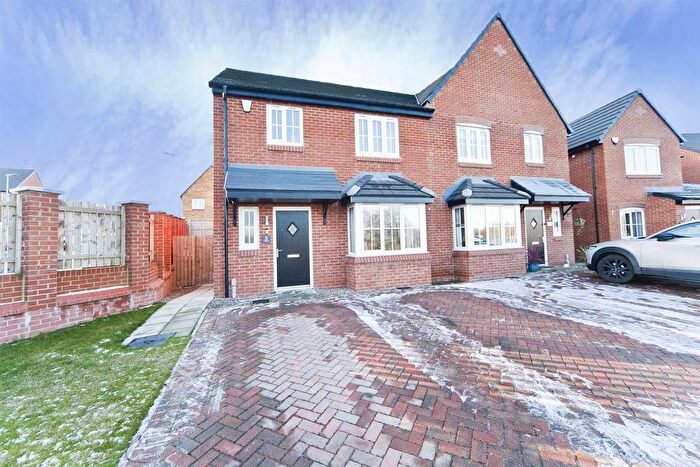
Houses for sale & to rent in Wingate, Wingate
House Prices in Wingate
Properties in Wingate have an average house price of £128,262.00 and had 180 Property Transactions within the last 3 years¹.
Wingate is an area in Wingate, County Durham with 1,769 households², where the most expensive property was sold for £324,995.00.
Properties for sale in Wingate
Previously listed properties in Wingate
Roads and Postcodes in Wingate
Navigate through our locations to find the location of your next house in Wingate, Wingate for sale or to rent.
| Streets | Postcodes |
|---|---|
| Acer Grove | TS28 5BF |
| Armstrong Avenue | TS28 5BZ |
| Arundel Walk | TS28 5LJ |
| Bruce Crescent | TS28 5JJ |
| Burdon Crescent | TS28 5LF |
| Caradoc Road | TS28 5BT |
| Cargills Court | TS28 5FL |
| Chillerton Way | TS28 5DY TS28 5FE |
| Church Street | TS28 5AQ |
| Coronation Road | TS28 5JL TS28 5JN TS28 5JW |
| Cummings Square | TS28 5JF |
| Dawson Road | TS28 5BS |
| Dobson Terrace | TS28 5JA |
| Dodds Terrace | TS28 5HU |
| Durham Road | TS28 5HP TS28 5HS |
| Edderacres Walk | TS28 5FH |
| Forest Gate | TS28 5LG |
| Forster Square | TS28 5JG |
| Fourways Court | TS28 5LN |
| Front Street East | TS28 5AG TS28 5QA |
| Front Street West | TS28 5AA TS28 5PZ |
| Goldsborough Court | TS28 5PR |
| Granby Terrace | TS28 5HZ |
| Gray Square | TS28 5BX |
| Greenhills Estate | TS28 5LD |
| Gulley Road | TS28 5BU |
| Hadrian Court | TS28 5FB |
| Haswell Road | TS28 5LE |
| High Grange Way | TS28 5FF TS28 5FG |
| Howden Gardens | TS28 5BY |
| Ingram Way | TS28 5PW |
| Kenny Square | TS28 5LH |
| Kings Road | TS28 5JP TS28 5JR TS28 5JS |
| Laing Square | TS28 5JE |
| Market Crescent | TS28 5AJ |
| Martindale Walk | TS28 5PP |
| Moor Lane | TS28 5BA |
| Moore Square | TS28 5JD |
| Nattress Terrace | TS28 5BQ |
| New Back Row | TS28 5AS |
| New Cross Row | TS28 5BB |
| New Row | TS28 5AR |
| North Road East | TS28 5AT TS28 5AU TS28 5AY TS28 5AX TS28 5BW |
| North Road West | TS28 5AP |
| Parsonage Close | TS28 5FQ |
| Partridge Terrace | TS28 5BD |
| Pickering Wynd | TS28 5FJ |
| Plantation Close | TS28 5FS |
| Queens Road | TS28 5JH |
| Quinn Crescent | TS28 5BG |
| Roxby Wynd | TS28 5PN |
| Salters Lane | TS28 5BE TS28 5BN TS28 5JB TS28 5HX |
| Sandford Close | TS28 5FD |
| Snaith Terrace | TS28 5BL |
| South View | TS28 5BJ |
| Stewart Drive | TS28 5PS |
| Taylor Grove | TS28 5PA |
| The Cloisters | TS28 5PT |
| The Firs | TS28 5GZ |
| The Maltings | TS28 5PH |
| The Rowlands | TS28 5AD |
| The Village Green | TS28 5GY |
| Vicarage Estate | TS28 5BP |
| Walton Terrace | TS28 5HT |
| Wellfield Road North | TS28 5JZ TS28 5LA |
| Wellfield Road South | TS28 5JX |
| Whingrove Close | TS28 5LL |
| Williamson Square | TS28 5JQ |
| Winford Grove | TS28 5DU |
| Wingate Grange Industrial Estate | TS28 5AH TS28 5LW |
| Winning Close | TS28 5FR |
| Woodland View | TS28 5LQ |
| Woodville Way | TS28 5FP |
| TS28 5JU TS28 5LS TS28 5LU TS28 5LY TS28 5ND TS28 5NP TS28 5AL TS28 5AN TS28 5AW TS28 5AZ TS28 5BH TS28 5HR TS28 5JT TS28 5NN TS28 5NQ |
Transport near Wingate
- FAQ
- Price Paid By Year
- Property Type Price
Frequently asked questions about Wingate
What is the average price for a property for sale in Wingate?
The average price for a property for sale in Wingate is £128,262. This amount is 10% higher than the average price in Wingate. There are 624 property listings for sale in Wingate.
What streets have the most expensive properties for sale in Wingate?
The streets with the most expensive properties for sale in Wingate are Arundel Walk at an average of £269,975, High Grange Way at an average of £224,003 and Ingram Way at an average of £214,500.
What streets have the most affordable properties for sale in Wingate?
The streets with the most affordable properties for sale in Wingate are Williamson Square at an average of £37,750, North Road West at an average of £44,772 and New Cross Row at an average of £54,600.
Which train stations are available in or near Wingate?
Some of the train stations available in or near Wingate are Hartlepool, Seaham and Durham.
Property Price Paid in Wingate by Year
The average sold property price by year was:
| Year | Average Sold Price | Price Change |
Sold Properties
|
|---|---|---|---|
| 2025 | £151,308 | 20% |
74 Properties |
| 2024 | £121,380 | 16% |
57 Properties |
| 2023 | £101,464 | -39% |
49 Properties |
| 2022 | £141,071 | 10% |
113 Properties |
| 2021 | £127,276 | -3% |
99 Properties |
| 2020 | £131,515 | -11% |
94 Properties |
| 2019 | £145,695 | 27% |
146 Properties |
| 2018 | £105,880 | -2% |
60 Properties |
| 2017 | £107,790 | 0,3% |
51 Properties |
| 2016 | £107,495 | 15% |
61 Properties |
| 2015 | £90,880 | 6% |
56 Properties |
| 2014 | £85,733 | -2% |
59 Properties |
| 2013 | £87,383 | -13% |
49 Properties |
| 2012 | £98,822 | 23% |
27 Properties |
| 2011 | £75,733 | -49% |
27 Properties |
| 2010 | £112,610 | -0,1% |
46 Properties |
| 2009 | £112,728 | -5% |
40 Properties |
| 2008 | £118,358 | -4% |
84 Properties |
| 2007 | £122,505 | -8% |
150 Properties |
| 2006 | £132,575 | 18% |
162 Properties |
| 2005 | £108,566 | 38% |
74 Properties |
| 2004 | £66,792 | -5% |
77 Properties |
| 2003 | £70,372 | 14% |
73 Properties |
| 2002 | £60,746 | 12% |
50 Properties |
| 2001 | £53,160 | -3% |
48 Properties |
| 2000 | £54,847 | 9% |
71 Properties |
| 1999 | £49,661 | 5% |
60 Properties |
| 1998 | £47,226 | 16% |
65 Properties |
| 1997 | £39,779 | 4% |
50 Properties |
| 1996 | £38,380 | 2% |
30 Properties |
| 1995 | £37,804 | - |
27 Properties |
Property Price per Property Type in Wingate
Here you can find historic sold price data in order to help with your property search.
The average Property Paid Price for specific property types in the last three years are:
| Property Type | Average Sold Price | Sold Properties |
|---|---|---|
| Semi Detached House | £119,257.00 | 68 Semi Detached Houses |
| Detached House | £217,267.00 | 40 Detached Houses |
| Terraced House | £86,929.00 | 71 Terraced Houses |
| Flat | £115,000.00 | 1 Flat |

