
Houses for sale in Blackhalls, Wingate
House Prices in Blackhalls
Properties in Blackhalls have an average house price of £92k and had 86 Property Transactions within the last 3 years¹.
Blackhalls is an area in Wingate, County Durham with 520 households², where the most expensive property was sold for £625k.
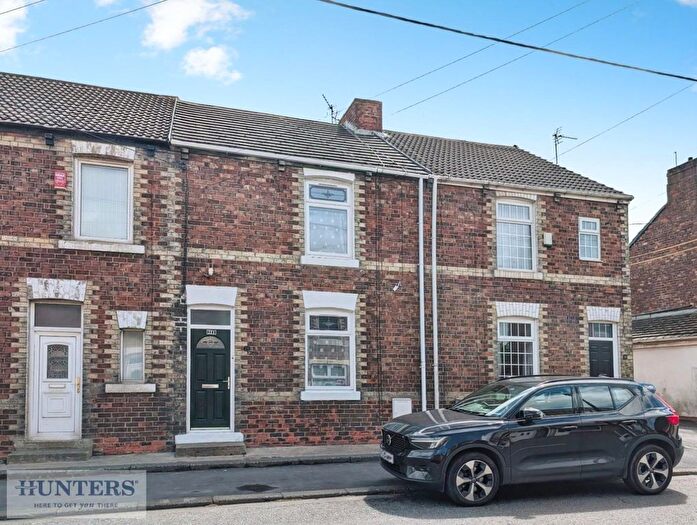
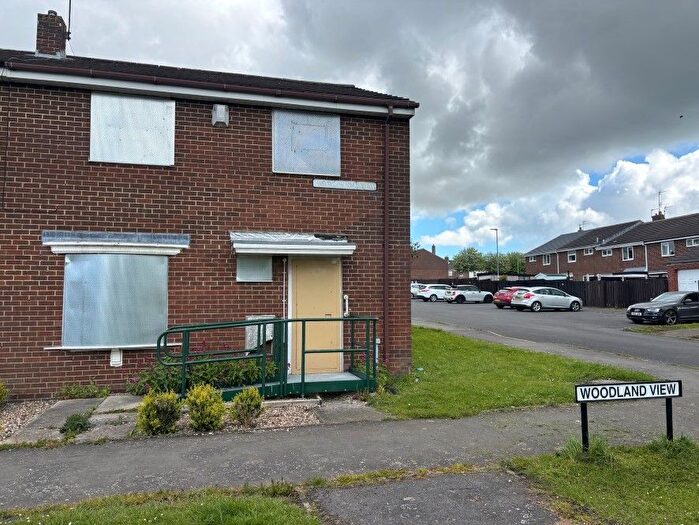
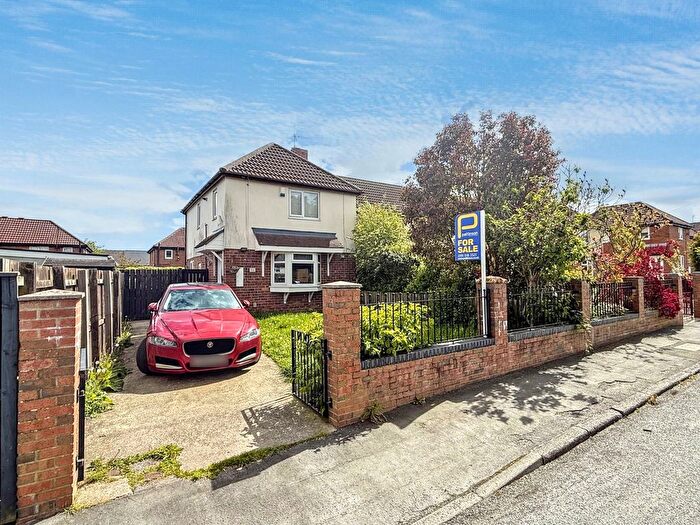
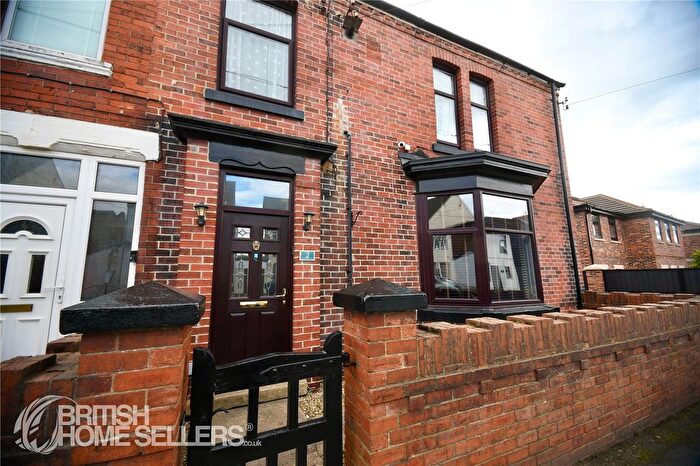
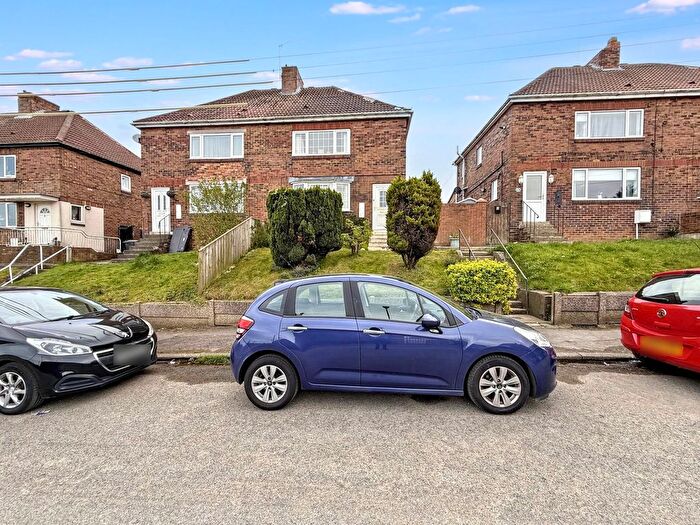
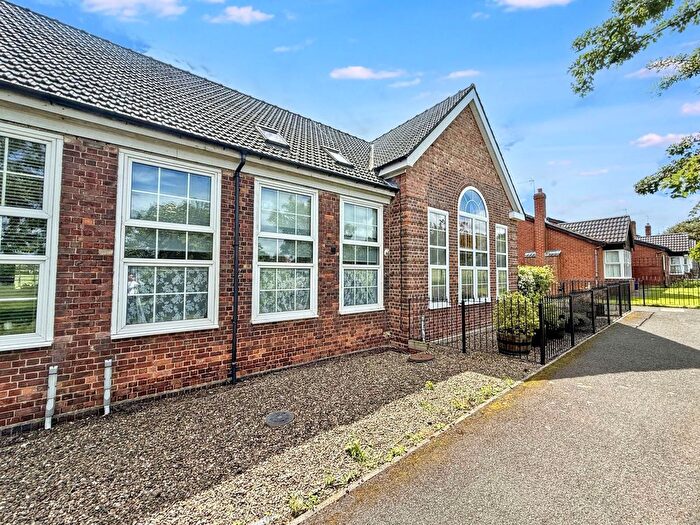
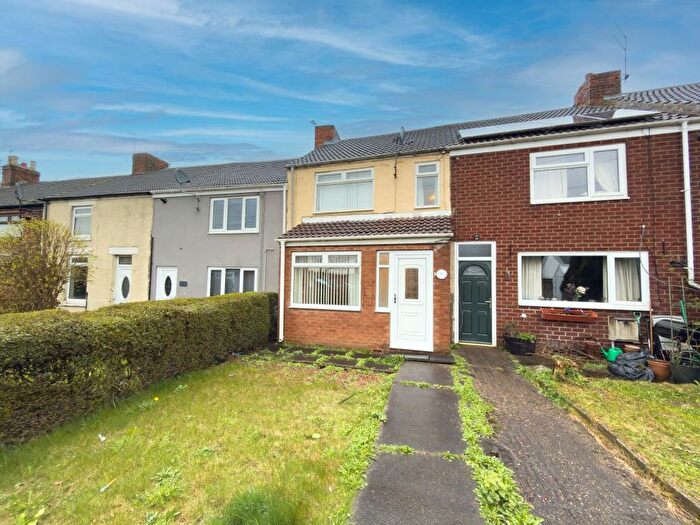
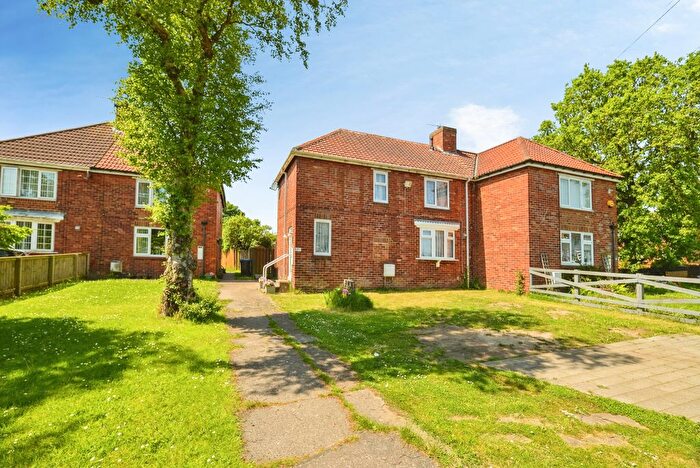
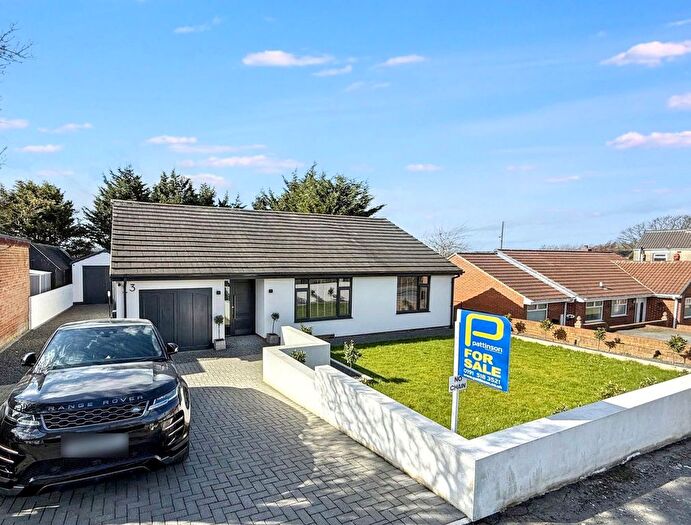
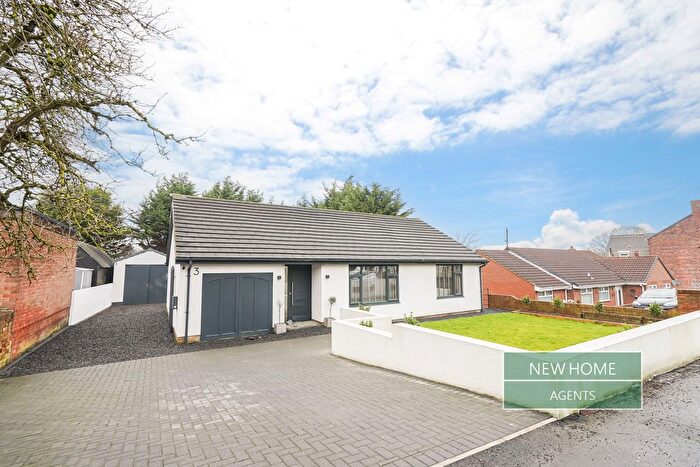
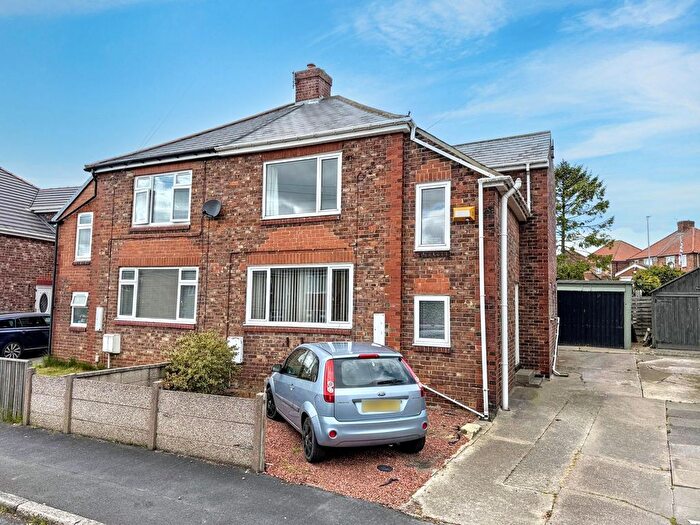
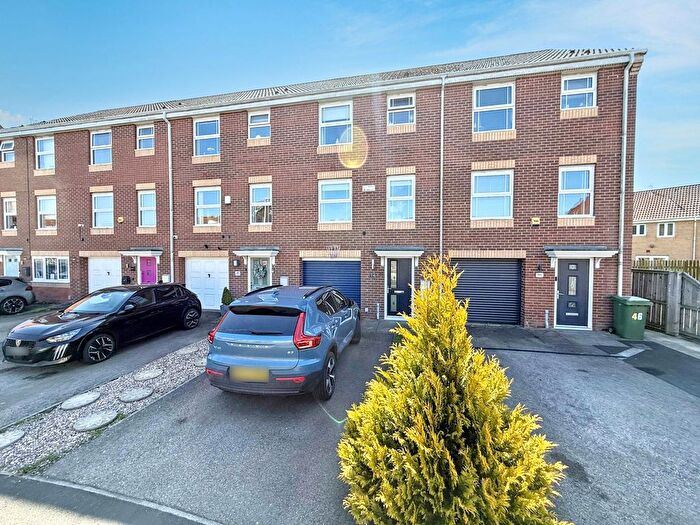
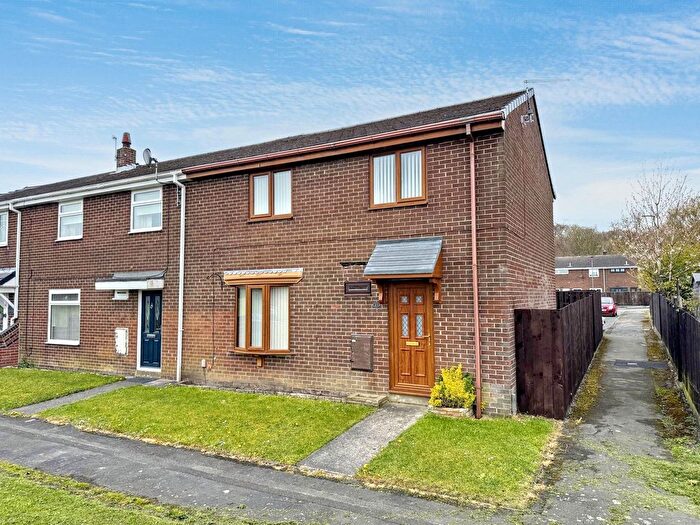
Properties for sale in Blackhalls

Previously listed properties in Blackhalls
![]()
If you are looking to sell your house, let it out, or receive a property valuation, an expert can help you.
Click the button below to get started.

Roads and Postcodes in Blackhalls
Navigate through our locations to find the location of your next house in Blackhalls, Wingate for sale or to rent.
| Streets | Postcodes |
|---|---|
| Beachdale Close | TS28 5HH |
| Brackendale Court | TS28 5HN |
| Bridge Terrace | TS28 5ET |
| Burn Valley Gardens | TS28 5EU |
| Church Street | TS28 5DN |
| Cravens Cottages | TS28 5EQ |
| Dormand Court | TS28 5HJ |
| Ellerburne Terrace | TS28 5EY |
| Ferndale Close | TS28 5HW |
| Front Street | TS28 5DP |
| Gladstone Terrace | TS28 5DA |
| Hartbushes | TS28 5GA |
| Heath View | TS28 5EE |
| Heaton Terrace | TS28 5EX |
| Lake Bank Terrace | TS28 5DH |
| Lake View | TS28 5DQ |
| Milbank Chapel Terrace | TS28 5DS |
| Milbank Terrace | TS28 5EF |
| Newholme Estate | TS28 5EH TS28 5EJ TS28 5EL TS28 5EN TS28 5EW |
| Orchard View | TS28 5AB |
| Rodridge Park | TS28 5PD |
| Rose Cottages | TS28 5HE |
| Station Lane | TS28 5DG |
| The Ridges | TS28 5PE |
| Townsend Court | TS28 5PB |
| West View | TS28 5ER |
| TS28 5HD TS28 5NE TS28 5NG TS28 5PF TS28 5DJ TS28 5EA TS28 5ED TS28 5EP TS28 5EZ TS28 5FA TS28 5HA TS28 5HB TS28 5HF TS28 5HG TS28 5HQ TS28 5LZ TS28 5NA TS28 5NB TS28 5NF TS28 5NH TS28 5NJ TS28 5NL TS28 5NS |
Property price trends in Blackhalls
According to the latest Land Registry data, the average home in Blackhalls sold for £59,333 in 2026. That figure comes from 637 sales logged over the past 31 years.
Prices have fallen back over the last three years. Compared with 2023, when the typical sale came in around £64,400, that's a fall of roughly 7.9%.
Looking back five years, average prices are down about 22% since 2021, a drop of around £16,689 in cash terms.
Zoom out to the past decade for the fuller picture. Back in 2016, homes here averaged £74,287, so the typical sold price has fallen about 20.1% since then, around 2.2% a year lower. Stretch the view to fifteen years and that annual pace edges up closer to -1.8%.
Frequently asked questions about Blackhalls
What is the average price for a property for sale in Blackhalls?
The average price for a property for sale in Blackhalls is £92,139. This amount is 22% lower than the average price in Wingate. There are 401 property listings for sale in Blackhalls.
What streets have the most expensive properties for sale in Blackhalls?
The streets with the most expensive properties for sale in Blackhalls are Hartbushes at an average of £625,000, Rose Cottages at an average of £176,000 and Rodridge Park at an average of £141,000.
What streets have the most affordable properties for sale in Blackhalls?
The streets with the most affordable properties for sale in Blackhalls are Burn Valley Gardens at an average of £39,599, Cravens Cottages at an average of £41,333 and Station Lane at an average of £41,666.
Which train stations are available in or near Blackhalls?
Some of the train stations available in or near Blackhalls are Hartlepool, Seaton Carew and Seaham.
Property Price Paid in Blackhalls by Year
The average sold property price by year was:
| Year | Average Sold Price | Price Change |
Sold Properties
|
|---|---|---|---|
| 2026 | £59,333 | -142% |
3 Properties |
| 2025 | £143,545 | 43% |
22 Properties |
| 2024 | £81,759 | 21% |
38 Properties |
| 2023 | £64,400 | -29% |
23 Properties |
| 2022 | £83,195 | 9% |
20 Properties |
| 2021 | £76,022 | 20% |
38 Properties |
| 2020 | £60,700 | -91% |
14 Properties |
| 2019 | £116,125 | 19% |
16 Properties |
| 2018 | £94,332 | 18% |
29 Properties |
| 2017 | £76,978 | 3% |
25 Properties |
Property Price per Property Type in Blackhalls
Here you can find historic sold price data in order to help with your property search.
The average Property Paid Price for specific property types in the last three years are:
| Property Type | Average Sold Price | Sold Properties |
|---|---|---|
| Semi Detached House | £88,694.00 | 10 Semi Detached Houses |
| Detached House | £285,272.00 | 11 Detached Houses |
| Terraced House | £60,779.00 | 63 Terraced Houses |
| Flat | £35,000.00 | 2 Flats |
