
Houses for sale & to rent in Backbury, Hereford
House Prices in Backbury
Properties in Backbury have an average house price of £382k and had 93 Property Transactions within the last 3 years¹.
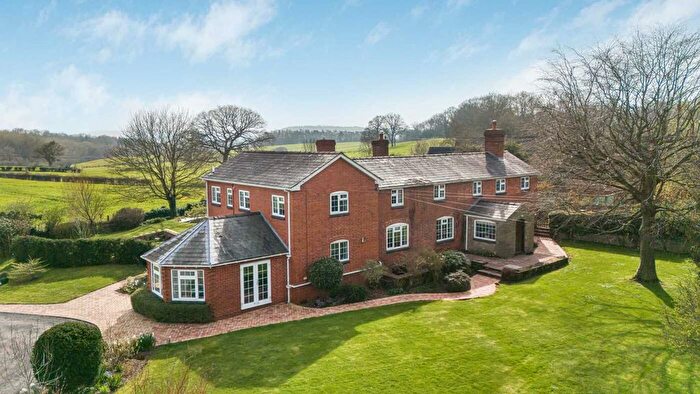
Backbury is an area in Hereford, County of Herefordshire with 1,288 households², where the most expensive property was sold for £940k.
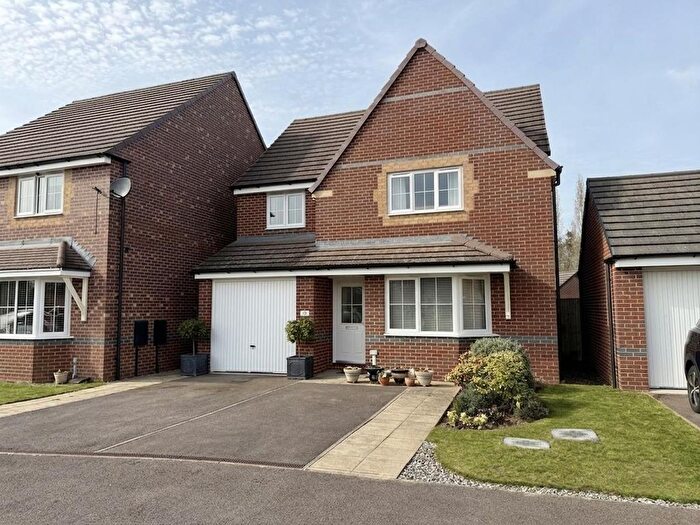
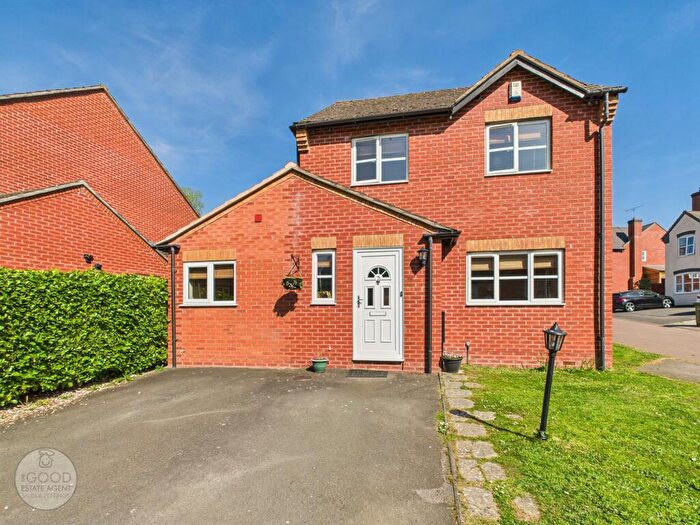
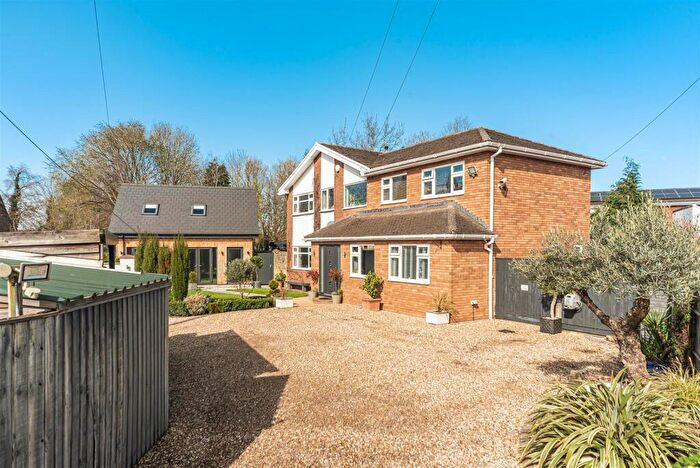
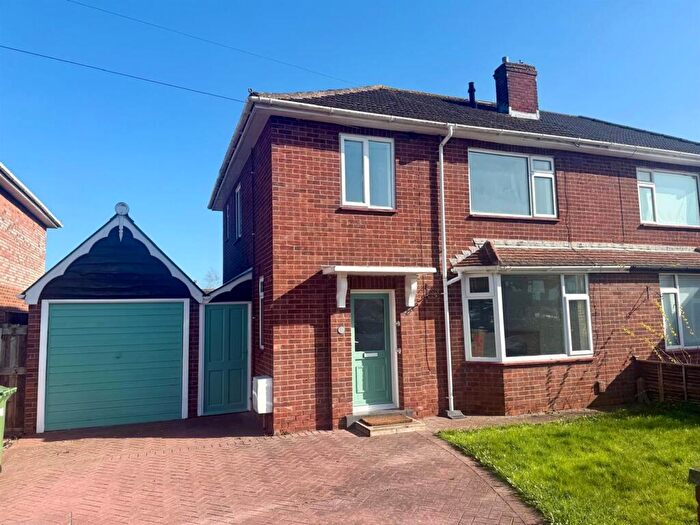
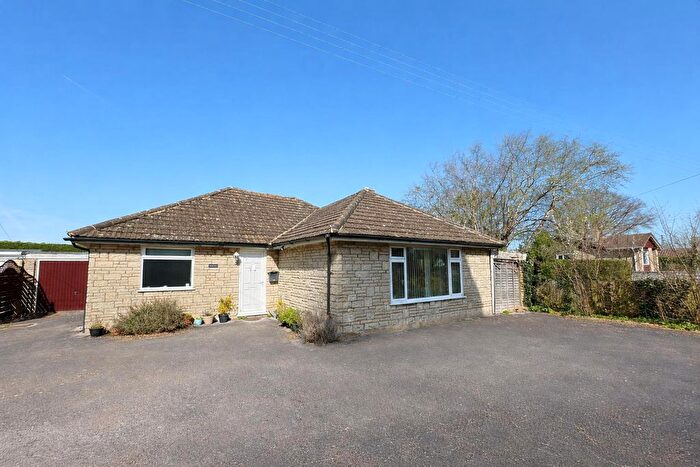
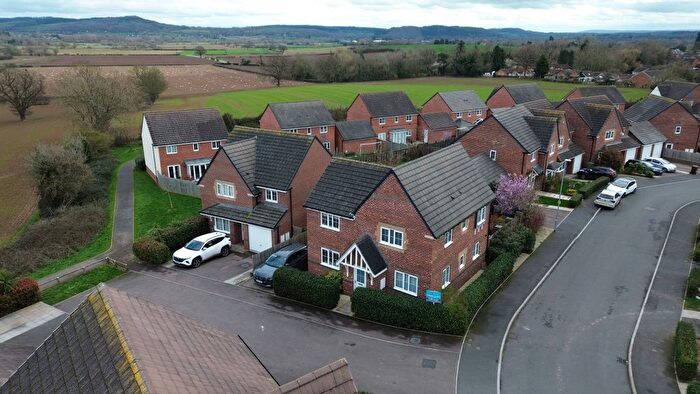
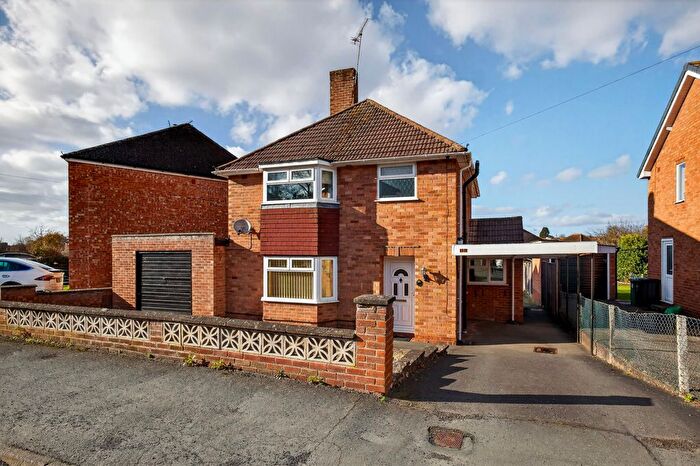
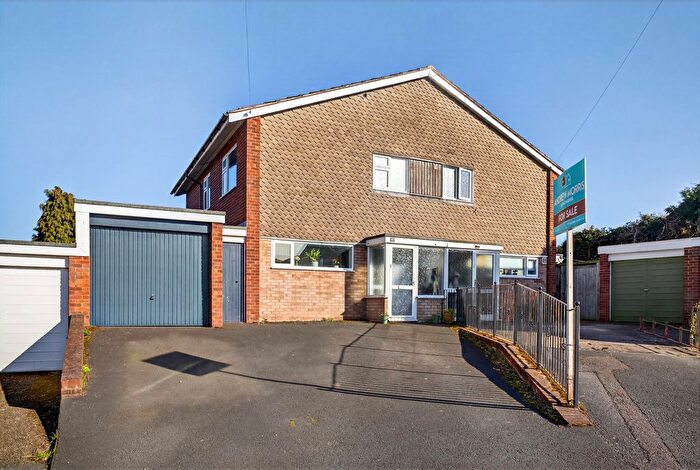
Properties for sale in Backbury
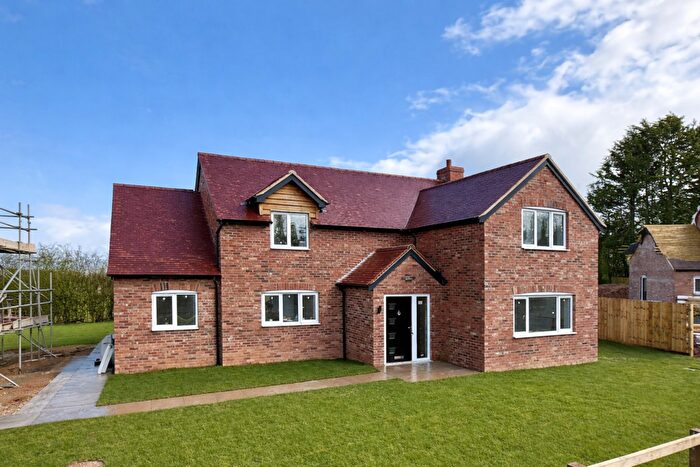
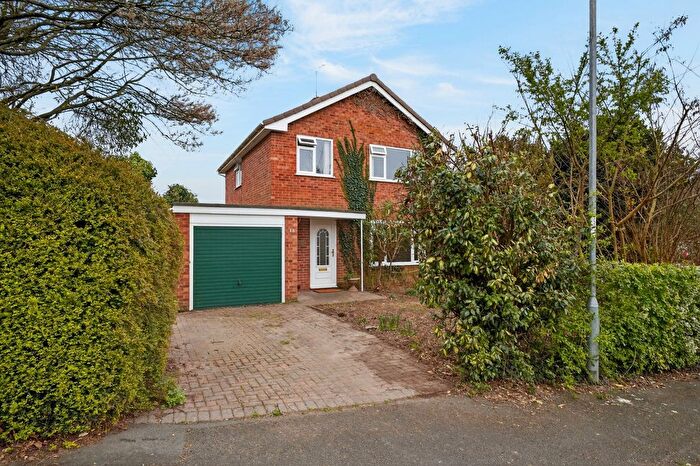
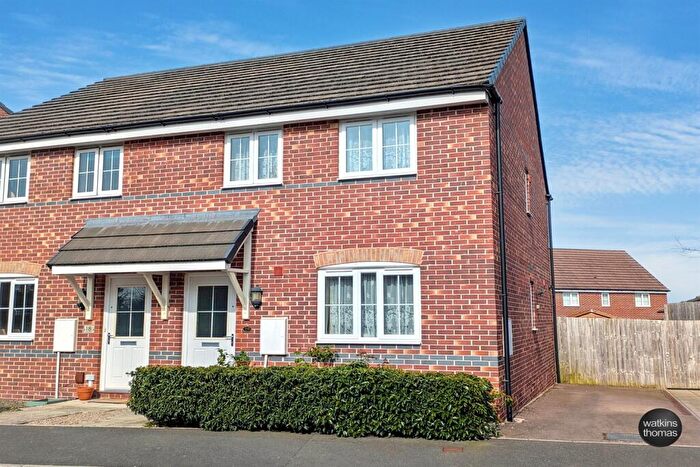
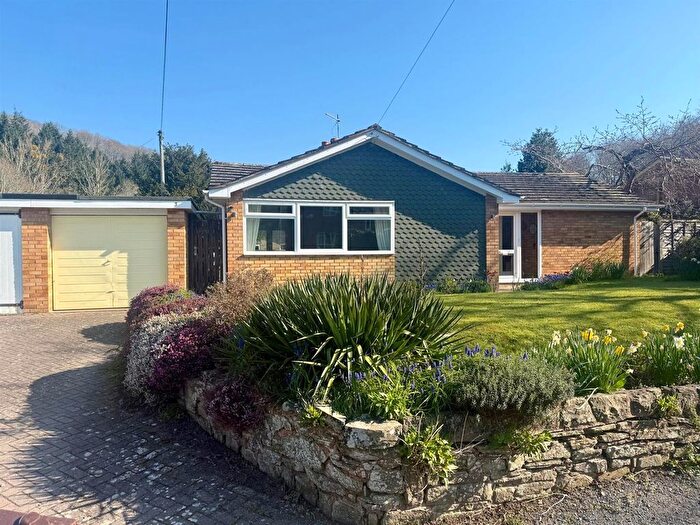
![]()
If you are looking to sell your house, let it out, or receive a property valuation, an expert can help you.
Click the button below to get started.

Roads and Postcodes in Backbury
Navigate through our locations to find the location of your next house in Backbury, Hereford for sale or to rent.
Transport near Backbury
-
 Hereford Station
 -
Ledbury Station
-
Colwall Station
-
Great Malvern Station
-
Leominster Station
-
Malvern Link Station
- FAQ
- Price Paid By Year
- Property Type Price
Frequently asked questions about Backbury
What is the average price for a property for sale in Backbury?
The average price for a property for sale in Backbury is £382,106. This amount is 22% higher than the average price in Hereford. There are 1,902 property listings for sale in Backbury.
What streets have the most expensive properties for sale in Backbury?
The streets with the most expensive properties for sale in Backbury are Church View at an average of £725,000, Shucknall Hill at an average of £612,000 and The Laurels at an average of £495,000.
What streets have the most affordable properties for sale in Backbury?
The streets with the most affordable properties for sale in Backbury are Shepherds Orchard at an average of £117,500, Pound Close at an average of £223,000 and Court Orchard at an average of £230,333.
Which train stations are available in or near Backbury?
Some of the train stations available in or near Backbury are Hereford, Ledbury and Colwall.
Property Price Paid in Backbury by Year
The average sold property price by year was:
| Year | Average Sold Price | Price Change |
Sold Properties
|
|---|---|---|---|
| 2025 | £370,699 | -8% |
30 Properties |
| 2024 | £401,055 | 6% |
27 Properties |
| 2023 | £377,401 | -4% |
36 Properties |
| 2022 | £392,570 | 5% |
30 Properties |
| 2021 | £371,099 | 3% |
59 Properties |
| 2020 | £361,747 | 19% |
45 Properties |
| 2019 | £294,263 | 3% |
51 Properties |
| 2018 | £284,704 | -4% |
101 Properties |
| 2017 | £294,999 | -6% |
82 Properties |
| 2016 | £312,936 | -4% |
43 Properties |
| 2015 | £326,549 | 15% |
40 Properties |
| 2014 | £276,484 | 1% |
36 Properties |
| 2013 | £274,640 | 13% |
32 Properties |
| 2012 | £239,400 | -26% |
35 Properties |
| 2011 | £302,060 | -5% |
39 Properties |
| 2010 | £315,701 | 22% |
25 Properties |
| 2009 | £246,562 | -50% |
39 Properties |
| 2008 | £369,537 | 22% |
27 Properties |
| 2007 | £288,894 | -0,5% |
55 Properties |
| 2006 | £290,287 | 1% |
51 Properties |
| 2005 | £286,060 | 17% |
38 Properties |
| 2004 | £236,406 | -3% |
36 Properties |
| 2003 | £242,858 | 22% |
60 Properties |
| 2002 | £189,995 | 11% |
74 Properties |
| 2001 | £169,074 | 9% |
56 Properties |
| 2000 | £153,227 | 19% |
46 Properties |
| 1999 | £124,751 | 16% |
51 Properties |
| 1998 | £104,558 | 7% |
60 Properties |
| 1997 | £96,749 | -2% |
62 Properties |
| 1996 | £98,417 | 9% |
76 Properties |
| 1995 | £89,877 | - |
37 Properties |
Property Price per Property Type in Backbury
Here you can find historic sold price data in order to help with your property search.
The average Property Paid Price for specific property types in the last three years are:
| Property Type | Average Sold Price | Sold Properties |
|---|---|---|
| Semi Detached House | £263,138.00 | 25 Semi Detached Houses |
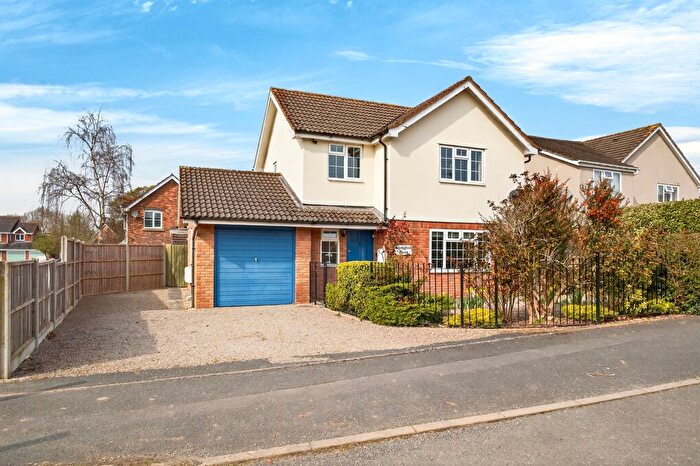
| Detached House | £465,789.00 | 57 Detached Houses |
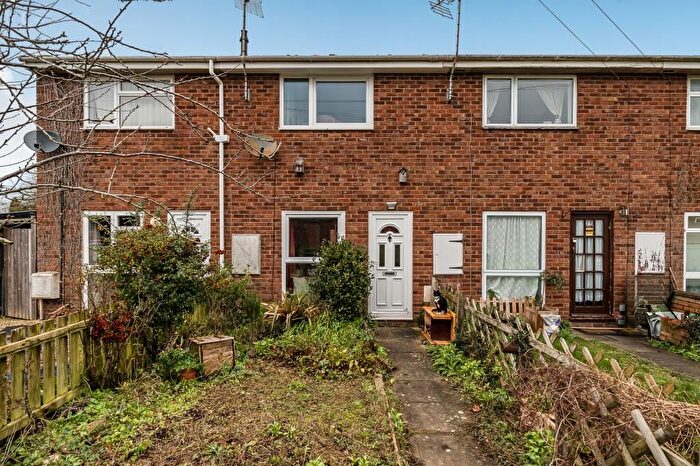
| Terraced House | £234,888.00 | 9 Terraced Houses |
| Flat | £146,750.00 | 2 Flats |