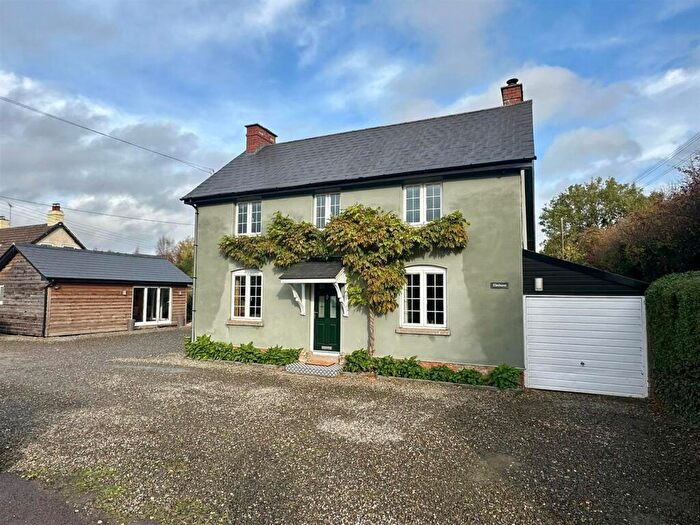
Houses for sale & to rent in Hagley, Hereford
House Prices in Hagley
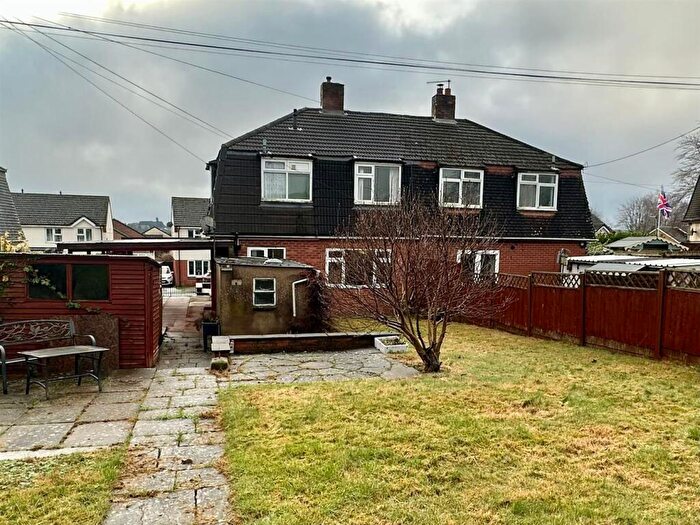
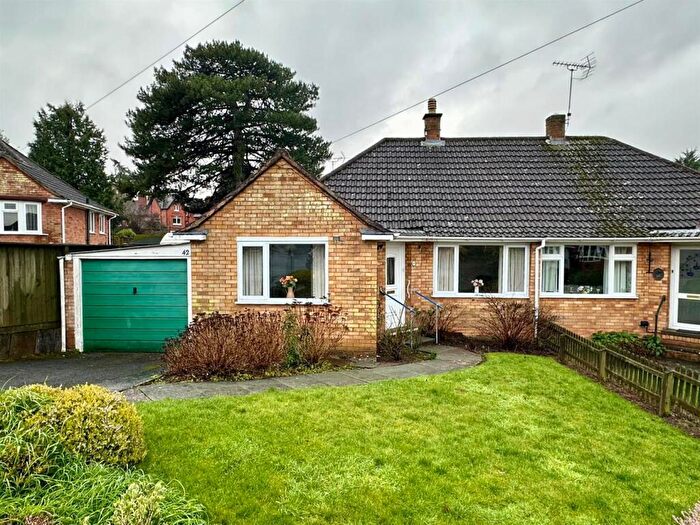
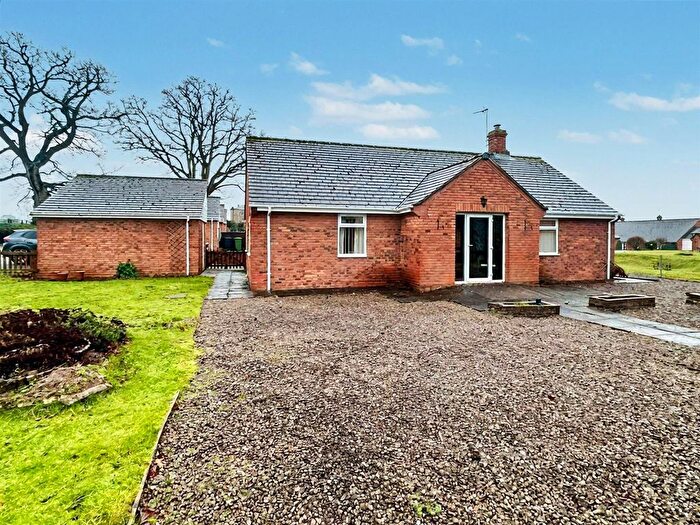
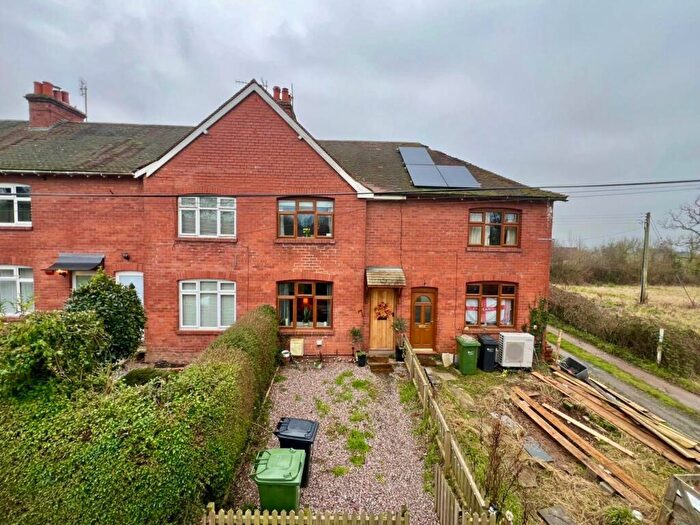
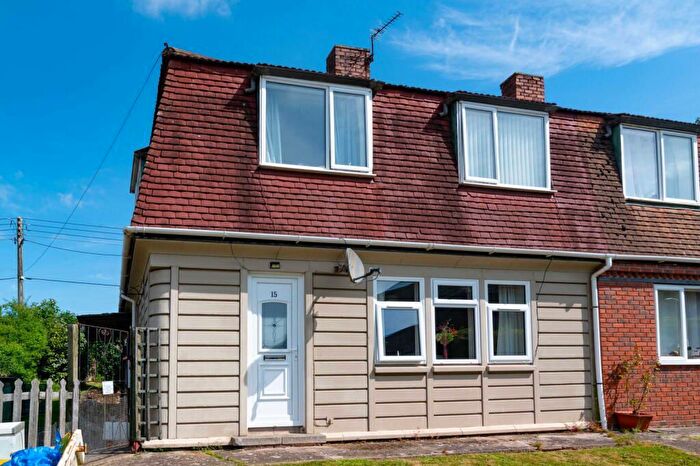
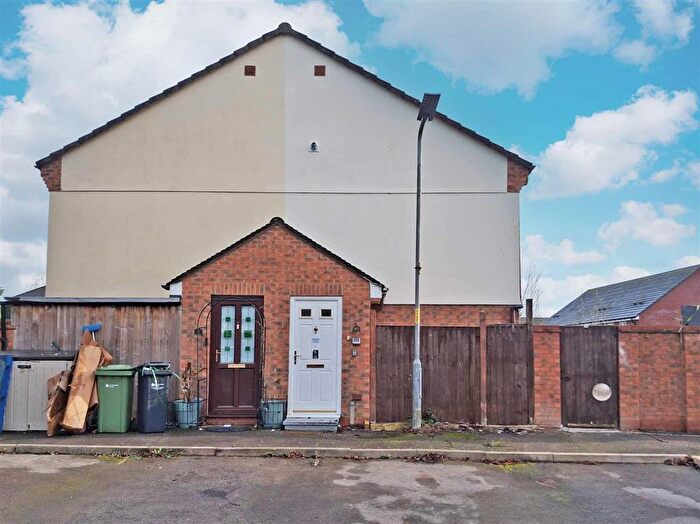
Properties in Hagley have an average house price of £381,551.00 and had 151 Property Transactions within the last 3 years¹.
Hagley is an area in Hereford, County of Herefordshire with 1,473 households², where the most expensive property was sold for £1,600,000.00.
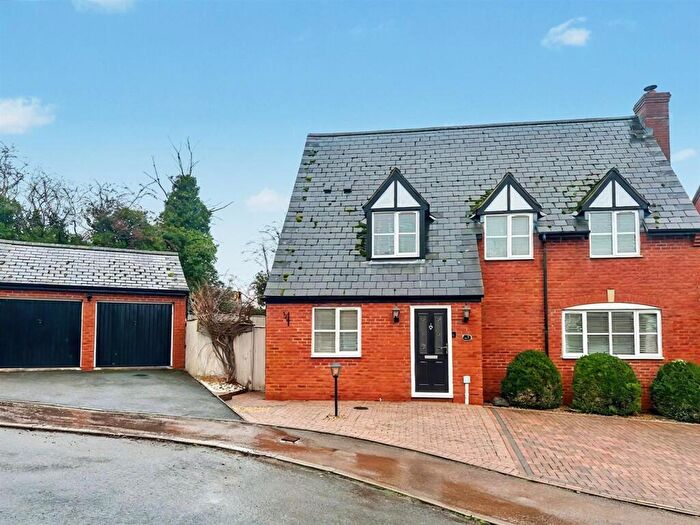
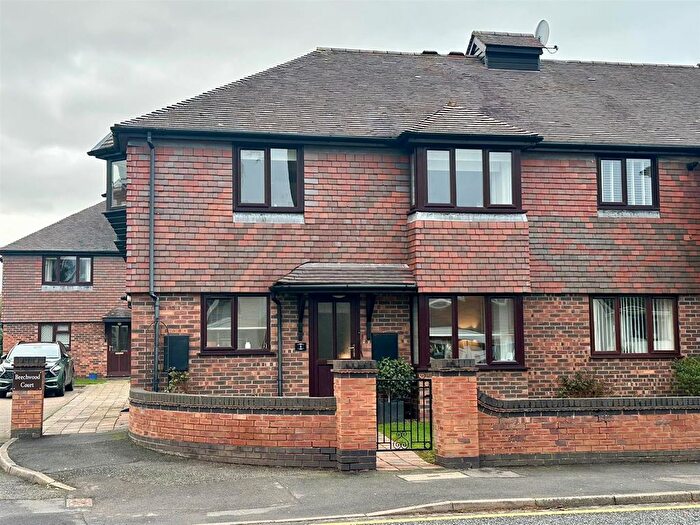
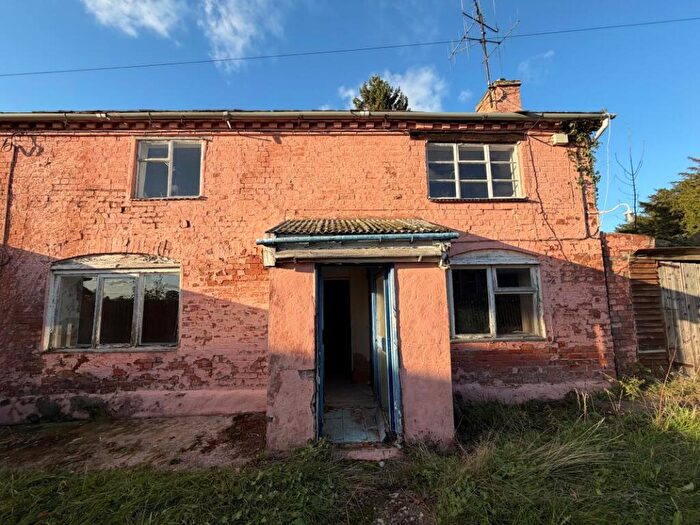
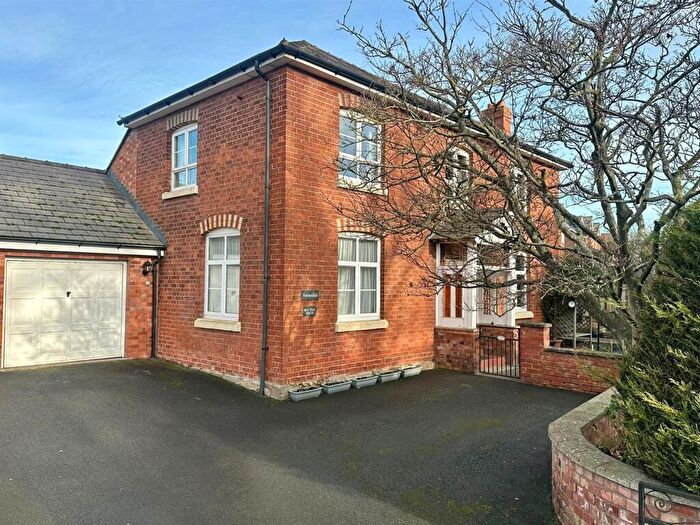
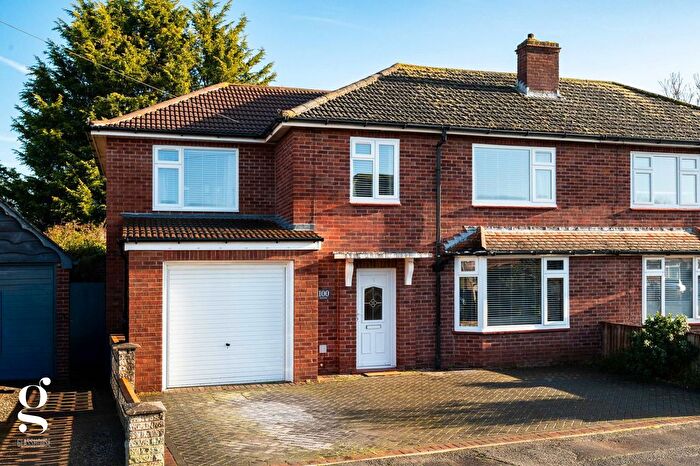
Properties for sale in Hagley
Roads and Postcodes in Hagley
Navigate through our locations to find the location of your next house in Hagley, Hereford for sale or to rent.
| Streets | Postcodes |
|---|---|
| Arrowsmith Avenue | HR1 4DW |
| Bankfield Drive | HR1 3RW |
| Barber Close | HR1 4DZ |
| Barneby Avenue | HR1 4AN HR1 4DH |
| Burdon Drive | HR1 4DL |
| Chapel Road | HR1 3FL |
| Cherry Tree Court | HR1 4FG |
| Coppice Close | HR1 3PP |
| Court Close | HR1 4AD |
| Croft Close | HR1 4DJ |
| Cross Keys | HR1 3NN HR1 3NT HR1 3NW HR1 3NX HR1 3NY HR1 3NZ |
| Duke Street | HR1 3QD |
| Farndon Rise | HR1 3PU |
| Frome Court | HR1 4DX |
| Frome Park | HR1 4BF |
| Greenfields | HR1 3RS |
| Hagley Orchard | HR1 4BU |
| Hagley Park | HR1 4DB |
| Hill View Avenue | HR1 3RP |
| Hollylea Close | HR1 4DN |
| Hopton Close | HR1 4DQ |
| Longworth | HR1 4DE |
| Longworth Lane | HR1 4GA HR1 4GB |
| Lugg Bridge | HR1 3ND |
| Lugg Bridge Road | HR1 3NA HR1 3NB |
| Lugwardine Court Orchard | HR1 4HB |
| Lumber Lane | HR1 4AG HR1 4AH HR1 4AQ |
| Malvern Place | HR1 4AU |
| Matchcroft | HR1 3NH |
| Meadow Close | HR1 3RR |
| Milestone Way | HR1 3TG |
| Nursery Cottages | HR1 4BP |
| Old School Cottages | HR1 3QA |
| Orchard Lea | HR1 4FP |
| Orchard Vale | HR1 4FF |
| Quarry Field | HR1 4BS |
| Rhystone Lane | HR1 4AW |
| South Bank | HR1 3SA HR1 3SQ |
| Springfield Road | HR1 3RU |
| St James Close | HR1 4AY |
| St Peters Close | HR1 4AT |
| St Peters Field | HR1 3TF |
| The Orchards | HR1 3TH |
| The Walk | HR1 3PR |
| Tidnor Rise | HR1 4HT |
| Traherne Close | HR1 4AF |
| Veldo Lane | HR1 3QB |
| Village Way | HR1 4FH |
| Vine Tree Close | HR1 3QW |
| Wharf Cottages | HR1 3NU |
| Wilcroft Park | HR1 4DG |
| Williams Mead | HR1 4BT |
| Willow Lea | HR1 4FJ |
| Willowfields | HR1 3RT |
| Withies Close | HR1 3PS |
| HR1 3NE HR1 3NG HR1 3NJ HR1 3NQ HR1 3PA HR1 3PB HR1 3PE HR1 3PX HR1 3PY HR1 3PZ HR1 3QE HR1 3QF HR1 3RL HR1 3RQ HR1 3RX HR1 3RY HR1 3RZ HR1 3SB HR1 3SD HR1 3SE HR1 3SG HR1 4AA HR1 4AB HR1 4AE HR1 4AJ HR1 4AL HR1 4AP HR1 4AS HR1 4BA HR1 4BB HR1 4BD HR1 4BE HR1 4BQ HR1 4BX HR1 4BY HR1 4DA HR1 4DP HR1 4DS HR1 4DT HR1 4DU HR1 3NF HR1 3PD HR1 3QG HR1 3RJ HR1 4AR HR1 4BZ HR1 4DD HR1 4DF HR1 4DR HR1 4HA HR1 4RY |
Transport near Hagley
-
Hereford Station
-
Ledbury Station
-
Leominster Station
-
Colwall Station
-
Great Malvern Station
-
Malvern Link Station
- FAQ
- Price Paid By Year
- Property Type Price
Frequently asked questions about Hagley
What is the average price for a property for sale in Hagley?
The average price for a property for sale in Hagley is £381,551. This amount is 22% higher than the average price in Hereford. There are 1,610 property listings for sale in Hagley.
What streets have the most expensive properties for sale in Hagley?
The streets with the most expensive properties for sale in Hagley are Hagley Orchard at an average of £625,000, Williams Mead at an average of £546,500 and St Peters Close at an average of £522,737.
What streets have the most affordable properties for sale in Hagley?
The streets with the most affordable properties for sale in Hagley are Withies Close at an average of £192,000, South Bank at an average of £198,800 and Hill View Avenue at an average of £205,000.
Which train stations are available in or near Hagley?
Some of the train stations available in or near Hagley are Hereford, Ledbury and Leominster.
Property Price Paid in Hagley by Year
The average sold property price by year was:
| Year | Average Sold Price | Price Change |
Sold Properties
|
|---|---|---|---|
| 2025 | £342,594 | -26% |
42 Properties |
| 2024 | £430,890 | 18% |
61 Properties |
| 2023 | £352,936 | -5% |
48 Properties |
| 2022 | £370,380 | 9% |
70 Properties |
| 2021 | £338,141 | 6% |
83 Properties |
| 2020 | £316,603 | 6% |
89 Properties |
| 2019 | £298,630 | 8% |
128 Properties |
| 2018 | £275,265 | 6% |
119 Properties |
| 2017 | £259,956 | 14% |
72 Properties |
| 2016 | £223,859 | -10% |
58 Properties |
| 2015 | £245,686 | -3% |
56 Properties |
| 2014 | £253,712 | 9% |
54 Properties |
| 2013 | £230,204 | -2% |
47 Properties |
| 2012 | £234,590 | -14% |
52 Properties |
| 2011 | £266,395 | 10% |
46 Properties |
| 2010 | £240,325 | 7% |
46 Properties |
| 2009 | £222,385 | 0,2% |
55 Properties |
| 2008 | £221,927 | -9% |
44 Properties |
| 2007 | £242,781 | 8% |
84 Properties |
| 2006 | £224,378 | 7% |
87 Properties |
| 2005 | £208,928 | -7% |
97 Properties |
| 2004 | £223,323 | 11% |
83 Properties |
| 2003 | £199,341 | 17% |
85 Properties |
| 2002 | £165,885 | 17% |
94 Properties |
| 2001 | £137,359 | 9% |
70 Properties |
| 2000 | £124,828 | 19% |
67 Properties |
| 1999 | £100,797 | 14% |
86 Properties |
| 1998 | £86,910 | -12% |
101 Properties |
| 1997 | £97,289 | 5% |
100 Properties |
| 1996 | £92,015 | 16% |
97 Properties |
| 1995 | £76,899 | - |
63 Properties |
Property Price per Property Type in Hagley
Here you can find historic sold price data in order to help with your property search.
The average Property Paid Price for specific property types in the last three years are:
| Property Type | Average Sold Price | Sold Properties |
|---|---|---|
| Semi Detached House | £266,372.00 | 24 Semi Detached Houses |
| Detached House | £484,426.00 | 91 Detached Houses |
| Terraced House | £210,867.00 | 23 Terraced Houses |
| Flat | £176,038.00 | 13 Flats |

