
Houses for sale & to rent in Bromyard, Hereford
House Prices in Bromyard
Properties in Bromyard have an average house price of £530k and had 9 Property Transactions within the last 3 years¹.
Bromyard is an area in Hereford, County of Herefordshire with 238 households², where the most expensive property was sold for £1.44M.
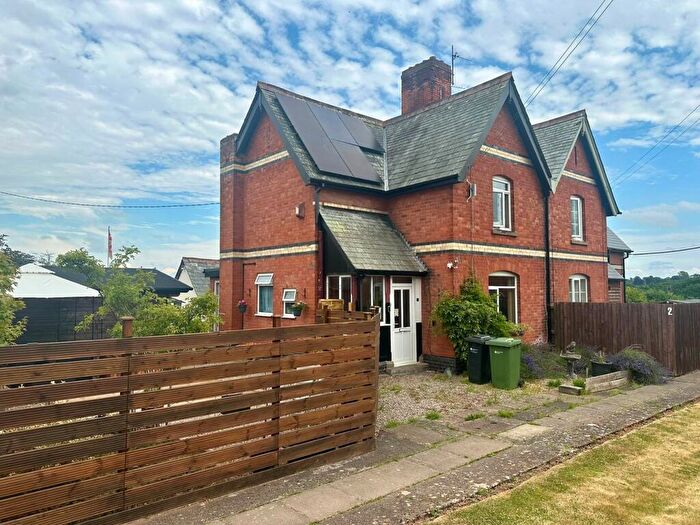
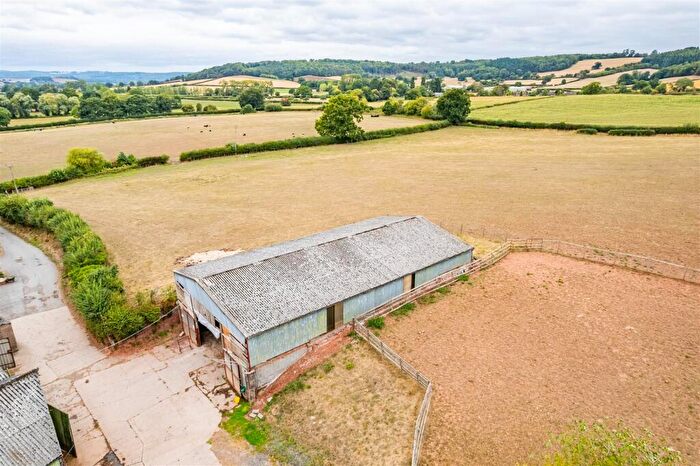
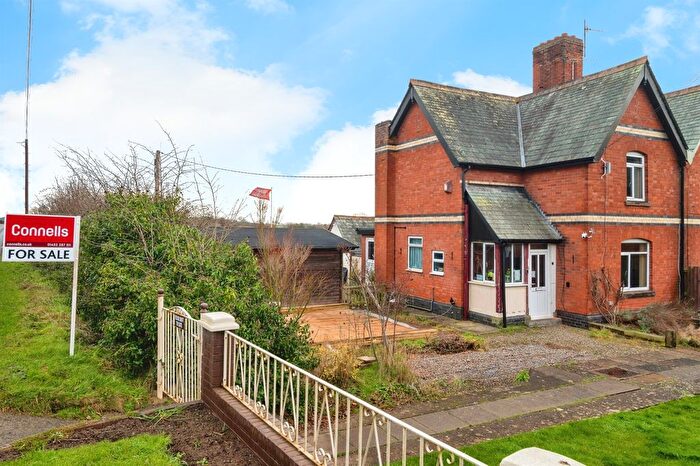
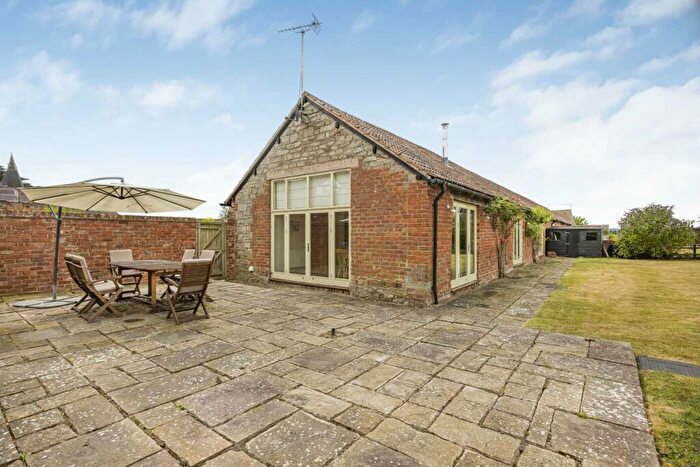
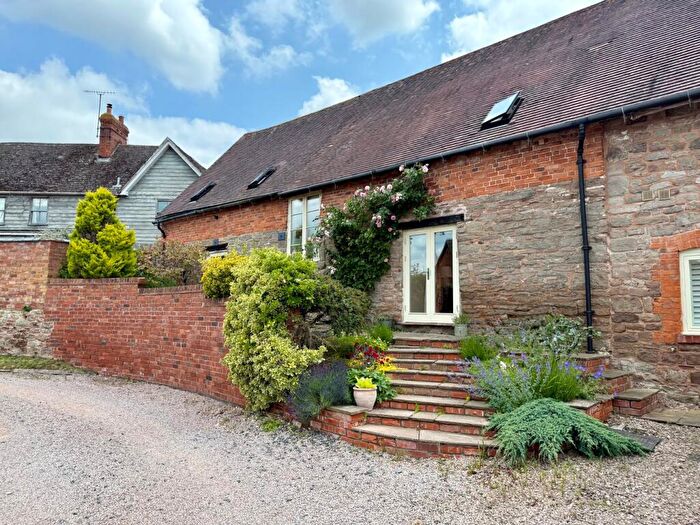
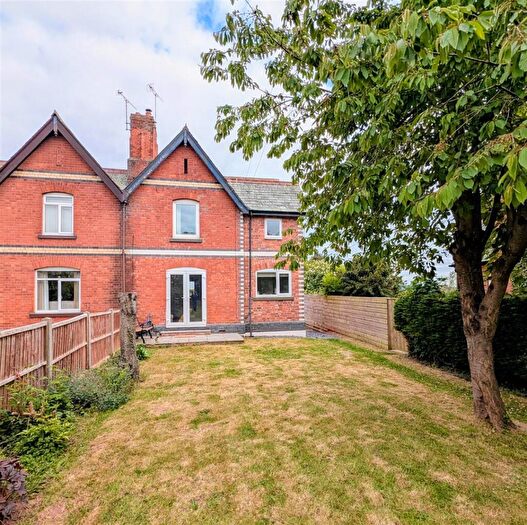
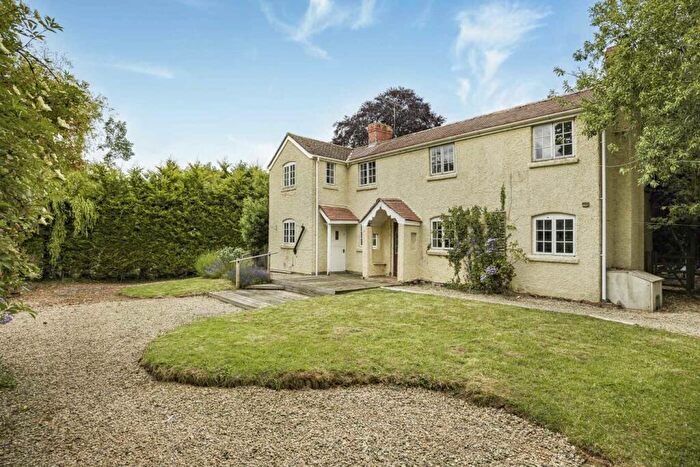
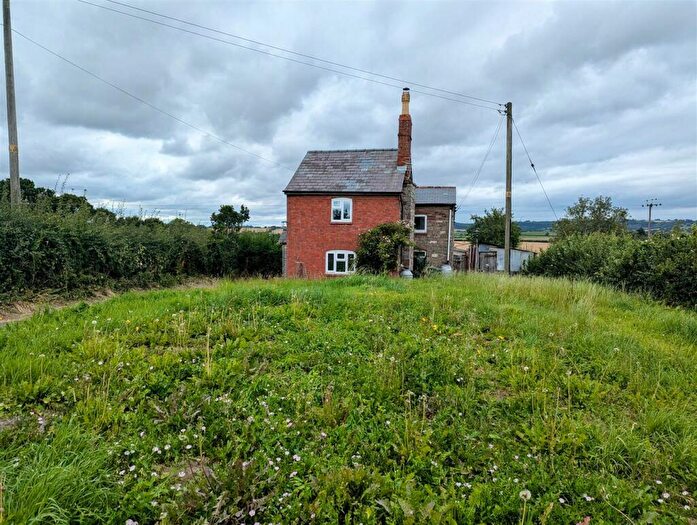
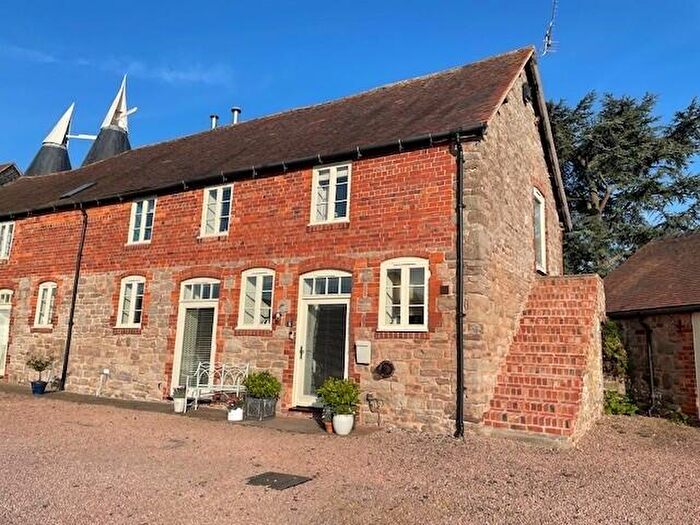
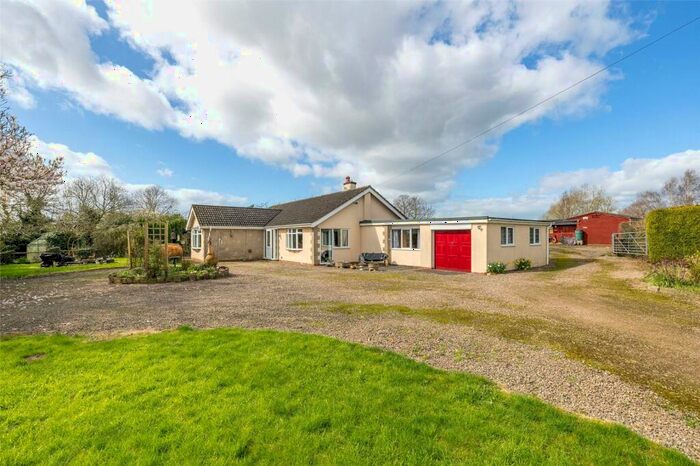
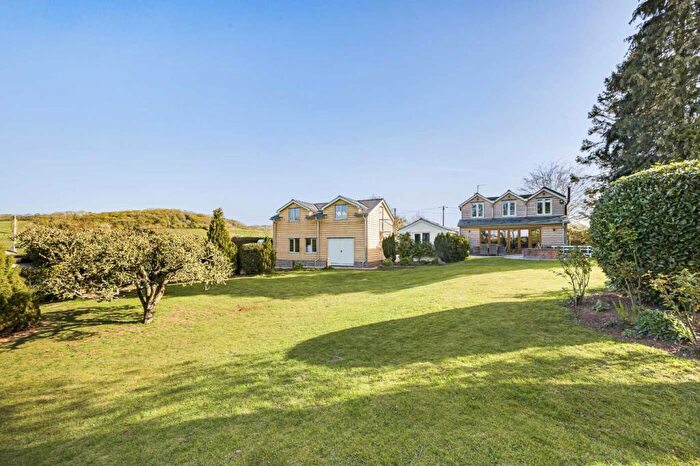
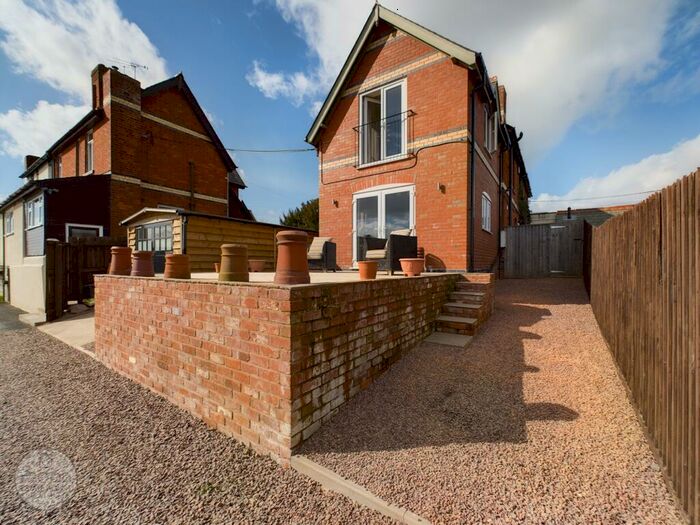
Properties for sale in Bromyard

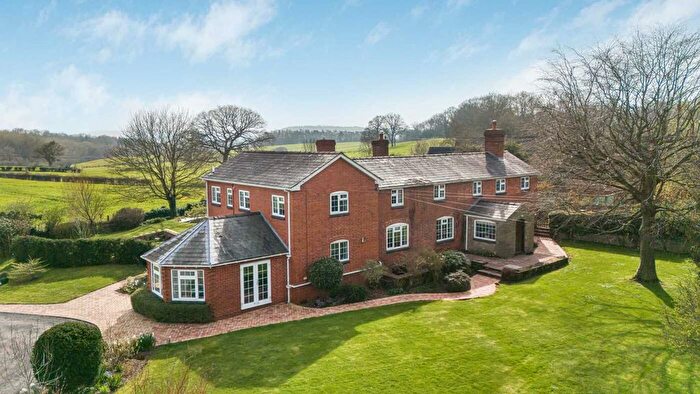
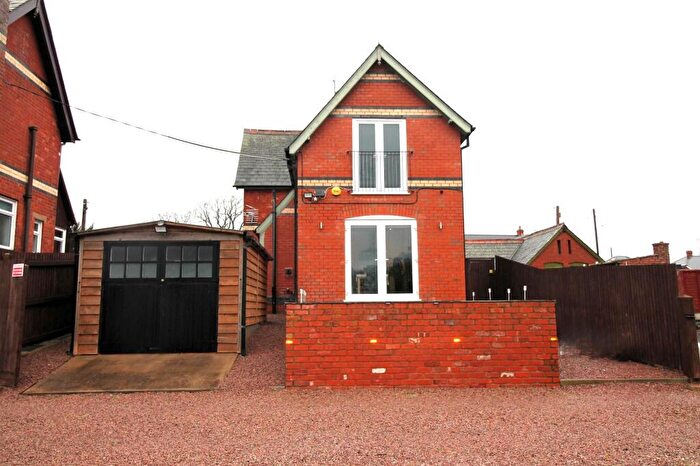
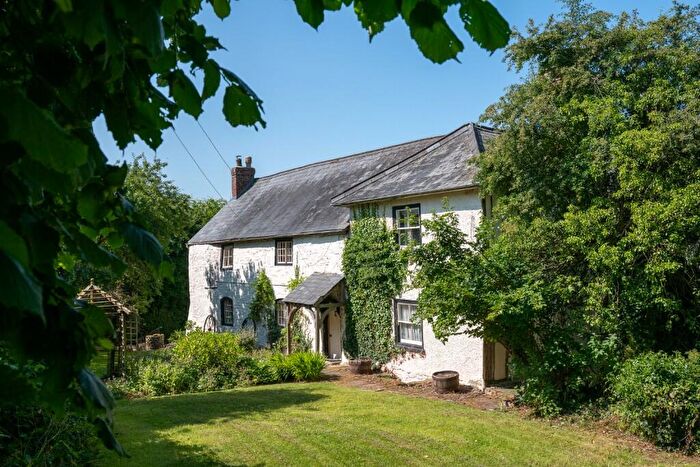
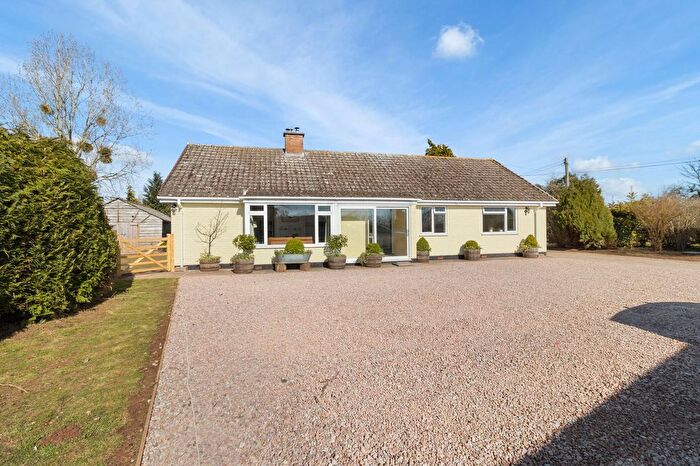
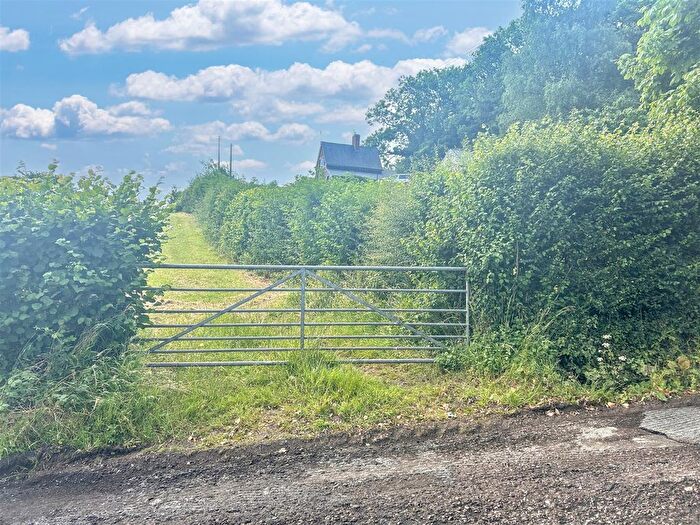
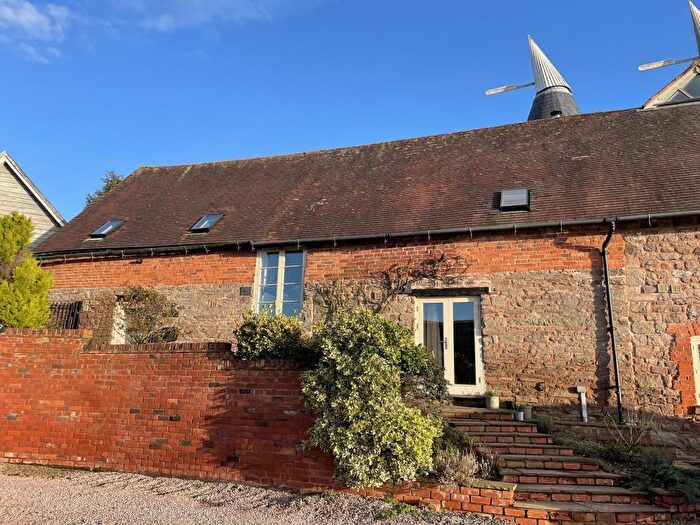
Previously listed properties in Bromyard


![]()
If you are looking to sell your house, let it out, or receive a property valuation, an expert can help you.
Click the button below to get started.


Roads and Postcodes in Bromyard
Navigate through our locations to find the location of your next house in Bromyard, Hereford for sale or to rent.
| Streets | Postcodes |
|---|---|
| Broadway Cottages | HR1 3QJ |
| Burley Gate | HR1 3QR |
| Hill Hampton | HR1 3QP |
| Hinton Cottages | HR1 3PQ |
| Ocle Mead | HR1 3RN |
| Orchard Cottages | HR1 3RB |
| Rosemaund Drive | HR1 3PF |
| Sebastapol Cottages | HR1 3QH |
| HR1 3JF HR1 3JG HR1 3JQ HR1 3PH HR1 3PJ HR1 3PL HR1 3PN HR1 3PW HR1 3QL HR1 3QN HR1 3RE HR1 3RG |
Transport near Bromyard

- FAQ
- Price Paid By Year
- Property Type Price
Frequently asked questions about Bromyard
What is the average price for a property for sale in Bromyard?
The average price for a property for sale in Bromyard is £530,055. This amount is 69% higher than the average price in Hereford. There are 54 property listings for sale in Bromyard.
What streets have the most expensive properties for sale in Bromyard?
The streets with the most expensive properties for sale in Bromyard are Hill Hampton at an average of £550,000 and Rosemaund Drive at an average of £367,000.
What streets have the most affordable properties for sale in Bromyard?
The street with the most affordable properties for sale in Bromyard is Sebastapol Cottages at an average of £287,000.
Which train stations are available in or near Bromyard?
Some of the train stations available in or near Bromyard are Hereford, Leominster and Ledbury.
Property Price Paid in Bromyard by Year
The average sold property price by year was:
| Year | Average Sold Price | Price Change |
Sold Properties
|
|---|---|---|---|
| 2024 | £408,250 | -54% |
4 Properties |
| 2023 | £627,500 | 48% |
5 Properties |
| 2022 | £328,000 | -19% |
4 Properties |
| 2021 | £390,656 | 14% |
10 Properties |
| 2020 | £335,000 | -79% |
1 Property |
| 2019 | £600,000 | 46% |
1 Property |
| 2018 | £325,833 | -5% |
6 Properties |
| 2017 | £343,714 | 21% |
7 Properties |
| 2016 | £273,200 | 2% |
5 Properties |
| 2015 | £267,500 | -39% |
2 Properties |
| 2014 | £372,900 | 33% |
5 Properties |
| 2013 | £250,285 | -13% |
7 Properties |
| 2012 | £282,714 | -11% |
7 Properties |
| 2011 | £314,277 | 17% |
9 Properties |
| 2010 | £260,605 | -32% |
9 Properties |
| 2009 | £344,500 | -14% |
5 Properties |
| 2008 | £393,750 | 3% |
6 Properties |
| 2007 | £380,000 | 28% |
7 Properties |
| 2006 | £273,241 | -3% |
6 Properties |
| 2005 | £281,214 | 1% |
7 Properties |
| 2004 | £279,500 | 35% |
5 Properties |
| 2003 | £182,300 | 18% |
5 Properties |
| 2002 | £150,331 | -31% |
3 Properties |
| 2001 | £197,000 | 42% |
6 Properties |
| 2000 | £115,000 | -10% |
4 Properties |
| 1999 | £126,750 | 37% |
8 Properties |
| 1998 | £79,500 | -48% |
1 Property |
| 1997 | £117,666 | -9% |
6 Properties |
| 1996 | £128,740 | 39% |
5 Properties |
| 1995 | £78,400 | - |
5 Properties |
Property Price per Property Type in Bromyard
Here you can find historic sold price data in order to help with your property search.
The average Property Paid Price for specific property types in the last three years are:
| Property Type | Average Sold Price | Sold Properties |
|---|---|---|
| Semi Detached House | £358,000.00 | 3 Semi Detached Houses |
| Terraced House | £409,750.00 | 2 Terraced Houses |
| Detached House | £719,250.00 | 4 Detached Houses |