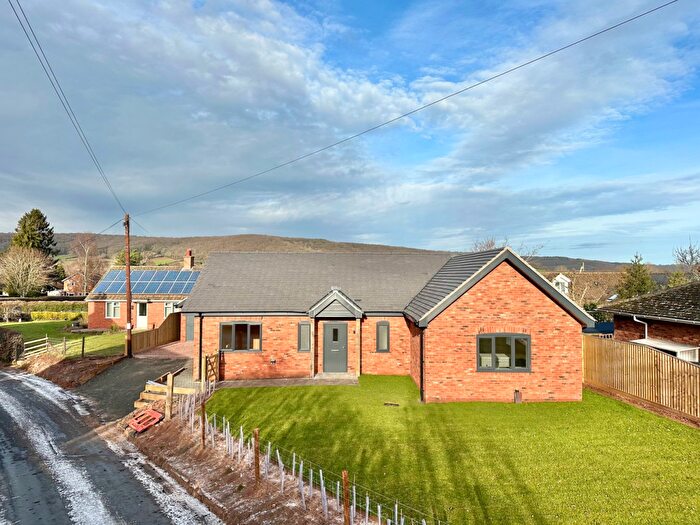
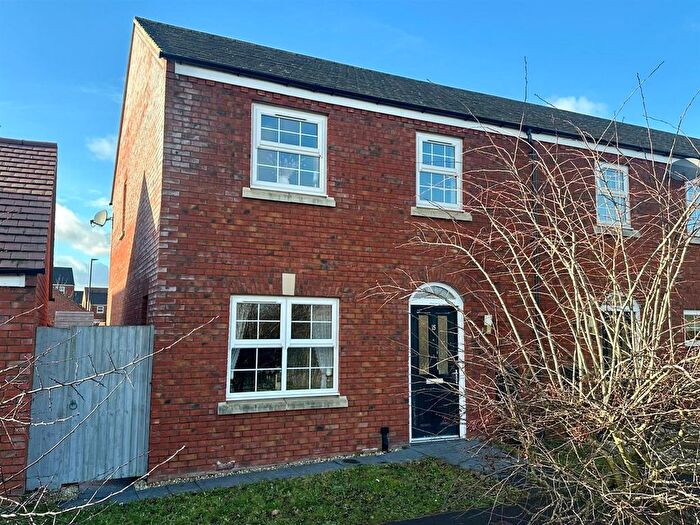
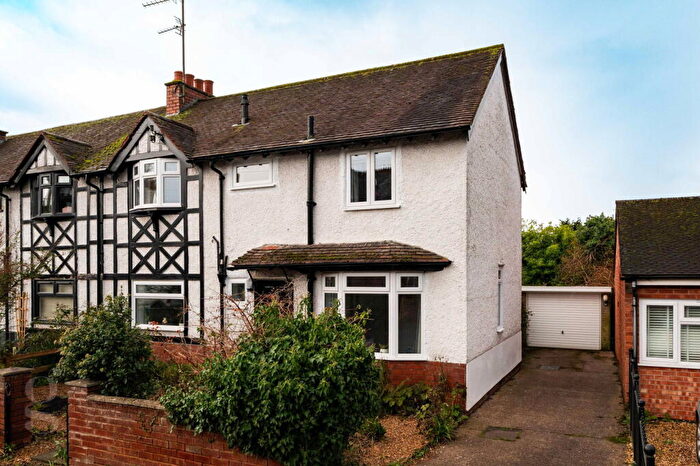
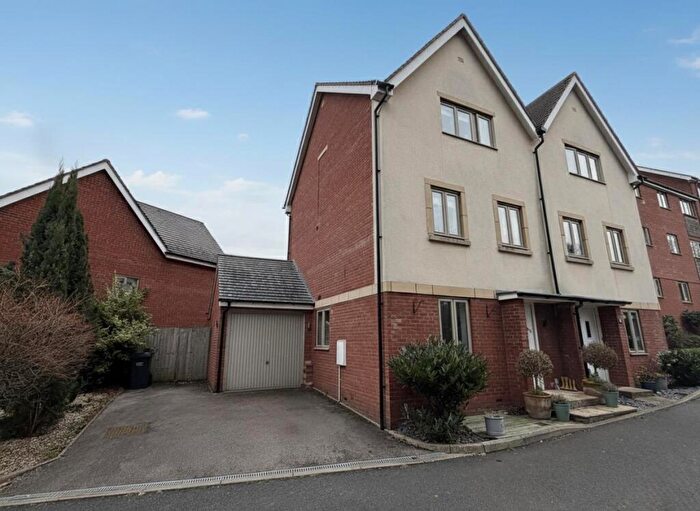
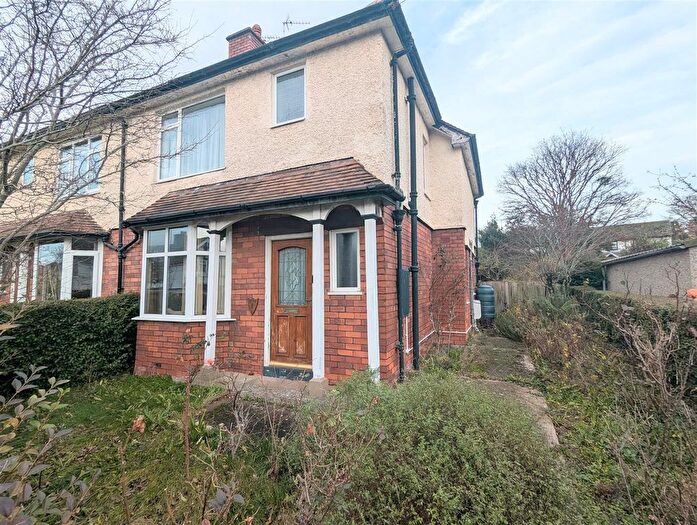
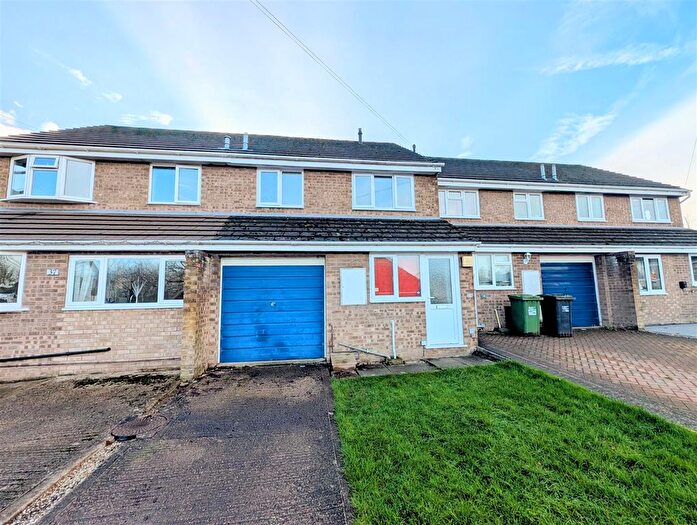
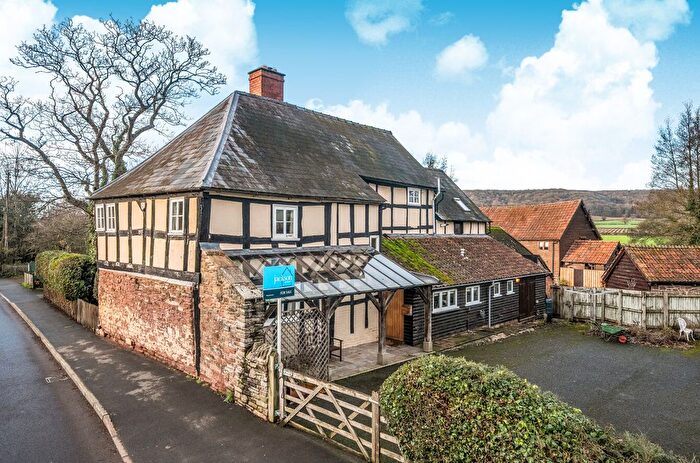
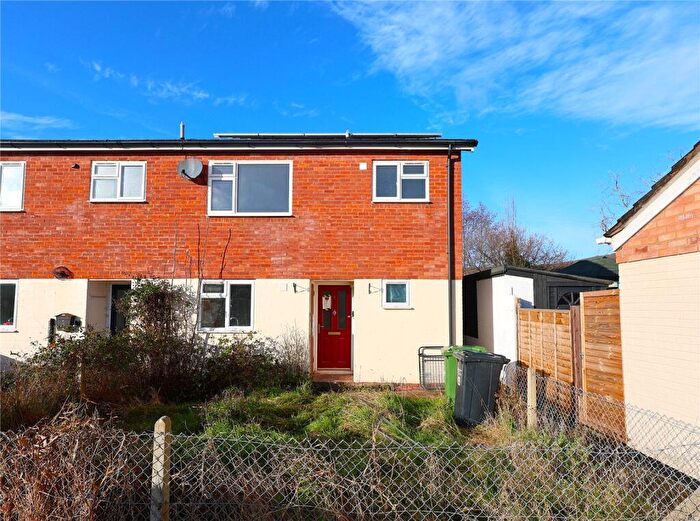
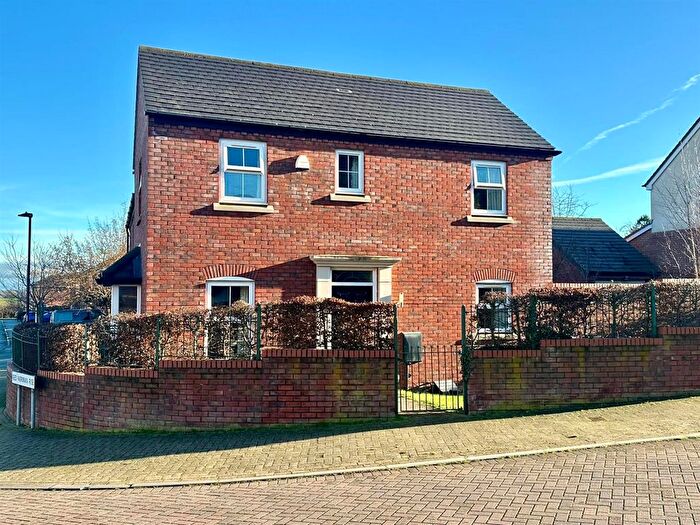
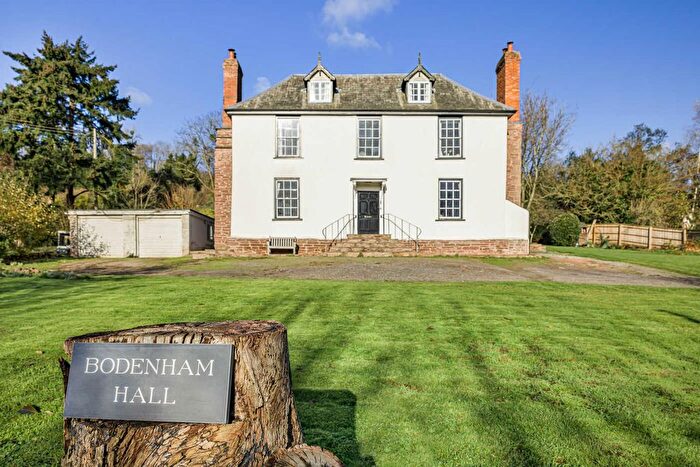
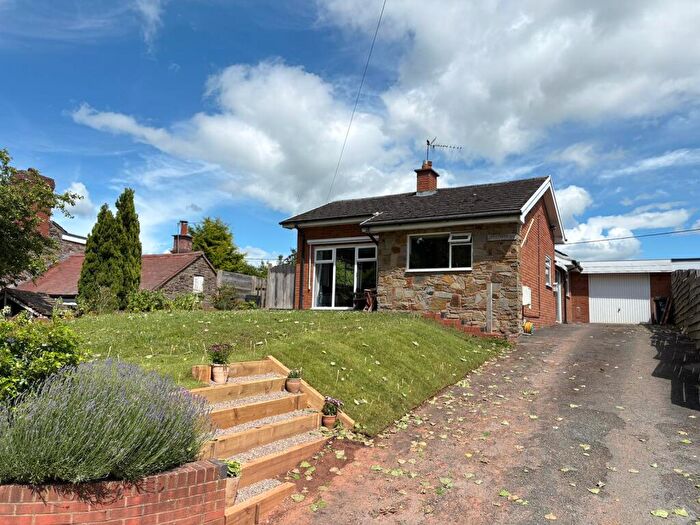
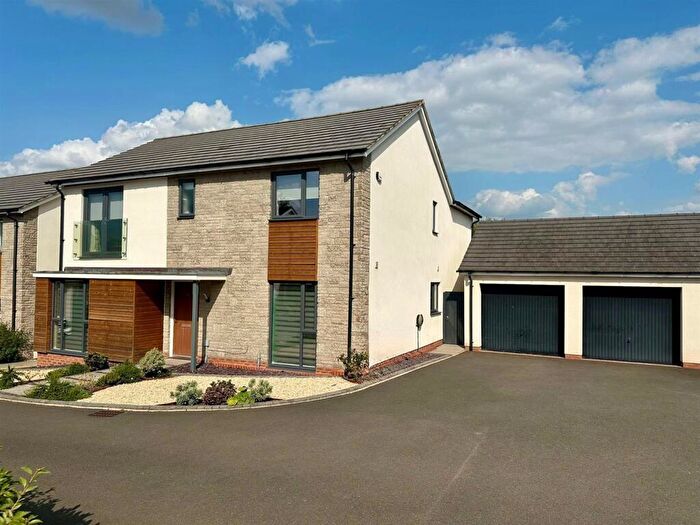
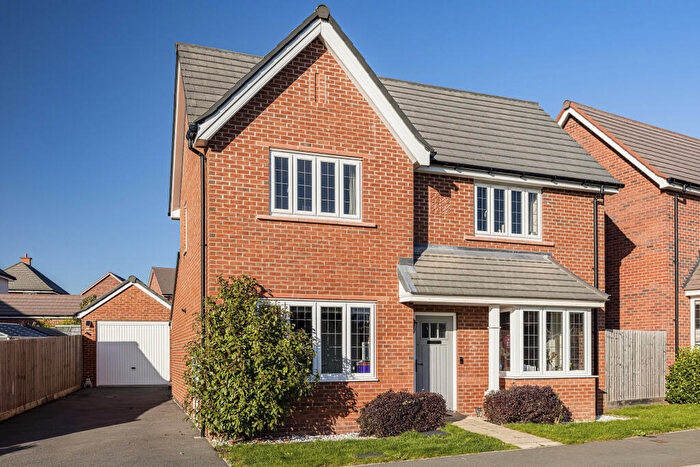
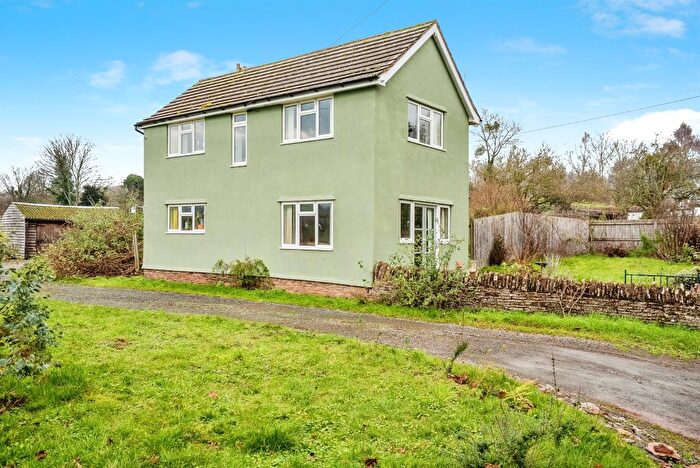
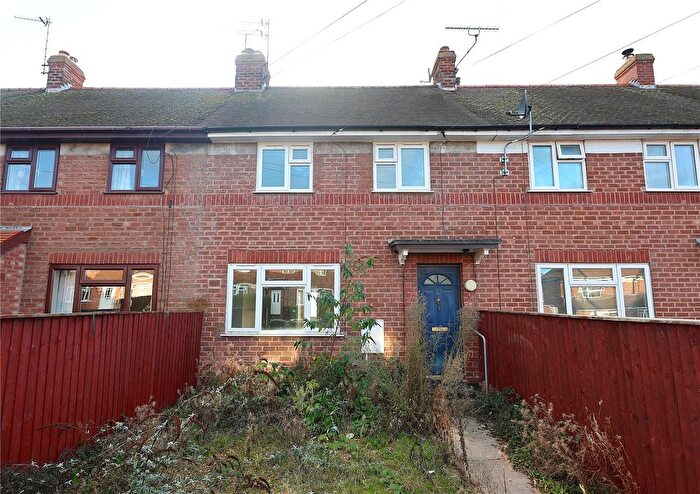
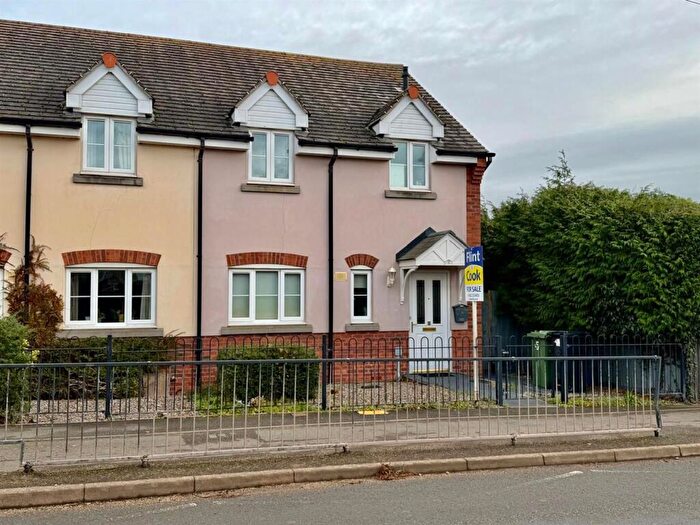
Houses for sale & to rent in Sutton Walls, Hereford
House Prices in Sutton Walls
Properties in Sutton Walls have an average house price of £379,991.00 and had 159 Property Transactions within the last 3 years¹.
Sutton Walls is an area in Hereford, County of Herefordshire with 1,283 households², where the most expensive property was sold for £1,300,000.00.
Properties for sale in Sutton Walls
Roads and Postcodes in Sutton Walls
Navigate through our locations to find the location of your next house in Sutton Walls, Hereford for sale or to rent.
| Streets | Postcodes |
|---|---|
| Ash Close | HR1 3EG |
| Bayley Way | HR1 3SZ |
| Brook Orchard | HR1 3EJ |
| Burmarsh Cottages | HR1 3BW |
| Cedar Close | HR4 8DF |
| Cherry Tree Close | HR4 8DY |
| Churchway | HR1 3BD |
| Fieldway | HR1 3BY |
| Hawkersland Cottages | HR1 3EP |
| Ivy Cottages | HR1 3BG |
| Laystone Bridge | HR1 3FD |
| Laystone Green | HR1 3EE |
| Lingen Field | HR1 3FG |
| Little Paradise | HR1 3DR |
| Lugg View Industrial Estate | HR4 8DP |
| Millway | HR1 3BQ |
| Moreton Business Park | HR4 8DS |
| Nursery Drive | HR4 8DJ |
| Old School Close | HR1 3DJ |
| Orchard Close | HR1 3AU HR4 8DG |
| Orchard Green | HR1 3ED |
| Ordis Cottages | HR1 3AY |
| Ordnance Close | HR4 8DA |
| Paradise Green | HR1 3DW |
| Paradise Meadows | HR1 3FA |
| Rodds Close | HR1 3FF |
| Rudge Grove | HR1 3HD |
| Shelley Place | HR1 3BH |
| Springfield Close | HR1 3EH |
| St Andrews Close | HR4 8DB HR4 8DD |
| St Andrews Walk | HR4 8BZ |
| St Ethelberts Close | HR1 3BF |
| St Peters Close | HR4 8DL HR4 8DN HR4 8DW |
| Station Cottages | HR4 8DH |
| Sutton Lakes | HR1 3NS |
| Sutton Road | HR1 3NL |
| The Craft | HR1 3BZ |
| Tumpy Lakes | HR1 3DG |
| Walkers Green | HR1 3DN HR1 3DP HR1 3DT HR1 3DU HR1 3DY HR1 3DZ HR1 3EA HR1 3EB |
| White House Close | HR1 3DS |
| Willow Bank | HR1 3FJ |
| Willow Bank Drive | HR1 3FH |
| Willow Rise | HR1 3DH |
| Willowcroft Cottages | HR1 3GA |
| Woodbine Close | HR1 3EQ |
| Woodville Grove | HR1 3DL |
| Wyatt Road | HR1 3NP HR1 3NR |
| HR1 3AT HR1 3AX HR1 3AZ HR1 3BA HR1 3BB HR1 3BJ HR1 3BL HR1 3BN HR1 3BS HR1 3BT HR1 3BU HR1 3BX HR1 3DA HR1 3DB HR1 3DD HR1 3DE HR1 3DX HR1 3EL HR1 3EN HR1 3ER HR1 3ES HR1 3ET HR1 3EU HR1 3EW HR1 3EX HR1 3EY HR1 3EZ HR1 3HA HR1 3HB HR4 8DE HR4 8DQ HR1 3BE HR1 3BP HR1 3HH HR4 8DR HR4 8FG HR4 8FN HR4 8FJ |
Transport near Sutton Walls
- FAQ
- Price Paid By Year
- Property Type Price
Frequently asked questions about Sutton Walls
What is the average price for a property for sale in Sutton Walls?
The average price for a property for sale in Sutton Walls is £379,991. This amount is 22% higher than the average price in Hereford. There are 1,489 property listings for sale in Sutton Walls.
What streets have the most expensive properties for sale in Sutton Walls?
The streets with the most expensive properties for sale in Sutton Walls are Ordis Cottages at an average of £654,304, Willow Bank Drive at an average of £573,333 and Paradise Green at an average of £507,000.
What streets have the most affordable properties for sale in Sutton Walls?
The streets with the most affordable properties for sale in Sutton Walls are Ash Close at an average of £153,666, Station Cottages at an average of £157,000 and Springfield Close at an average of £181,000.
Which train stations are available in or near Sutton Walls?
Some of the train stations available in or near Sutton Walls are Hereford, Leominster and Ledbury.
Property Price Paid in Sutton Walls by Year
The average sold property price by year was:
| Year | Average Sold Price | Price Change |
Sold Properties
|
|---|---|---|---|
| 2025 | £347,088 | -11% |
31 Properties |
| 2024 | £384,568 | 4% |
49 Properties |
| 2023 | £371,000 | -10% |
37 Properties |
| 2022 | £406,857 | 18% |
42 Properties |
| 2021 | £334,439 | -4% |
66 Properties |
| 2020 | £346,912 | 13% |
42 Properties |
| 2019 | £301,769 | -11% |
70 Properties |
| 2018 | £334,425 | 24% |
56 Properties |
| 2017 | £255,643 | 14% |
51 Properties |
| 2016 | £219,292 | 7% |
34 Properties |
| 2015 | £203,263 | -19% |
45 Properties |
| 2014 | £241,174 | 16% |
52 Properties |
| 2013 | £202,081 | -24% |
43 Properties |
| 2012 | £250,000 | 17% |
30 Properties |
| 2011 | £208,203 | -11% |
44 Properties |
| 2010 | £231,037 | -8% |
33 Properties |
| 2009 | £250,341 | -10% |
34 Properties |
| 2008 | £274,661 | 4% |
26 Properties |
| 2007 | £264,873 | 23% |
57 Properties |
| 2006 | £203,602 | -2% |
65 Properties |
| 2005 | £207,668 | -1% |
41 Properties |
| 2004 | £209,716 | 14% |
45 Properties |
| 2003 | £179,778 | 20% |
66 Properties |
| 2002 | £144,481 | 8% |
68 Properties |
| 2001 | £132,493 | 14% |
58 Properties |
| 2000 | £113,603 | 20% |
53 Properties |
| 1999 | £90,793 | -4% |
90 Properties |
| 1998 | £94,166 | 13% |
61 Properties |
| 1997 | £81,602 | 10% |
63 Properties |
| 1996 | £73,094 | 15% |
54 Properties |
| 1995 | £62,348 | - |
52 Properties |
Property Price per Property Type in Sutton Walls
Here you can find historic sold price data in order to help with your property search.
The average Property Paid Price for specific property types in the last three years are:
| Property Type | Average Sold Price | Sold Properties |
|---|---|---|
| Semi Detached House | £261,812.00 | 44 Semi Detached Houses |
| Detached House | £460,336.00 | 98 Detached Houses |
| Terraced House | £222,702.00 | 17 Terraced Houses |

