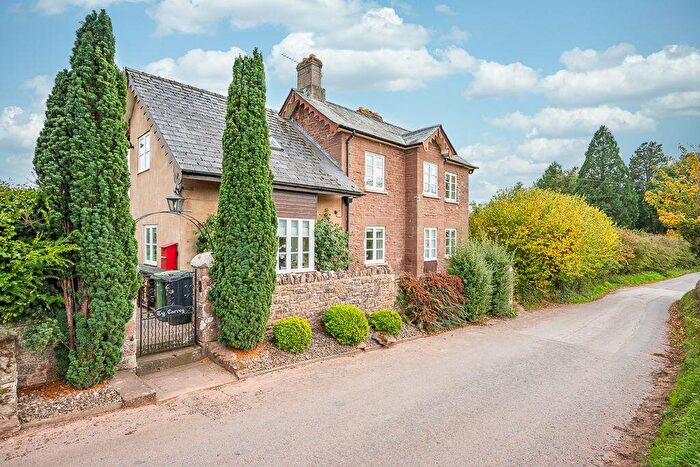
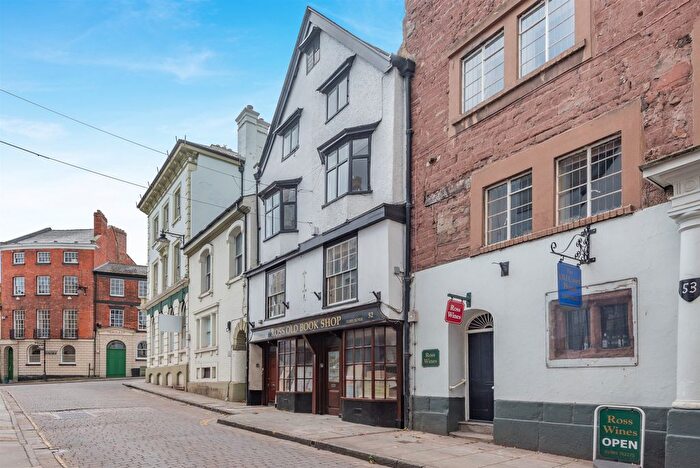
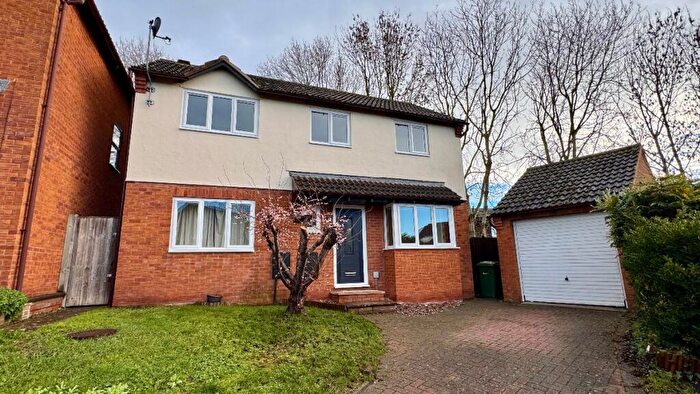
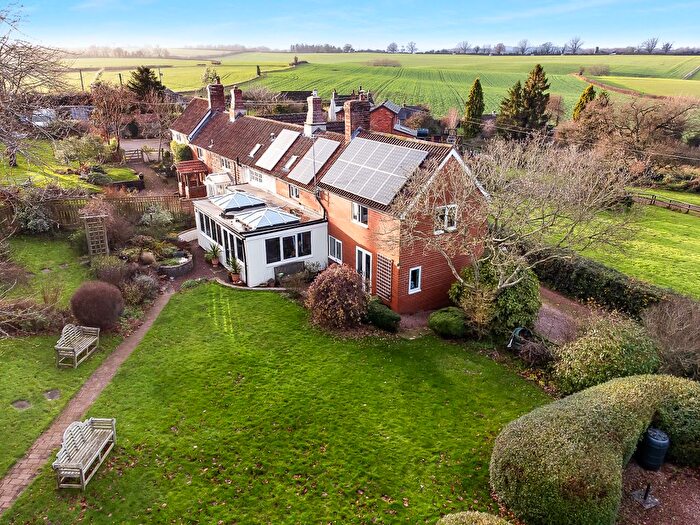
Houses for sale & to rent in Llangarron, Ross-on-wye
House Prices in Llangarron
Properties in Llangarron have an average house price of £483,798.00 and had 132 Property Transactions within the last 3 years¹.
Llangarron is an area in Ross-on-wye, County of Herefordshire with 1,175 households², where the most expensive property was sold for £1,625,000.00.
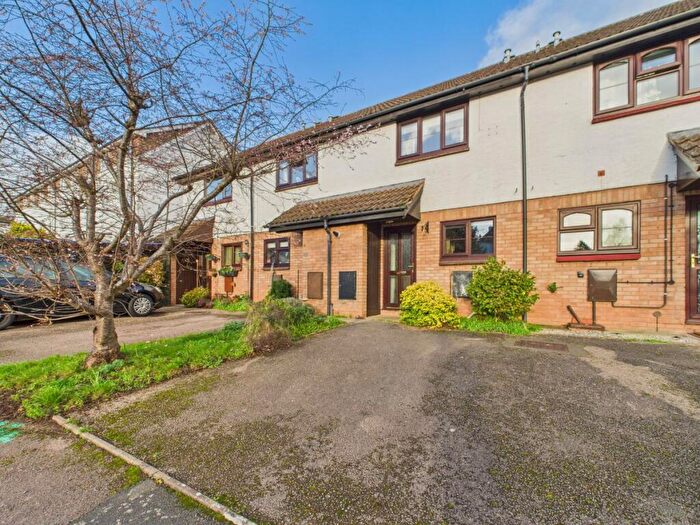
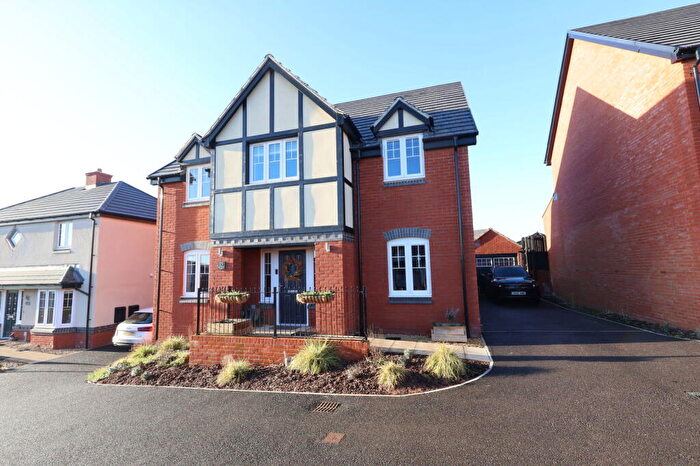
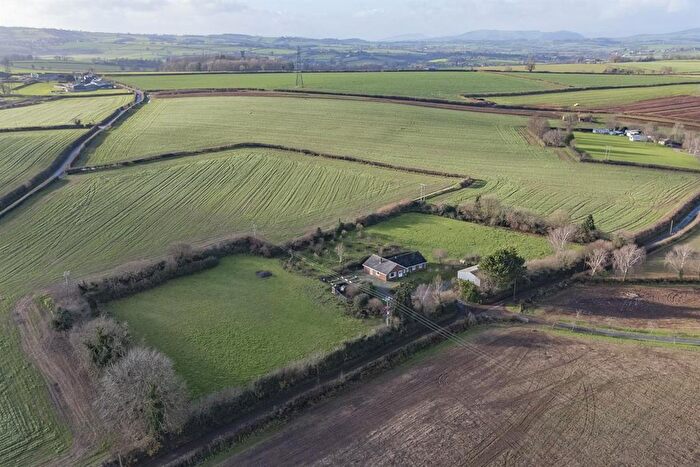
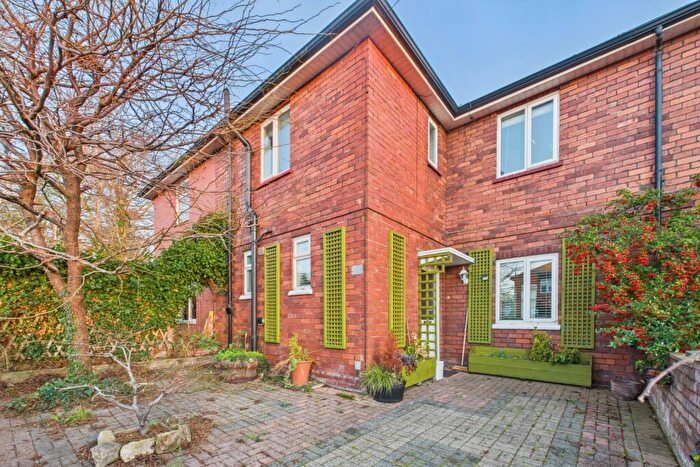
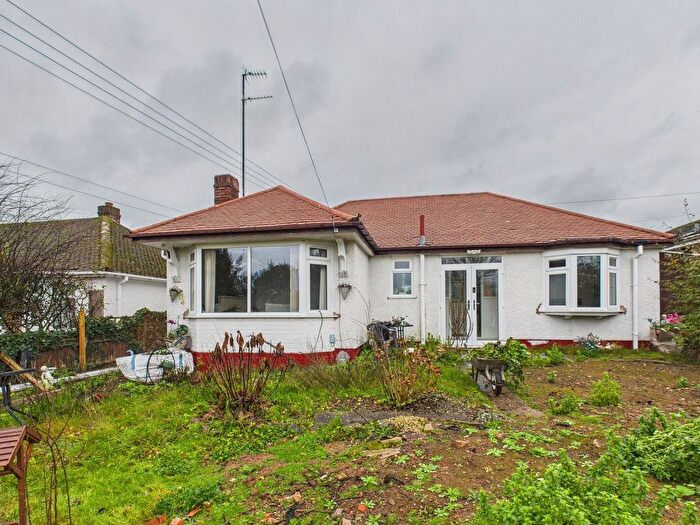
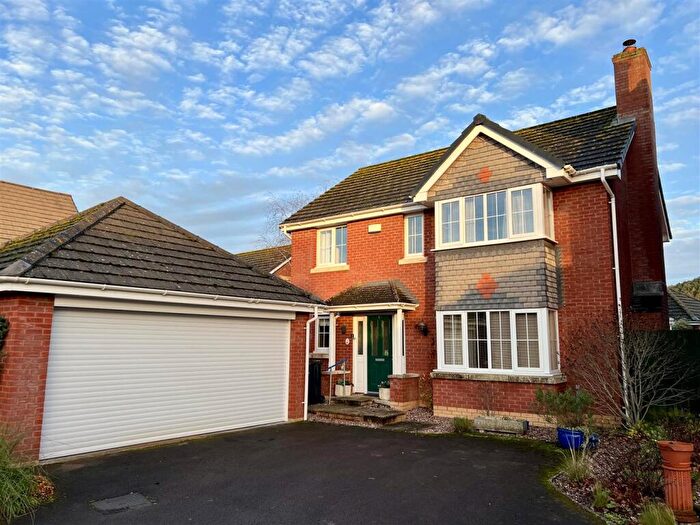
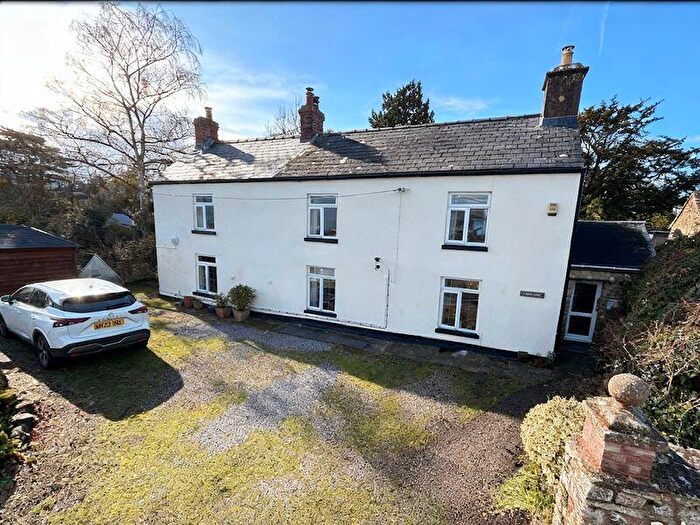
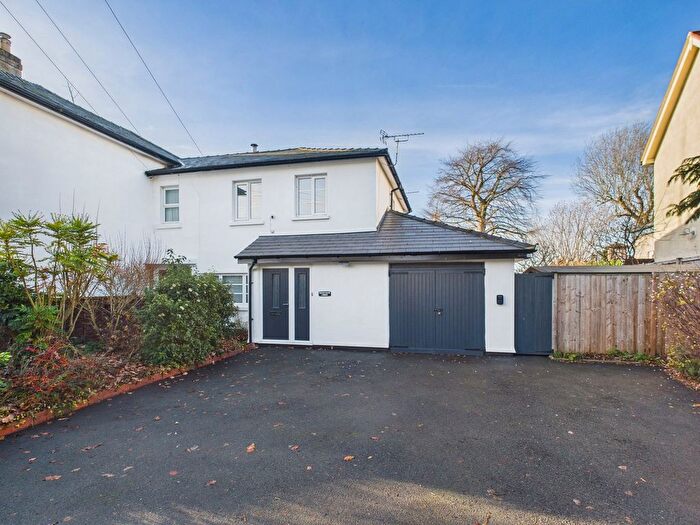
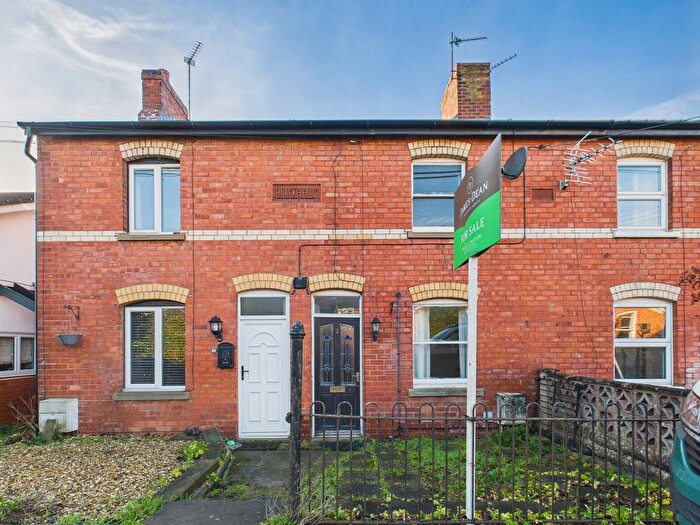
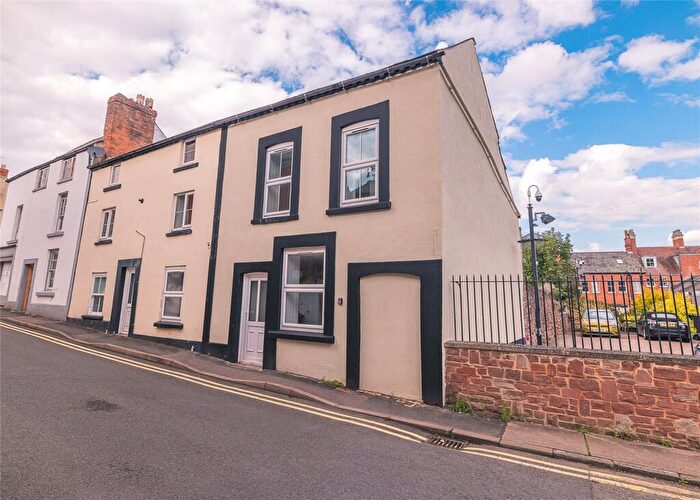
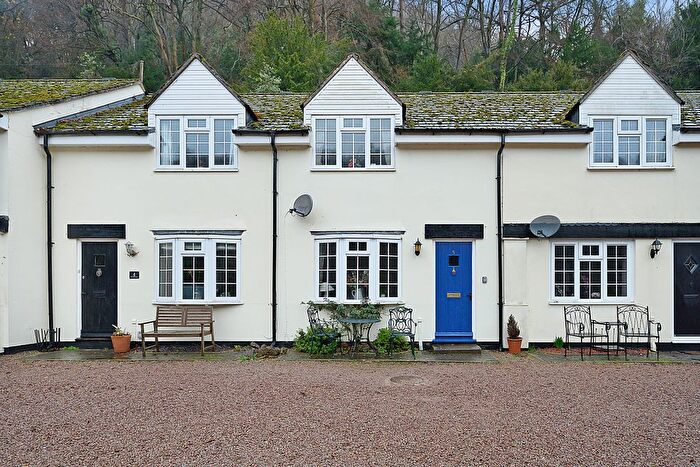
Properties for sale in Llangarron
Roads and Postcodes in Llangarron
Navigate through our locations to find the location of your next house in Llangarron, Ross-on-wye for sale or to rent.
Transport near Llangarron
- FAQ
- Price Paid By Year
- Property Type Price
Frequently asked questions about Llangarron
What is the average price for a property for sale in Llangarron?
The average price for a property for sale in Llangarron is £483,798. This amount is 29% higher than the average price in Ross-on-wye. There are 2,413 property listings for sale in Llangarron.
What streets have the most expensive properties for sale in Llangarron?
The streets with the most expensive properties for sale in Llangarron are Grove Common at an average of £650,000, Llangrove at an average of £600,622 and Green Court at an average of £580,000.
What streets have the most affordable properties for sale in Llangarron?
The streets with the most affordable properties for sale in Llangarron are Malmo Place at an average of £183,833, Old High Town at an average of £223,333 and The Claytons at an average of £254,583.
Which train stations are available in or near Llangarron?
Some of the train stations available in or near Llangarron are Hereford, Ledbury and Lydney.
Property Price Paid in Llangarron by Year
The average sold property price by year was:
| Year | Average Sold Price | Price Change |
Sold Properties
|
|---|---|---|---|
| 2025 | £437,386 | -16% |
18 Properties |
| 2024 | £505,737 | 8% |
46 Properties |
| 2023 | £463,654 | -8% |
34 Properties |
| 2022 | £498,831 | 4% |
34 Properties |
| 2021 | £479,728 | 6% |
73 Properties |
| 2020 | £448,735 | 14% |
44 Properties |
| 2019 | £387,027 | 12% |
37 Properties |
| 2018 | £340,144 | -4% |
50 Properties |
| 2017 | £352,197 | 17% |
55 Properties |
| 2016 | £292,962 | -3% |
49 Properties |
| 2015 | £300,802 | 0,1% |
47 Properties |
| 2014 | £300,597 | 7% |
43 Properties |
| 2013 | £280,800 | -5% |
20 Properties |
| 2012 | £294,328 | -11% |
38 Properties |
| 2011 | £327,624 | 8% |
28 Properties |
| 2010 | £299,829 | 17% |
27 Properties |
| 2009 | £250,152 | -27% |
23 Properties |
| 2008 | £317,787 | -1% |
33 Properties |
| 2007 | £321,620 | - |
41 Properties |
| 2006 | £321,694 | 12% |
64 Properties |
| 2005 | £284,255 | 0,5% |
38 Properties |
| 2004 | £282,948 | 18% |
51 Properties |
| 2003 | £231,091 | 8% |
46 Properties |
| 2002 | £212,164 | 12% |
55 Properties |
| 2001 | £187,142 | 6% |
49 Properties |
| 2000 | £175,458 | 15% |
47 Properties |
| 1999 | £148,588 | 20% |
57 Properties |
| 1998 | £119,357 | -9% |
49 Properties |
| 1997 | £130,488 | 33% |
43 Properties |
| 1996 | £87,388 | -15% |
45 Properties |
| 1995 | £100,869 | - |
42 Properties |
Property Price per Property Type in Llangarron
Here you can find historic sold price data in order to help with your property search.
The average Property Paid Price for specific property types in the last three years are:
| Property Type | Average Sold Price | Sold Properties |
|---|---|---|
| Semi Detached House | £350,174.00 | 31 Semi Detached Houses |
| Detached House | £574,305.00 | 85 Detached Houses |
| Terraced House | £270,889.00 | 14 Terraced Houses |
| Flat | £198,750.00 | 2 Flats |

