Houses for sale & to rent in Ross-on-wye West, Ross-on-wye
House Prices in Ross-on-wye West
Properties in Ross-on-wye West have an average house price of £275,774.00 and had 281 Property Transactions within the last 3 years¹.
Ross-on-wye West is an area in Ross-on-wye, County of Herefordshire with 2,386 households², where the most expensive property was sold for £965,000.00.
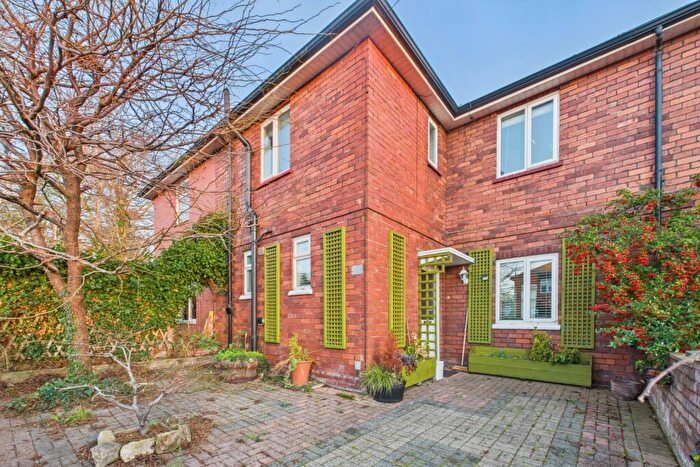
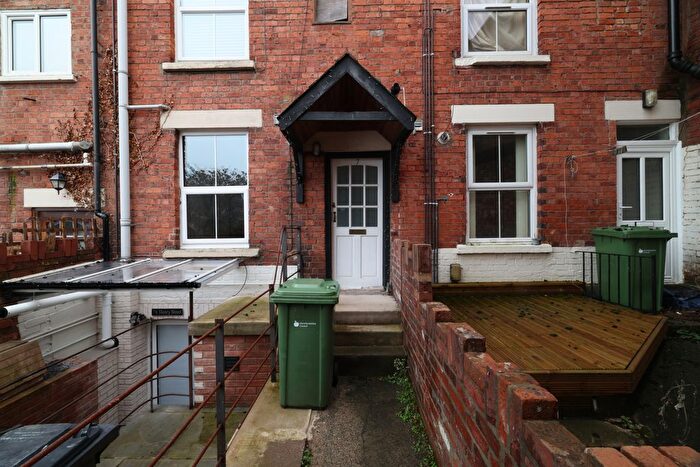
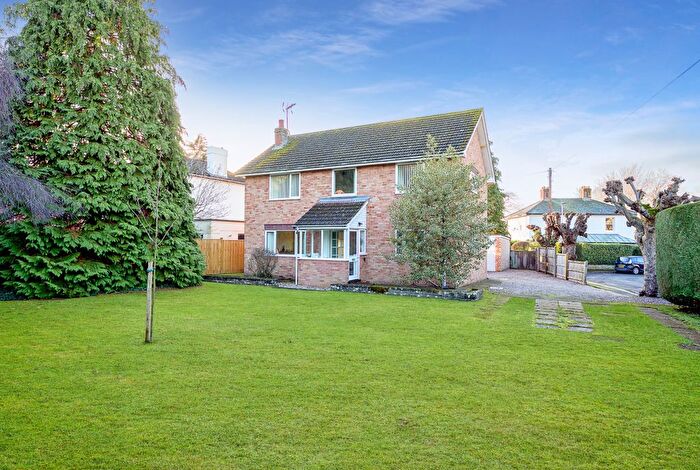
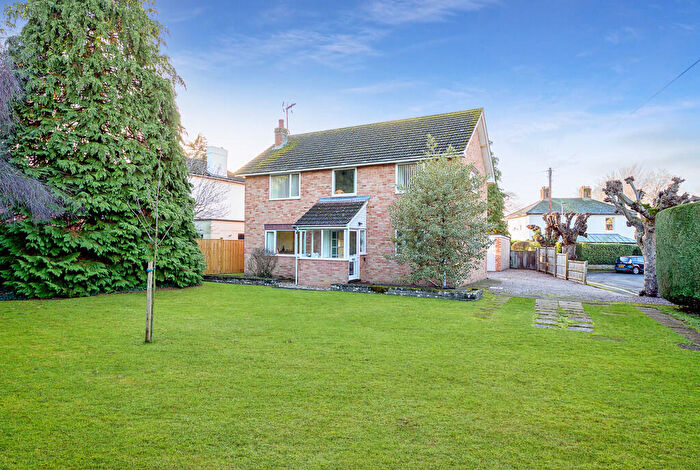
Properties for sale in Ross-on-wye West
Roads and Postcodes in Ross-on-wye West
Navigate through our locations to find the location of your next house in Ross-on-wye West, Ross-on-wye for sale or to rent.
| Streets | Postcodes |
|---|---|
| Abbotts Close | HR9 7GQ |
| Archenfield Court | HR9 5XB |
| Archenfield Road | HR9 5AY HR9 5AZ HR9 5BA HR9 5BB HR9 7TA |
| Ashfield Crescent | HR9 5PH |
| Ashfield Park Avenue | HR9 5AX |
| Ashfield Park Road | HR9 5AS |
| Backney View | HR9 7JP |
| Bakers Oak | HR9 5RP |
| Beech Close | HR9 5RN |
| Bell Place | HR9 7GA |
| Berryfield Place | HR9 7ER |
| Blackthorn Close | HR9 7JT |
| Bluebell Close | HR9 7XX |
| Brampton Avenue | HR9 7EW |
| Brampton Close | HR9 7EP |
| Brampton Road | HR9 7DP HR9 7EH HR9 7HY |
| Brampton Street | HR9 7EQ HR9 7FS |
| Brixton Terrace | HR9 7DF |
| Broad Street | HR9 7DZ HR9 7EA HR9 7ED |
| Broadleaves | HR9 7UY |
| Brookend Street | HR9 7EG |
| Brookfield Avenue | HR9 7EN |
| Brookfield Road | HR9 7AY HR9 7EL |
| Castle Meadow | HR9 5BJ |
| Cawdor | HR9 7DL |
| Cawdor Hill | HR9 7DN |
| Chase View Road | HR9 5BQ |
| Church Close | HR9 5HS |
| Church Street | HR9 5HN |
| Cleeve Lane | HR9 7TB |
| Conde Close | HR9 5UR |
| Corinium Road | HR9 5UQ |
| Danum Road | HR9 5UG |
| Duxmere Drive | HR9 5UN HR9 5UP HR9 5UW |
| Edde Cross Street | HR9 7BZ HR9 7FY |
| Falaise Close | HR9 5UT |
| Fifth Avenue | HR9 7HP |
| Firs Road | HR9 5BH |
| Firsmead | HR9 7SZ |
| First Avenue | HR9 7HX |
| Fonteine Court | HR9 7JU |
| Fourth Avenue | HR9 7HR |
| Foxglove Close | HR9 7RH |
| Glevum Close | HR9 5UJ |
| Goodrich Close | HR9 5UX |
| Greytree Road | HR9 7DQ |
| Hawthorne Lane | HR9 5BG |
| High Street | HR9 5BZ HR9 5HD HR9 5HH HR9 5HL |
| Hill View Road | HR9 7EY |
| Homs Road | HR9 7DG |
| Honeysuckle Close | HR9 7RJ |
| Isca Close | HR9 5UH |
| Juniper Place | HR9 5UE |
| Kings Head Mews | HR9 5HF |
| Kyrle Street | HR9 7DB |
| Laburnum Close | HR9 5UB |
| Lincoln Close | HR9 5TZ |
| Mayhill Road | HR9 7EU |
| Middleton Avenue | HR9 5BD |
| Morley Square | HR9 7XA |
| Mount Pleasant | HR9 7AZ |
| Myrtle Villas | HR9 5PN |
| New Street | HR9 7DA |
| Nursery Road | HR9 7DH |
| Oak Road | HR9 7BB |
| Oaklands | HR9 7HE |
| Oaklands Court | HR9 7HD |
| Old Maids Walk | HR9 5HB |
| Orchid Close | HR9 7RL |
| Over Ross Street | HR9 7AS HR9 7AU |
| Owens Lane | HR9 7GH |
| Palmerston Road | HR9 5PJ HR9 5QL |
| Pencraig View | HR9 7JR |
| Primrose Close | HR9 7RN |
| Prospect Terrace | HR9 7DE |
| Quarry Close | HR9 7DR |
| Redhill Road | HR9 5AU |
| Redwood Close | HR9 5UD |
| River View | HR9 7DS |
| Roman Way | HR9 5RL HR9 5UY |
| Rope Walk | HR9 7BU |
| Rowan Close | HR9 5RW |
| Royal Parade | HR9 5HY |
| Second Avenue | HR9 7HT |
| Silver Birches | HR9 7UX |
| Sixth Avenue | HR9 7HJ HR9 7HL HR9 7HW |
| Sixth Avenue Close | HR9 7HN |
| Springfield Road | HR9 7EX |
| Sycamore Close | HR9 5UA |
| The Roslins | HR9 5XA |
| The Shrubbery | HR9 5BE |
| Third Avenue | HR9 7HS |
| Three Crosses Close | HR9 7EZ |
| Three Crosses Road | HR9 7HA HR9 7HB |
| Tintern Close | HR9 5UU |
| Vaga Crescent | HR9 7RQ |
| Vectis Close | HR9 5UL |
| Verschoyle Gardens | HR9 7HH HR9 7HQ |
| Walford Road | HR9 5PG HR9 5PQ |
| Wall House Road | HR9 7ES |
| Watling Street | HR9 5UF |
| Willow Brook | HR9 7JS |
| Wilton Road | HR9 5JA |
| Wye Street | HR9 7BS HR9 7BT HR9 7BX |
| HR9 7HU |
Transport near Ross-on-wye West
- FAQ
- Price Paid By Year
- Property Type Price
Frequently asked questions about Ross-on-wye West
What is the average price for a property for sale in Ross-on-wye West?
The average price for a property for sale in Ross-on-wye West is £275,774. This amount is 26% lower than the average price in Ross-on-wye. There are 1,009 property listings for sale in Ross-on-wye West.
What streets have the most expensive properties for sale in Ross-on-wye West?
The streets with the most expensive properties for sale in Ross-on-wye West are Castle Meadow at an average of £795,000, Firs Road at an average of £505,000 and Silver Birches at an average of £491,333.
What streets have the most affordable properties for sale in Ross-on-wye West?
The streets with the most affordable properties for sale in Ross-on-wye West are Greytree Road at an average of £73,041, Fonteine Court at an average of £73,493 and Bluebell Close at an average of £94,250.
Which train stations are available in or near Ross-on-wye West?
Some of the train stations available in or near Ross-on-wye West are Ledbury, Hereford and Lydney.
Property Price Paid in Ross-on-wye West by Year
The average sold property price by year was:
| Year | Average Sold Price | Price Change |
Sold Properties
|
|---|---|---|---|
| 2025 | £274,775 | 9% |
41 Properties |
| 2024 | £250,933 | -13% |
76 Properties |
| 2023 | £283,816 | -2% |
69 Properties |
| 2022 | £290,238 | 13% |
95 Properties |
| 2021 | £253,809 | 10% |
119 Properties |
| 2020 | £229,300 | 14% |
76 Properties |
| 2019 | £197,596 | 1% |
93 Properties |
| 2018 | £194,730 | 0,5% |
99 Properties |
| 2017 | £193,806 | -4% |
124 Properties |
| 2016 | £201,232 | 5% |
118 Properties |
| 2015 | £191,691 | 5% |
106 Properties |
| 2014 | £181,196 | 6% |
112 Properties |
| 2013 | £170,192 | -3% |
89 Properties |
| 2012 | £175,337 | 2% |
87 Properties |
| 2011 | £170,989 | -4% |
74 Properties |
| 2010 | £178,258 | 2% |
68 Properties |
| 2009 | £174,431 | -19% |
82 Properties |
| 2008 | £208,081 | 13% |
61 Properties |
| 2007 | £182,066 | -1% |
140 Properties |
| 2006 | £184,199 | 9% |
135 Properties |
| 2005 | £168,147 | 9% |
127 Properties |
| 2004 | £153,749 | 12% |
152 Properties |
| 2003 | £135,750 | 17% |
126 Properties |
| 2002 | £112,099 | 20% |
163 Properties |
| 2001 | £90,012 | 11% |
147 Properties |
| 2000 | £80,522 | 6% |
132 Properties |
| 1999 | £75,886 | 8% |
170 Properties |
| 1998 | £69,509 | 1% |
121 Properties |
| 1997 | £69,140 | 17% |
114 Properties |
| 1996 | £57,686 | - |
115 Properties |
| 1995 | £57,688 | - |
87 Properties |
Property Price per Property Type in Ross-on-wye West
Here you can find historic sold price data in order to help with your property search.
The average Property Paid Price for specific property types in the last three years are:
| Property Type | Average Sold Price | Sold Properties |
|---|---|---|
| Semi Detached House | £296,398.00 | 63 Semi Detached Houses |
| Detached House | £381,669.00 | 108 Detached Houses |
| Terraced House | £214,230.00 | 52 Terraced Houses |
| Flat | £111,367.00 | 58 Flats |

