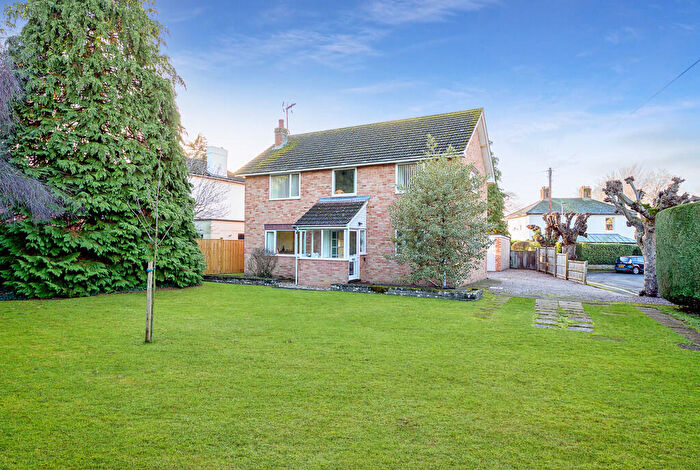
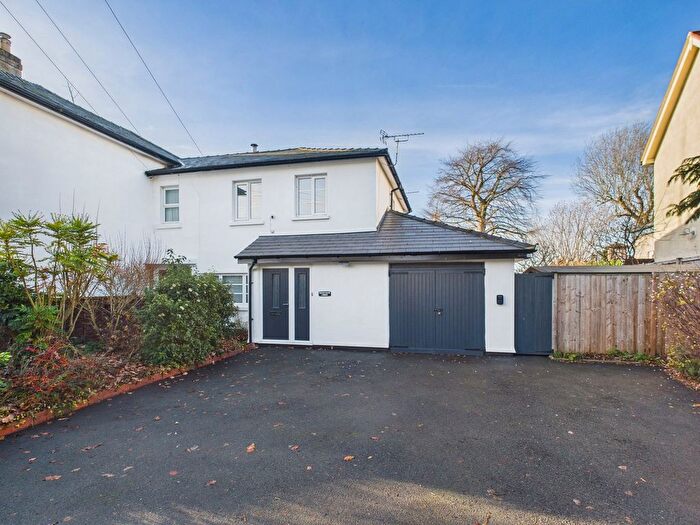
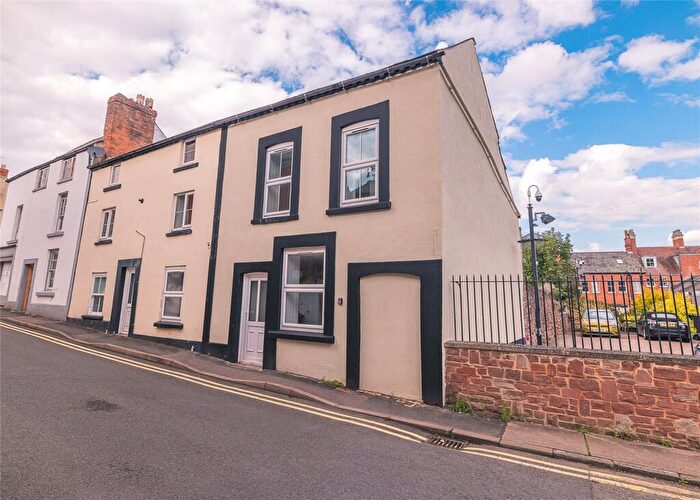
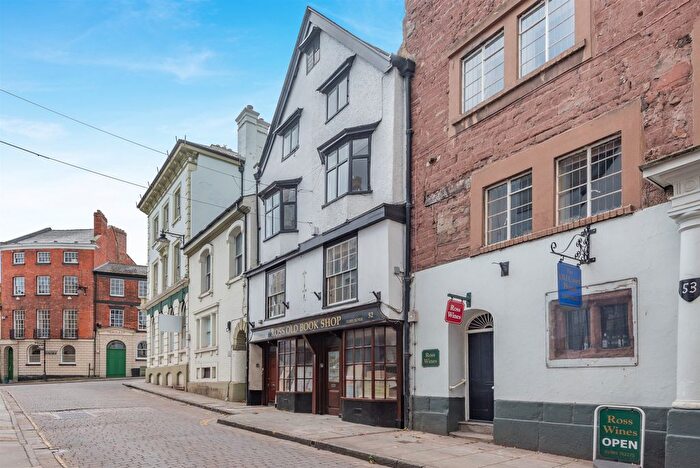
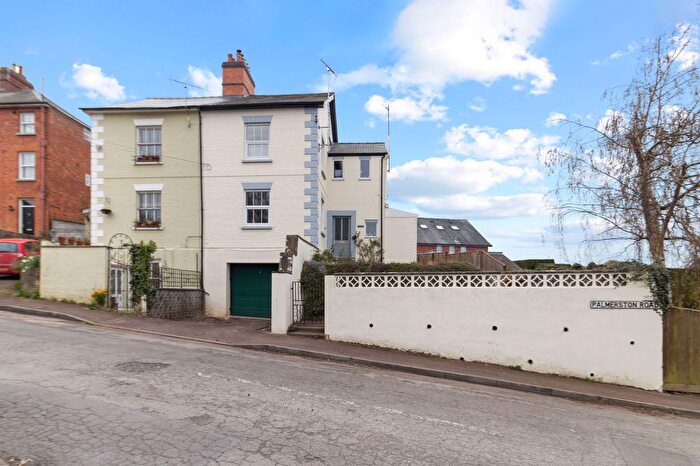
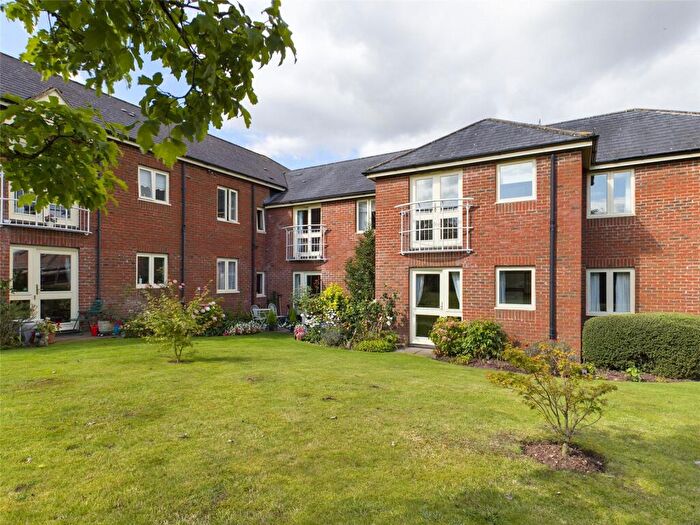
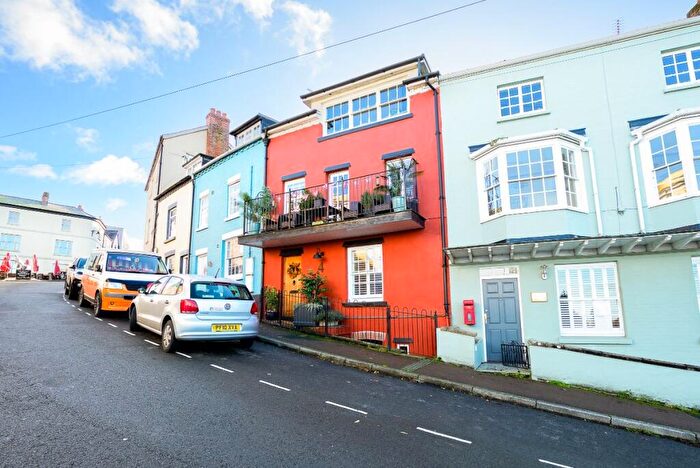
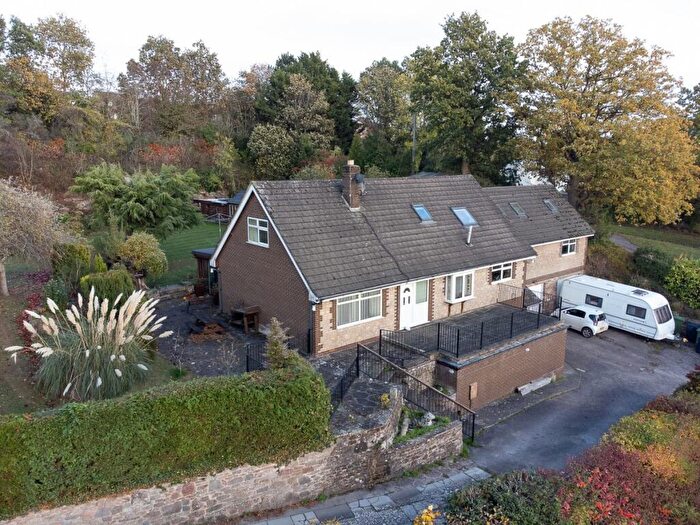
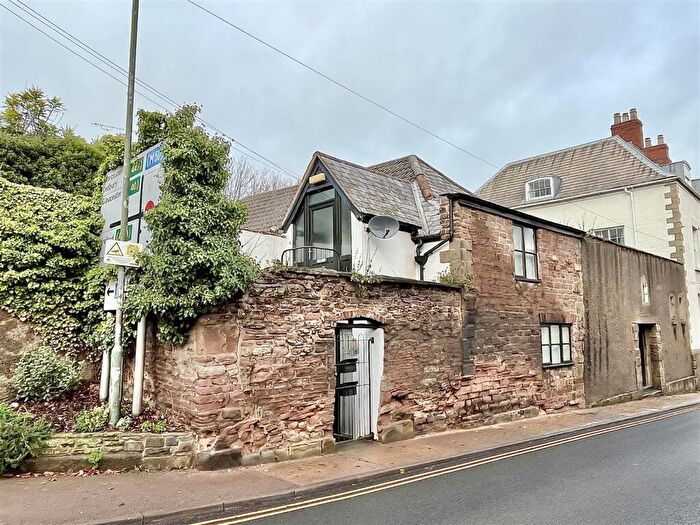
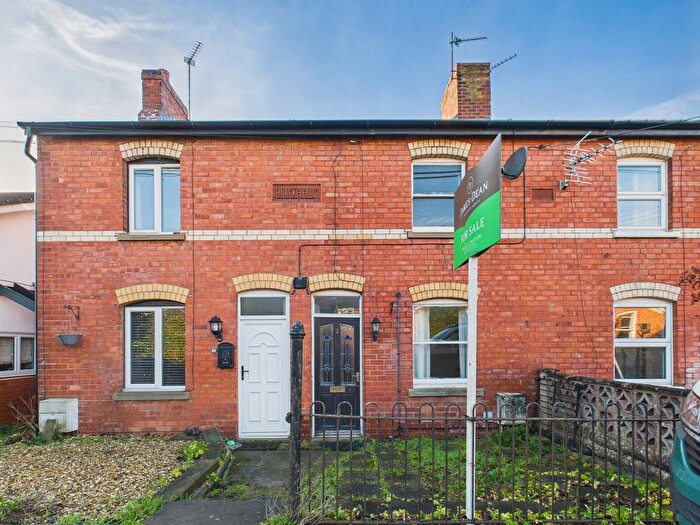
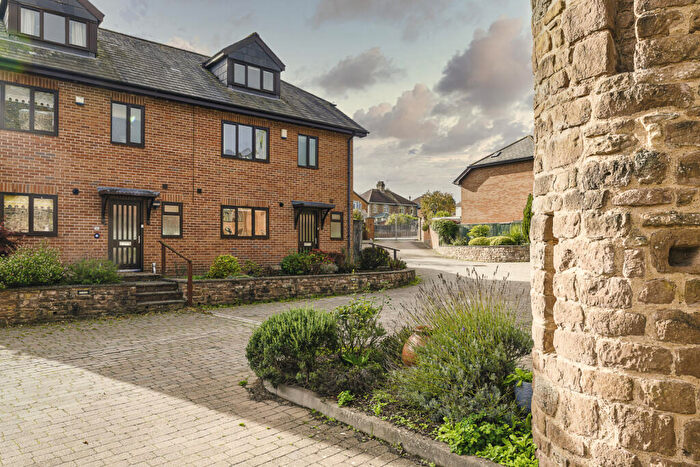
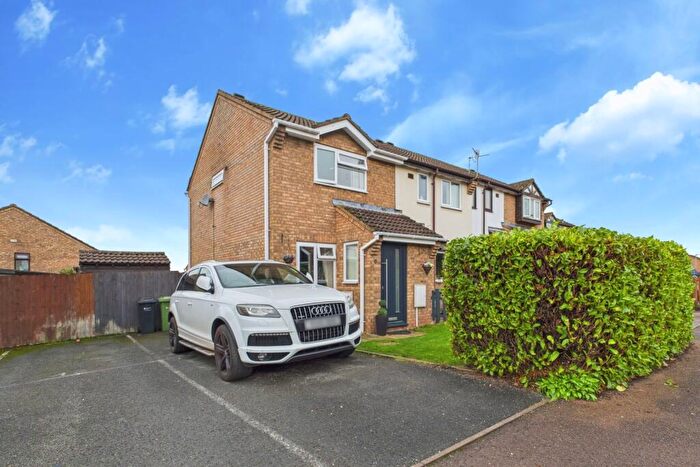
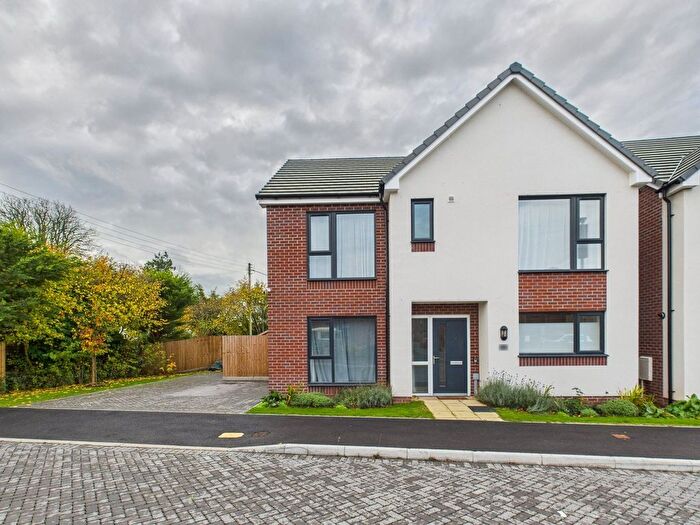
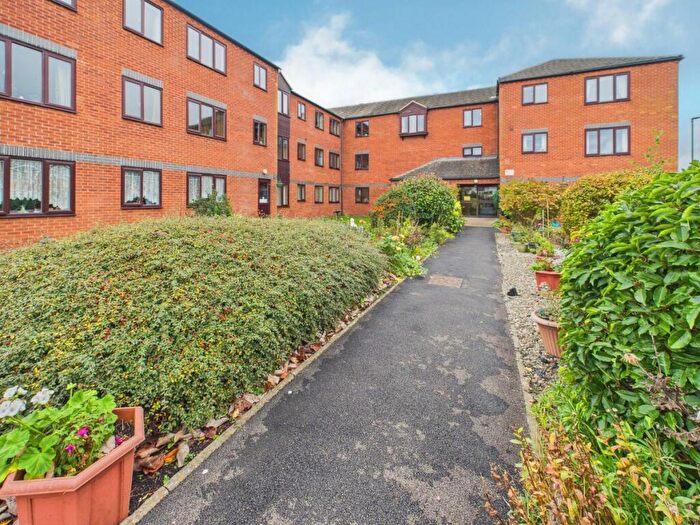
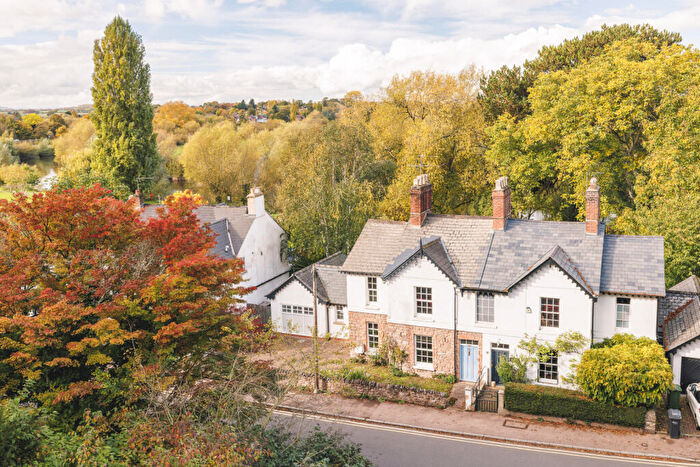
Houses for sale & to rent in Ross West, Ross-on-wye
House Prices in Ross West
Properties in Ross West have an average house price of £187,000.00 and had 3 Property Transactions within the last 3 years¹.
Ross West is an area in Ross-on-wye, County of Herefordshire with 149 households², where the most expensive property was sold for £255,000.00.
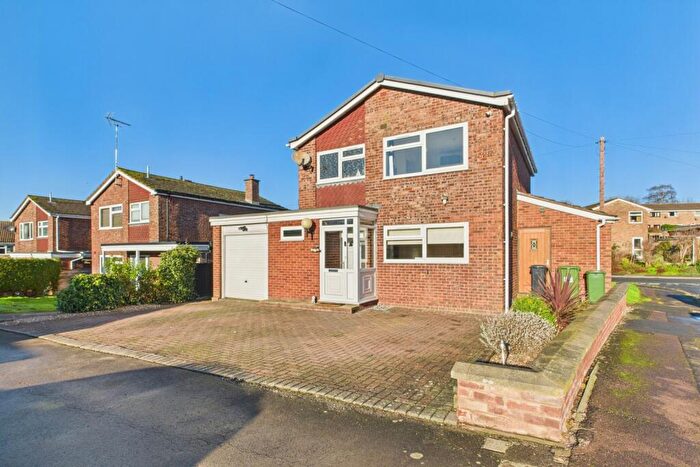
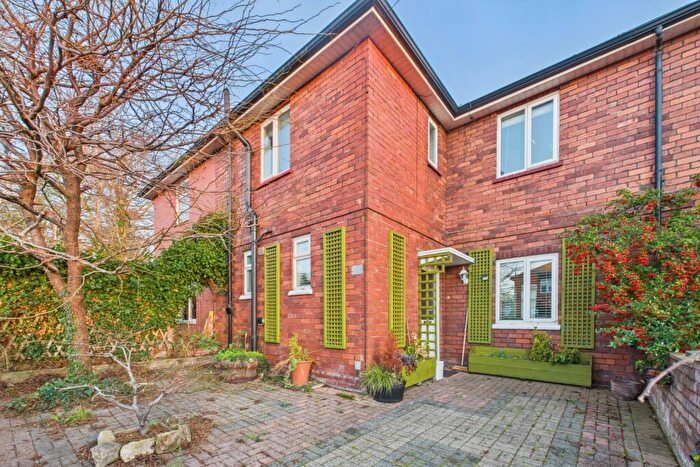
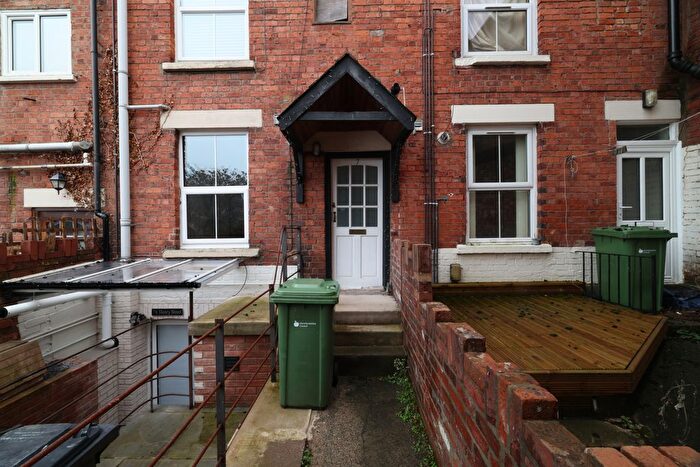
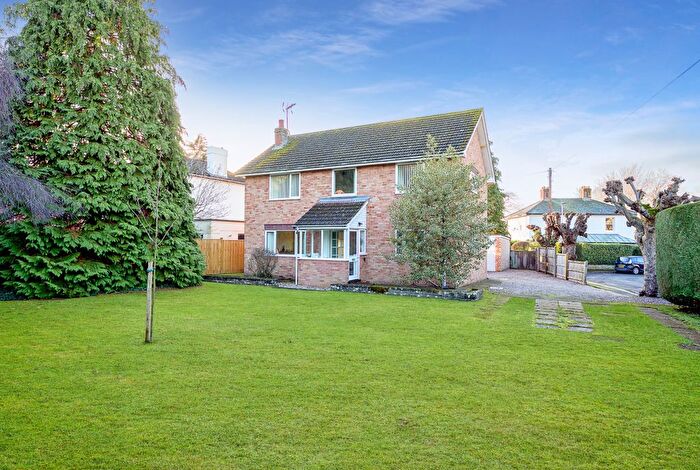
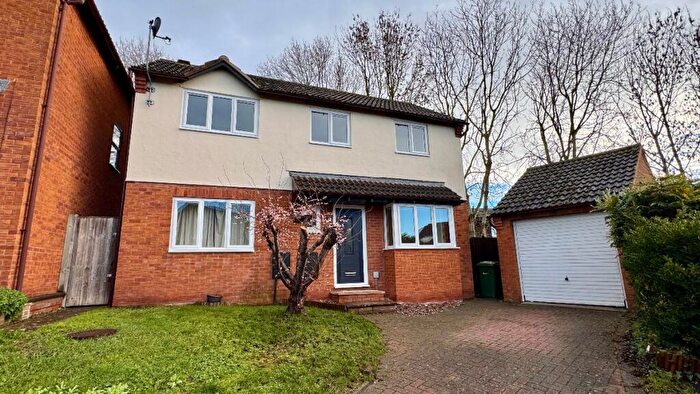
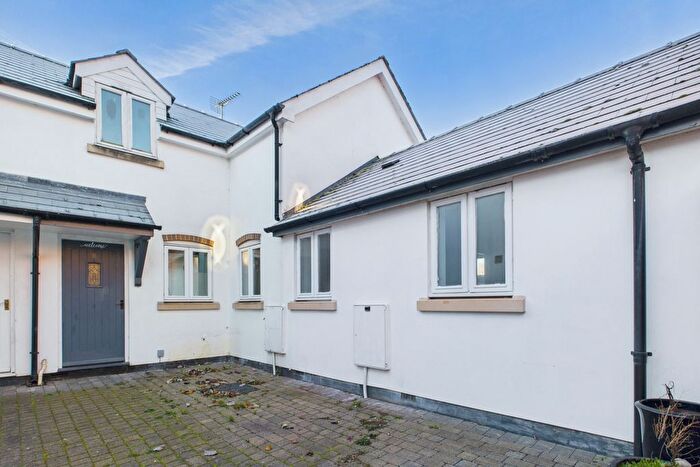
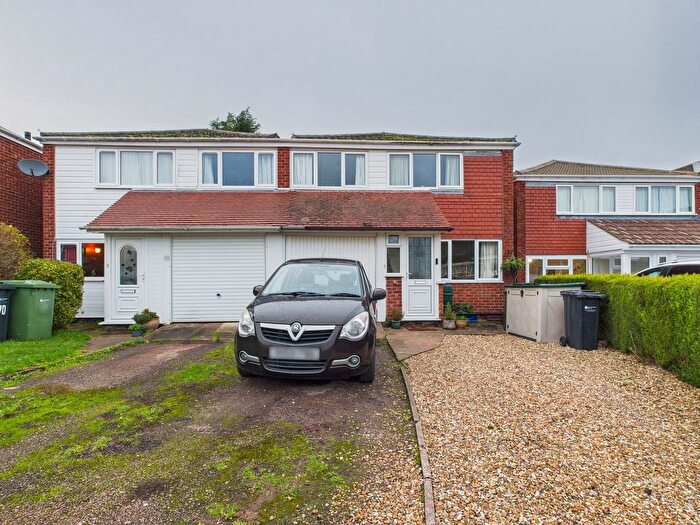
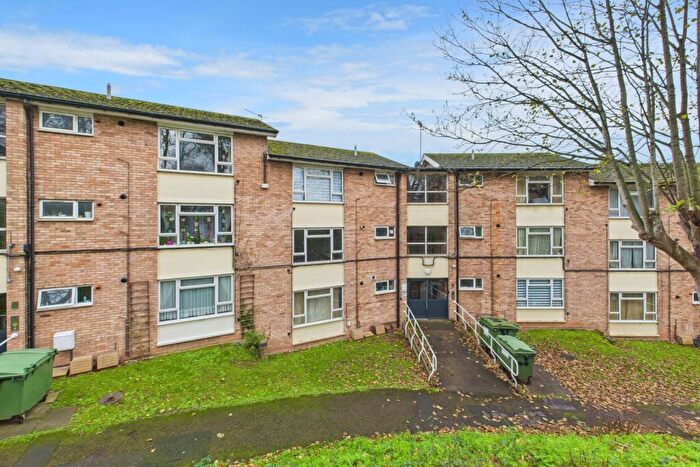
Properties for sale in Ross West
Roads and Postcodes in Ross West
Navigate through our locations to find the location of your next house in Ross West, Ross-on-wye for sale or to rent.
| Streets | Postcodes |
|---|---|
| Bernard Hackett Court | HR9 5YU |
| Cawdor Arch Road | HR9 7DJ |
| Church Row | HR9 5HP HR9 5HR |
| Copse Cross Street | HR9 5PE HR9 5PL |
| High Street | HR9 5HE HR9 5HG HR9 5HJ |
| Kyrle Place | HR9 7RW |
| Lucas Walk | HR9 7FE |
| Market Place | HR9 5NX |
| Merrick Place | HR9 7YA |
| Metcalfe Close | HR9 7DD |
| Old Bakery Close | HR9 5BT |
| Old Market Close | HR9 7QB |
| Royal Parade | HR9 5HZ |
| St Marys Street | HR9 5HT HR9 5HX |
| Walford Road | HR9 5AP HR9 5AR |
| William Gilpin Place | HR9 7GB |
| Wye Street | HR9 7BY |
Transport near Ross West
- FAQ
- Price Paid By Year
- Property Type Price
Frequently asked questions about Ross West
What is the average price for a property for sale in Ross West?
The average price for a property for sale in Ross West is £187,000. This amount is 50% lower than the average price in Ross-on-wye. There are 1,001 property listings for sale in Ross West.
Which train stations are available in or near Ross West?
Some of the train stations available in or near Ross West are Ledbury, Hereford and Lydney.
Property Price Paid in Ross West by Year
The average sold property price by year was:
| Year | Average Sold Price | Price Change |
Sold Properties
|
|---|---|---|---|
| 2025 | £163,000 | -22% |
1 Property |
| 2023 | £199,000 | 49% |
2 Properties |
| 2018 | £101,666 | 10% |
3 Properties |
| 2017 | £92,000 | -1% |
1 Property |
| 2016 | £93,160 | -168% |
5 Properties |
| 2011 | £250,000 | 76% |
1 Property |
| 2000 | £60,000 | - |
1 Property |
Property Price per Property Type in Ross West
Here you can find historic sold price data in order to help with your property search.
The average Property Paid Price for specific property types in the last three years are:
| Property Type | Average Sold Price | Sold Properties |
|---|---|---|
| Flat | £153,000.00 | 2 Flats |
| Terraced House | £255,000.00 | 1 Terraced House |

