
Houses for sale & to rent in CV2 3RA, Hypericum Gardens, Lower Stoke, Coventry
House Prices in CV2 3RA, Hypericum Gardens, Lower Stoke
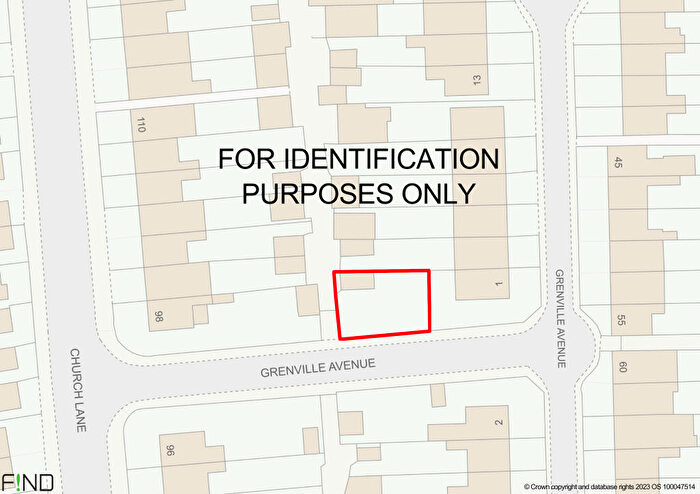
Properties in CV2 3RA have no sales history available within the last 3 years. CV2 3RA is a postcode in Hypericum Gardens located in Lower Stoke, an area in Coventry, Coventry, with 3 households².
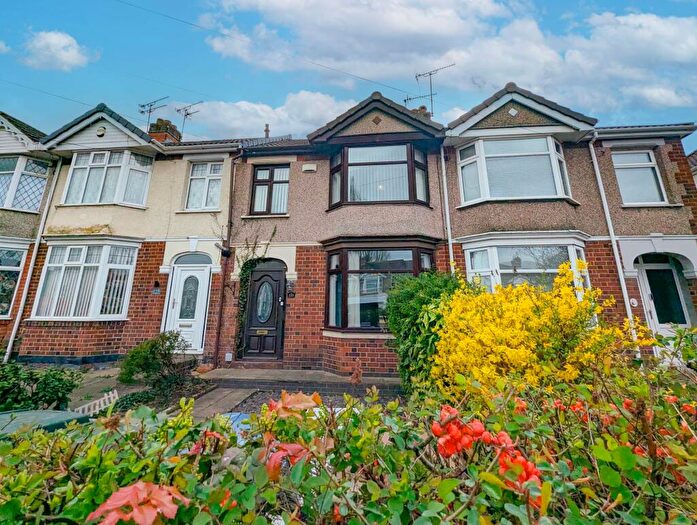
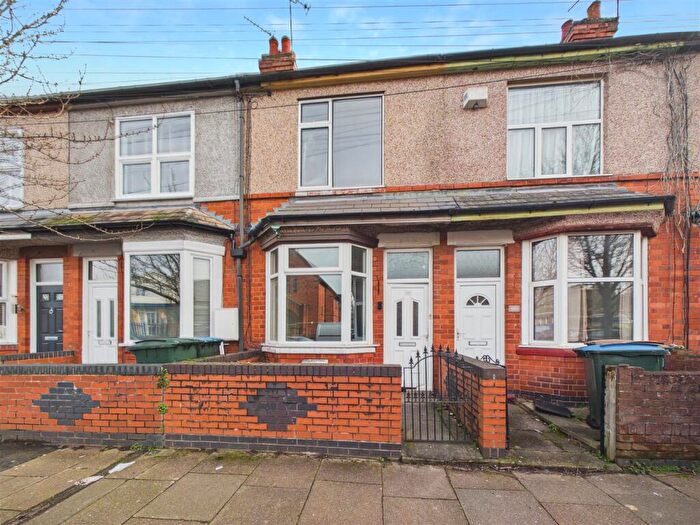
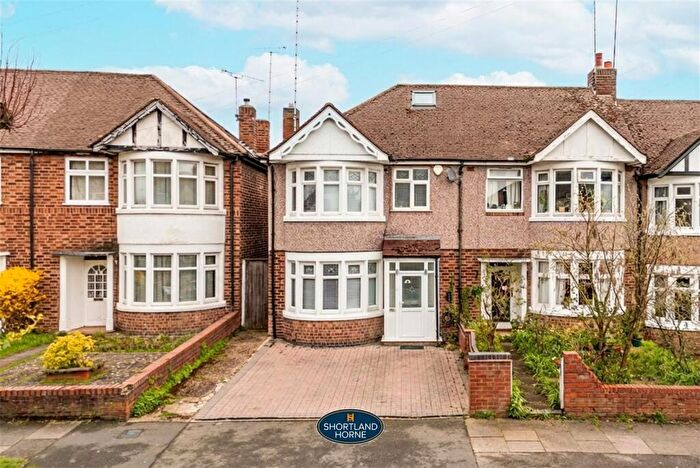
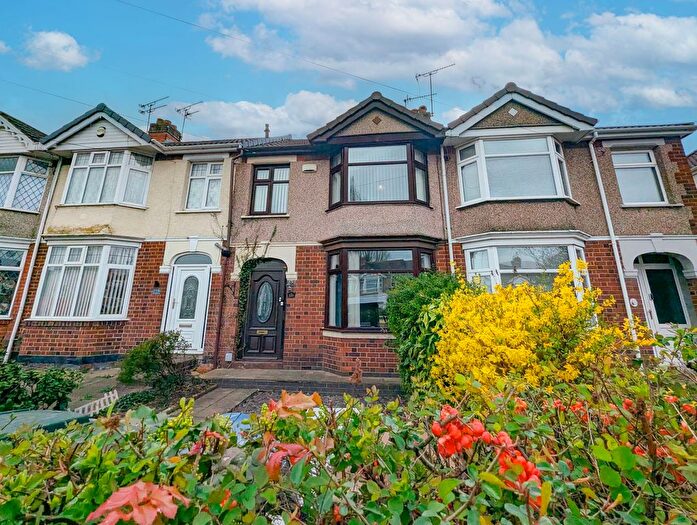
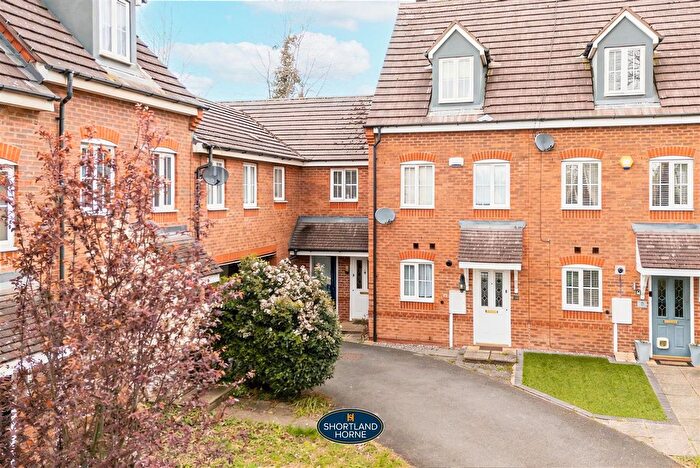
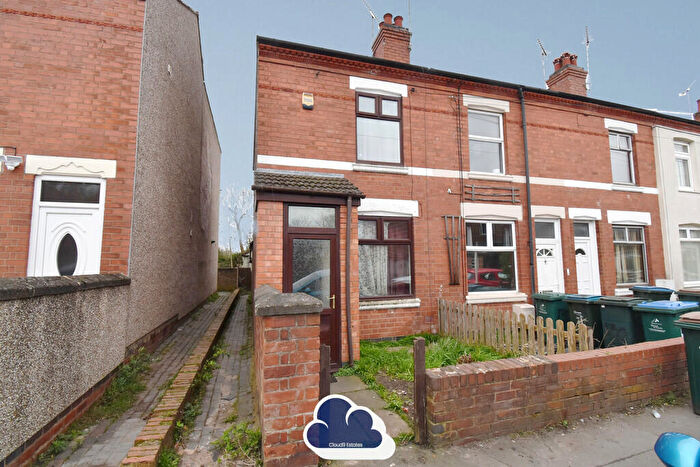
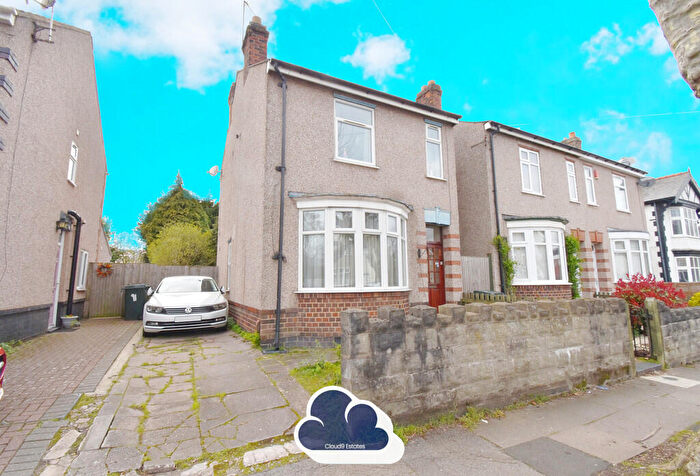
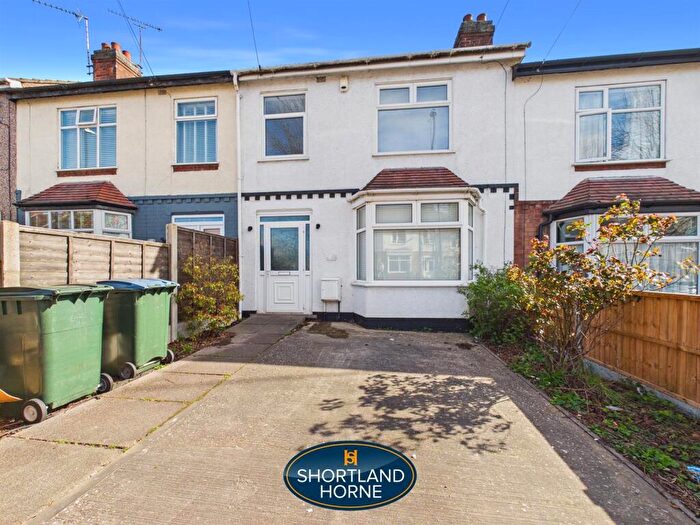
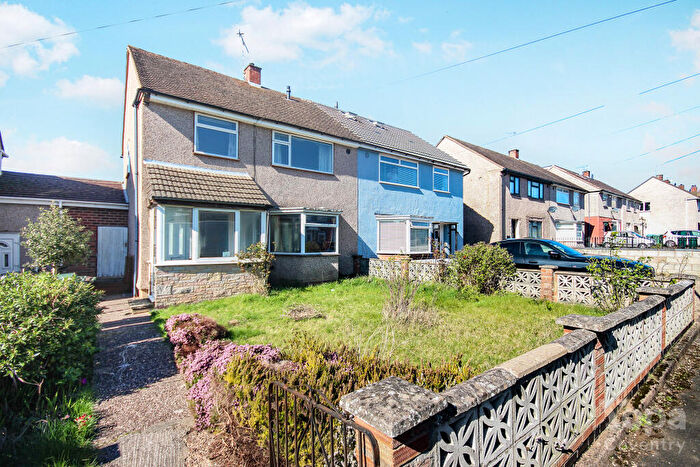
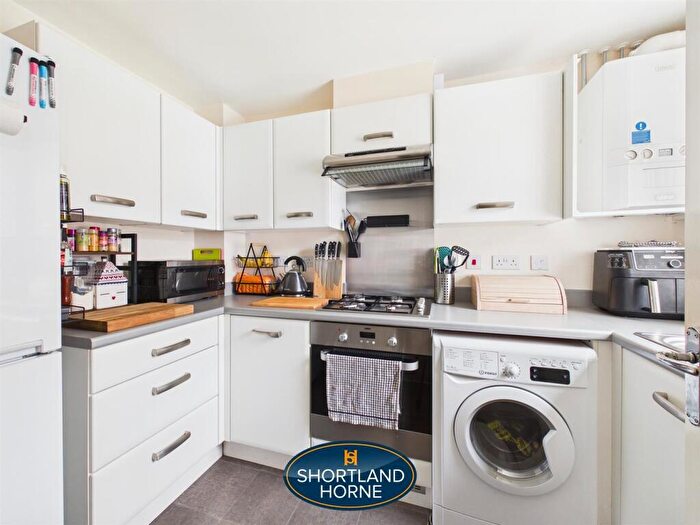
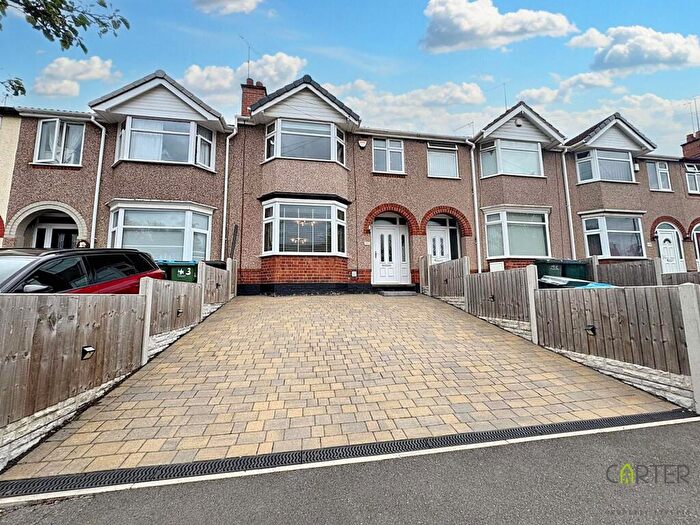
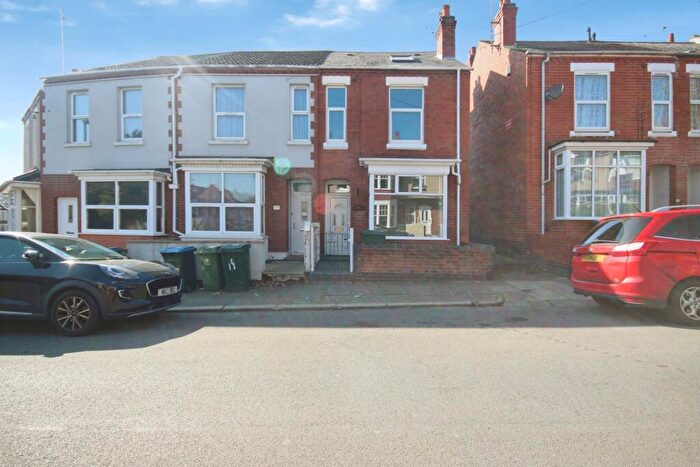
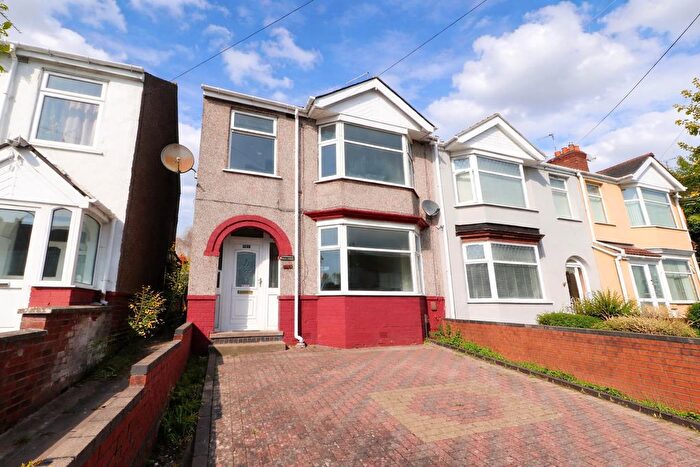
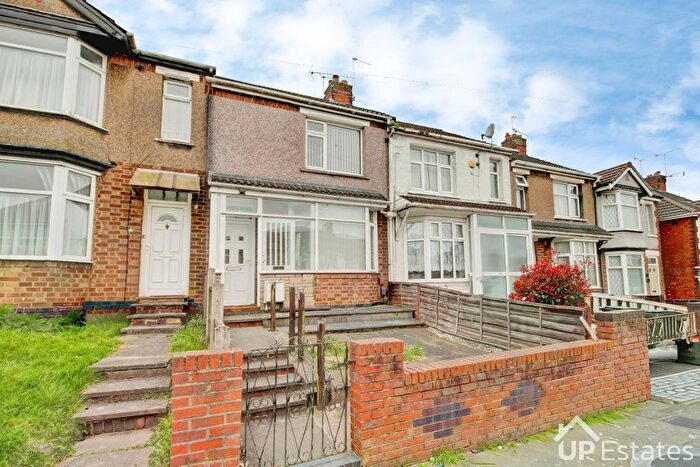
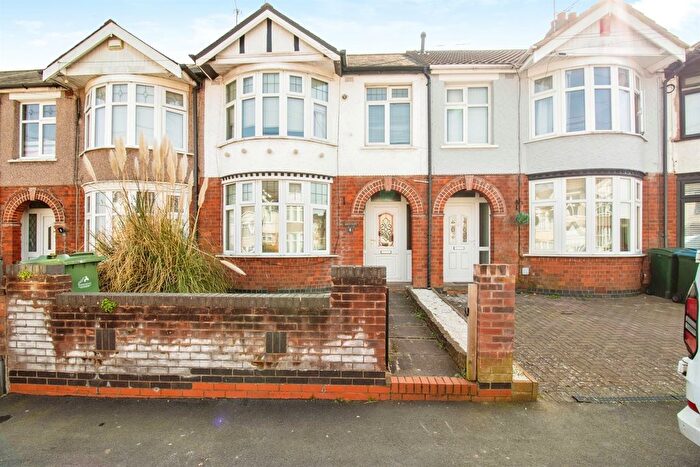
Properties for sale near CV2 3RA, Hypericum Gardens
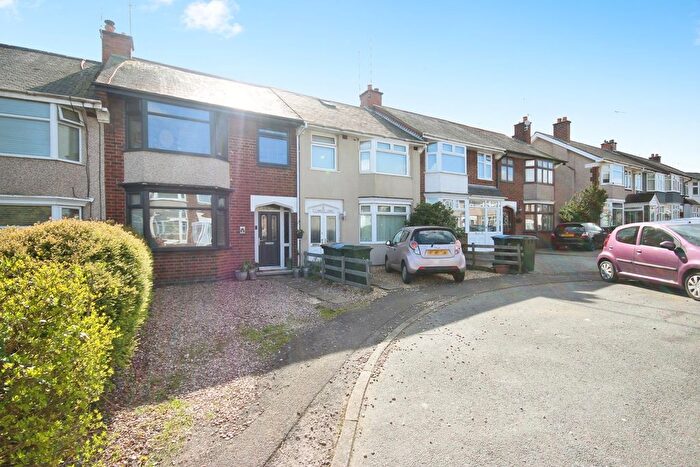
![]()
If you are looking to sell your house, let it out, or receive a property valuation, an expert can help you.
Click the button below to get started.


Price Paid in Hypericum Gardens, CV2 3RA, Lower Stoke
3 Hypericum Gardens, CV2 3RA, Lower Stoke Coventry
Property 3 has been sold 2 times. The last time it was sold was in 23/12/2013 and the sold price was £350,000.00.
This detached house, sold as a freehold on 23/12/2013, is a 174 sqm detached bungalow with an EPC rating of C.
| Date | Price | Property Type | Tenure | Classification |
|---|---|---|---|---|
| 23/12/2013 | £350,000.00 | Detached House | freehold | Established Building |
| 09/06/2000 | £215,000.00 | Detached House | freehold | New Build |
2 Hypericum Gardens, CV2 3RA, Lower Stoke Coventry
Property 2 has been sold 1 time. The last time it was sold was in 08/06/2000 and the sold price was £100,000.00.
This is a Detached House which was sold as a freehold in 08/06/2000
| Date | Price | Property Type | Tenure | Classification |
|---|---|---|---|---|
| 08/06/2000 | £100,000.00 | Detached House | freehold | New Build |
1 Hypericum Gardens, CV2 3RA, Lower Stoke Coventry
Property 1 has been sold 1 time. The last time it was sold was in 23/02/2000 and the sold price was £70,000.00.
This detached house, sold as a freehold on 23/02/2000, is a 106 sqm detached bungalow with an EPC rating of C.
| Date | Price | Property Type | Tenure | Classification |
|---|---|---|---|---|
| 23/02/2000 | £70,000.00 | Detached House | freehold | New Build |
Transport near CV2 3RA, Hypericum Gardens

House price paid reports for CV2 3RA, Hypericum Gardens
Click on the buttons below to see price paid reports by year or property price:
- Price Paid By Year
Property Price Paid in CV2 3RA, Hypericum Gardens by Year
The average sold property price by year was:
| Year | Average Sold Price | Price Change |
Sold Properties
|
|---|---|---|---|
| 2013 | £350,000 | 63% |
1 Property |
| 2000 | £128,333 | - |
3 Properties |