
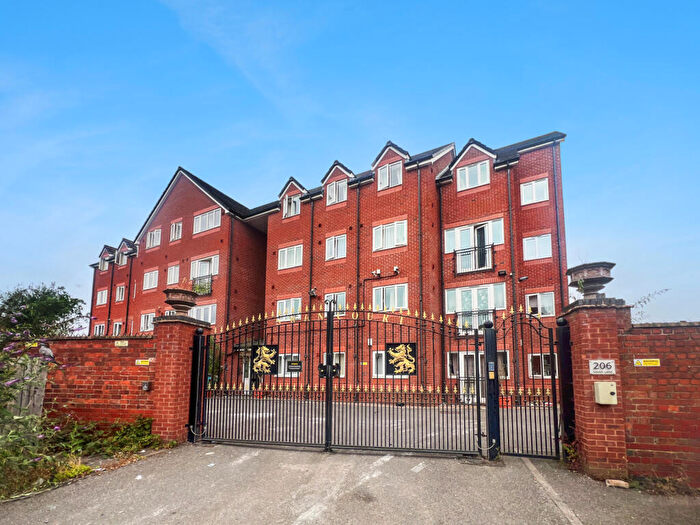
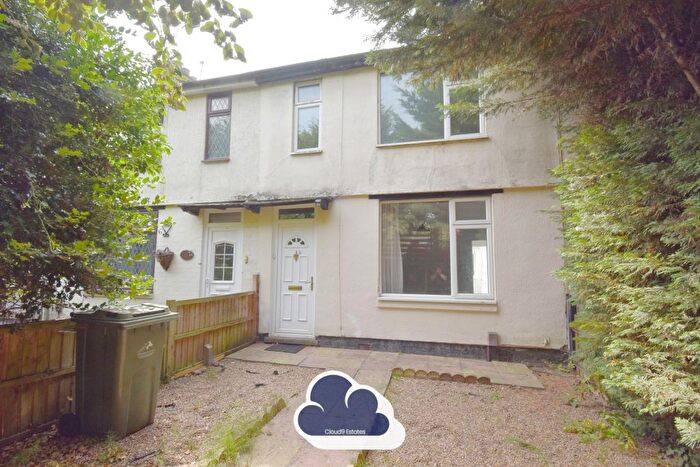
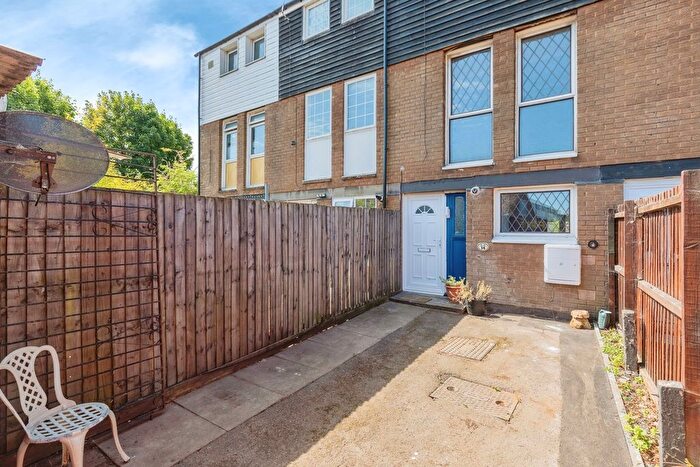
Houses for sale in Coventry, England
House Prices in Coventry
Properties in Coventry have
an average house price of
£231k
and had 12,384 Property Transactions
within the last 3 years.¹
Coventry is a location in
England with
136,158 households², where the most expensive property was sold for £2.26M.
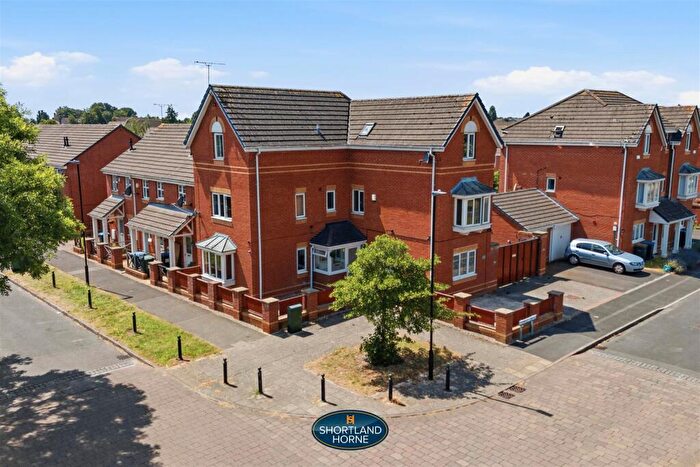
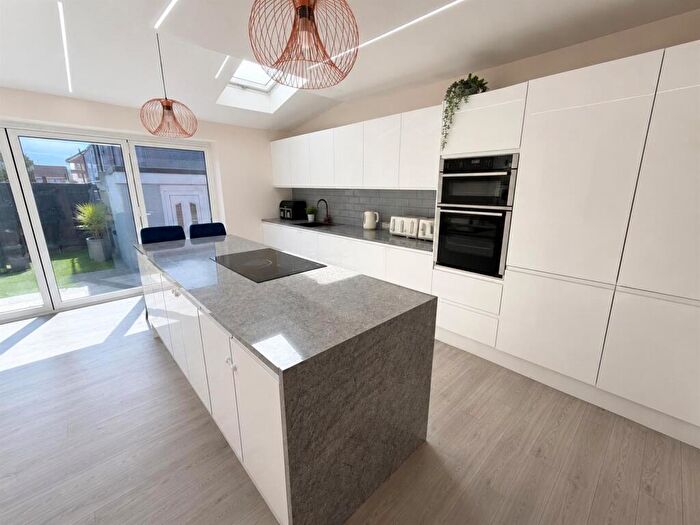
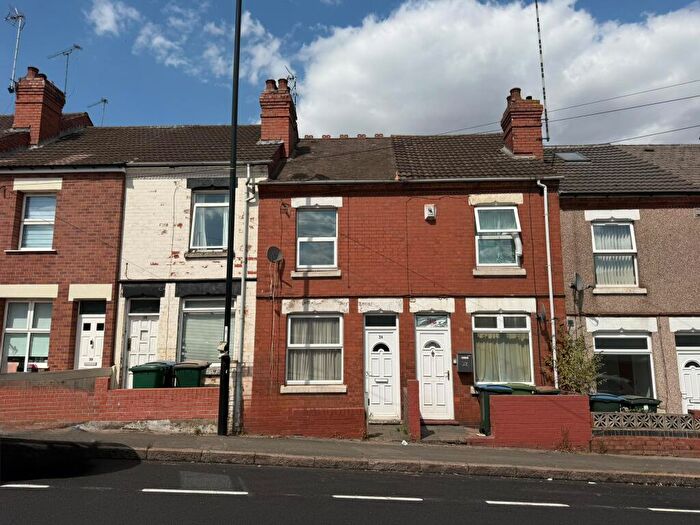
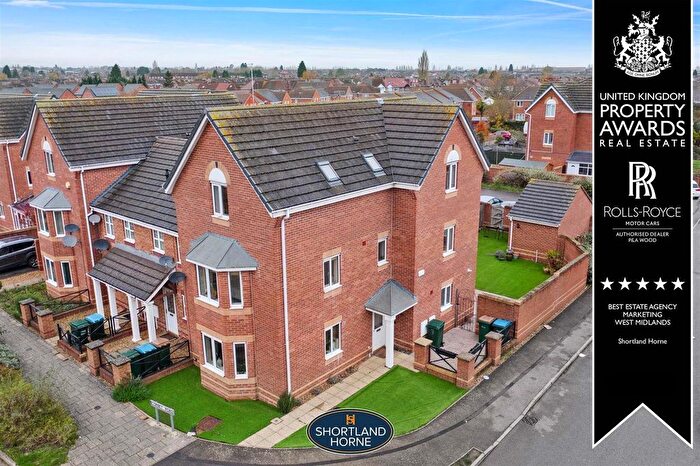
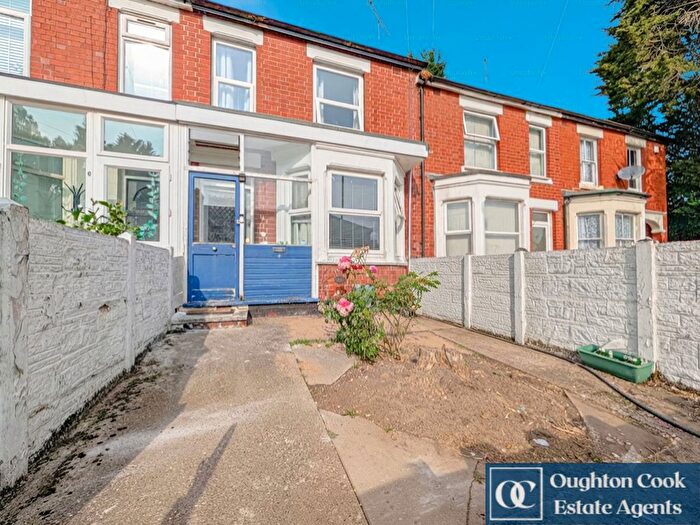
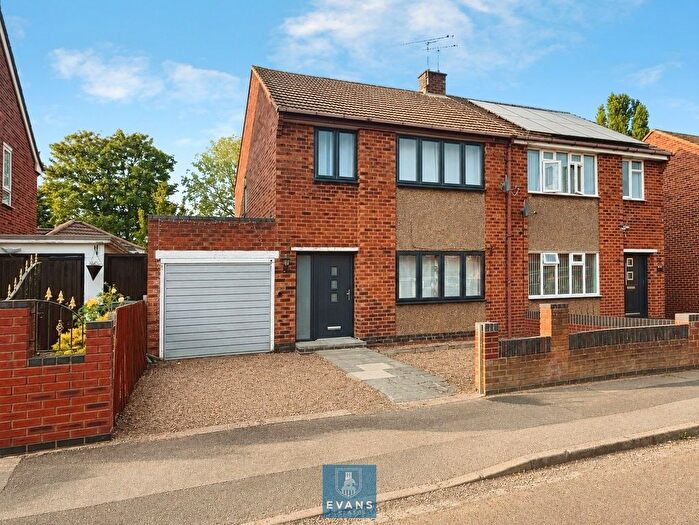
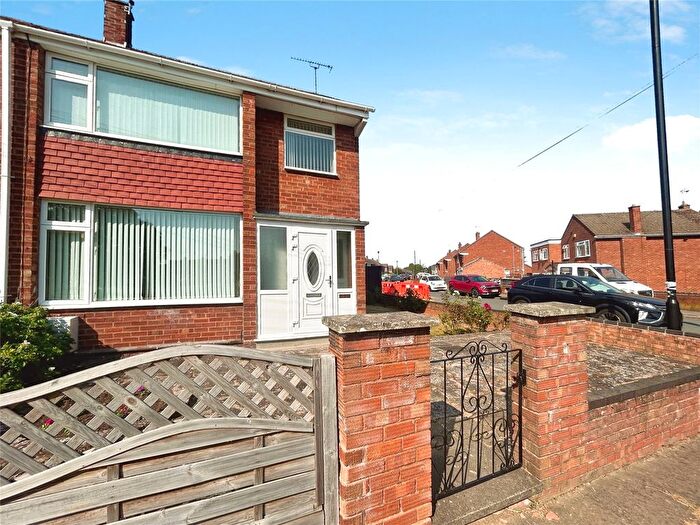
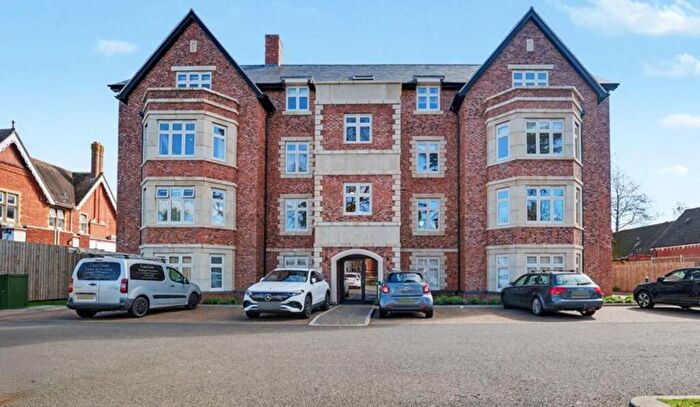
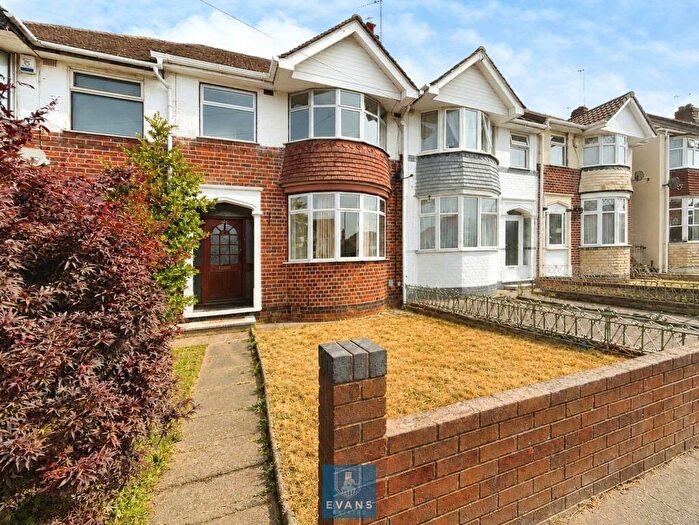
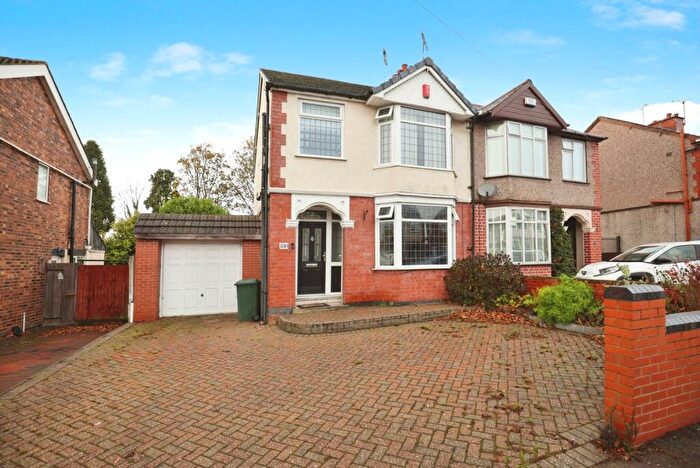
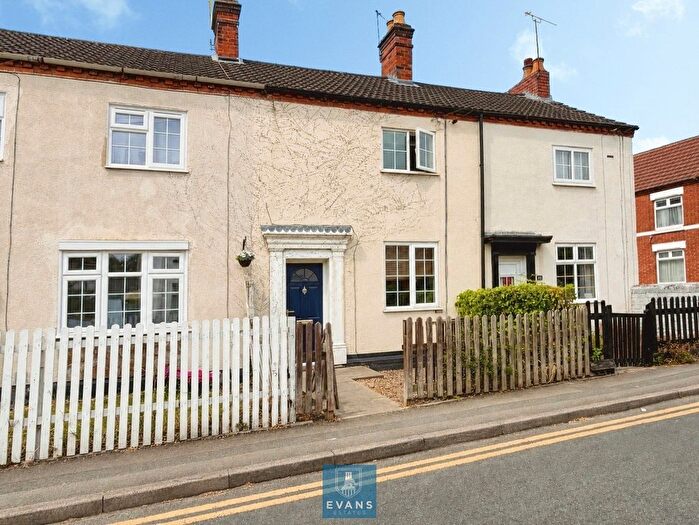
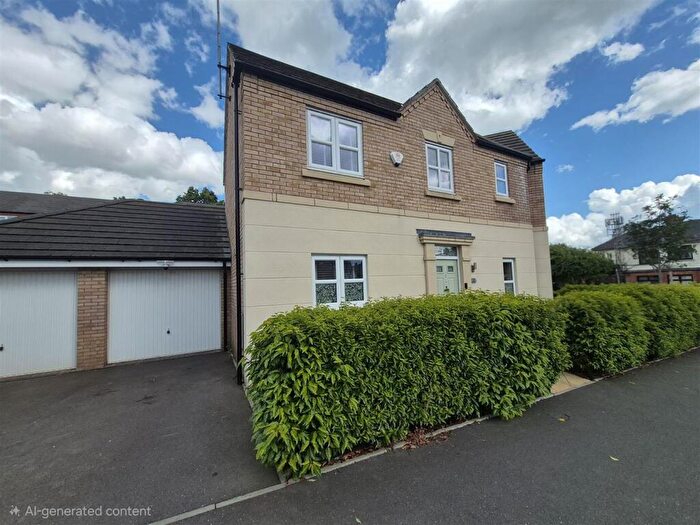
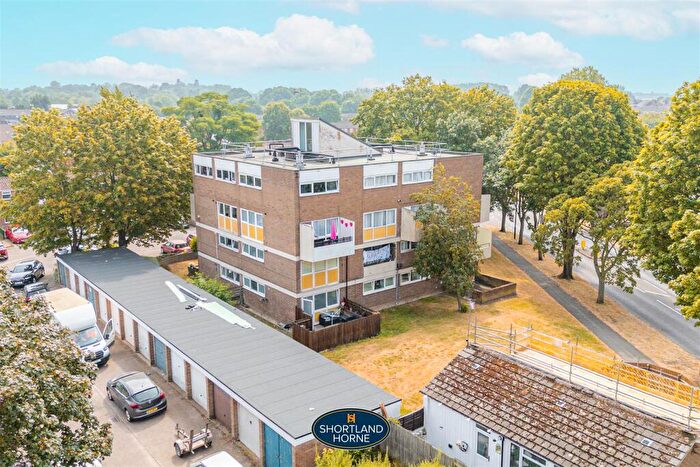
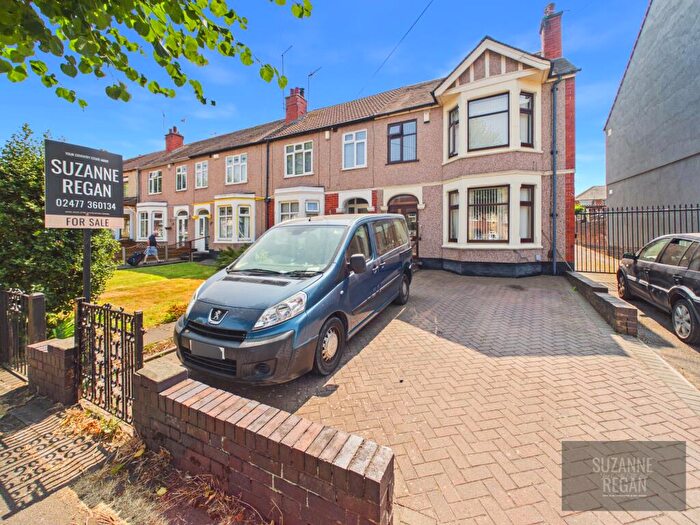
Properties for sale in Coventry
![]()
If you are looking to sell your house, let it out, or receive a property valuation, an expert can help you.
Click the button below to get started.


Towns in Coventry
Navigate through our locations to find the location of your next house in Coventry, England for sale or to rent.
Property price trends in Coventry
According to the latest Land Registry data, the average home in Coventry sold for £230,188 in 2026. That figure comes from a substantial record of 153,171 sales logged over the past 31 years.
Prices have moved up over the last three years. Compared with 2023, when the typical sale came in around £226,270, that's a rise of roughly 1.7%.
Looking back five years, average prices are up about 5.6% since 2021, a gain of around £12,285 in cash terms.
Zoom out to the past decade for the fuller picture. Back in 2016, homes here averaged £172,944, so the typical sold price has climbed about 33.1% since then, roughly 2.9% a year. Stretch the view to fifteen years and that annual pace edges up closer to 3.6%.
Frequently asked questions about Coventry
What is the average price for a property for sale in Coventry?
The average price for a property for sale in Coventry is £231,451. This amount is 36% lower than the average price in England. There are more than 10,000 property listings for sale in Coventry.
Which train stations are available in or near Coventry?
Some of the train stations available in or near Coventry are Coventry Arena, Coventry and Canley.
Property Price Paid in Coventry by Year
The average sold property price by year was:
| Year | Average Sold Price | Price Change |
Sold Properties
|
|---|---|---|---|
| 2026 | £230,188 | -3% |
690 Properties |
| 2025 | £237,809 | 3% |
4,005 Properties |
| 2024 | £230,024 | 2% |
4,061 Properties |
| 2023 | £226,270 | -2% |
3,628 Properties |
| 2022 | £231,022 | 6% |
4,702 Properties |
| 2021 | £217,903 | 6% |
5,481 Properties |
| 2020 | £204,951 | 3% |
3,972 Properties |
| 2019 | £197,840 | 1% |
4,835 Properties |
| 2018 | £195,172 | 5% |
4,946 Properties |
| 2017 | £184,922 | 6% |
5,201 Properties |
Property Price per Property Type in Coventry
Here you can find historic sold price data in order to help with your property search.
The average Property Paid Price for specific property types in the last three years are:
| Property Type | Average Sold Price | Sold Properties |
|---|---|---|
| Semi Detached House | £266,470.00 | 3,306 Semi Detached Houses |
| Terraced House | £204,884.00 | 6,490 Terraced Houses |
| Detached House | £413,966.00 | 1,121 Detached Houses |
| Flat | £130,600.00 | 1,467 Flats |
Transport in Coventry
Please see below transportation links in this area:
