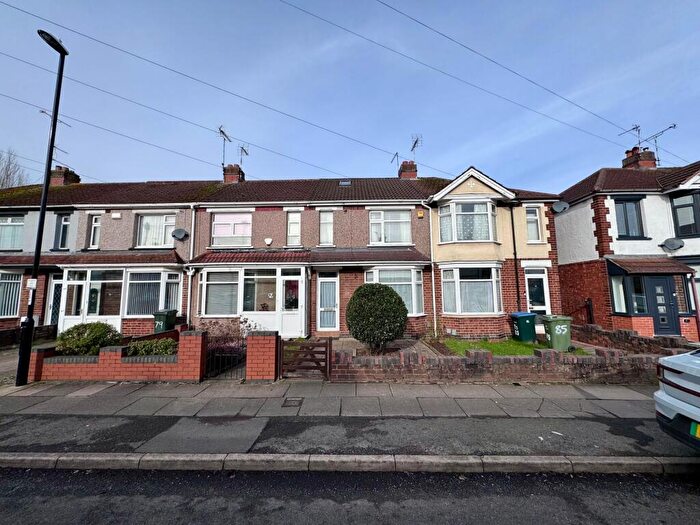
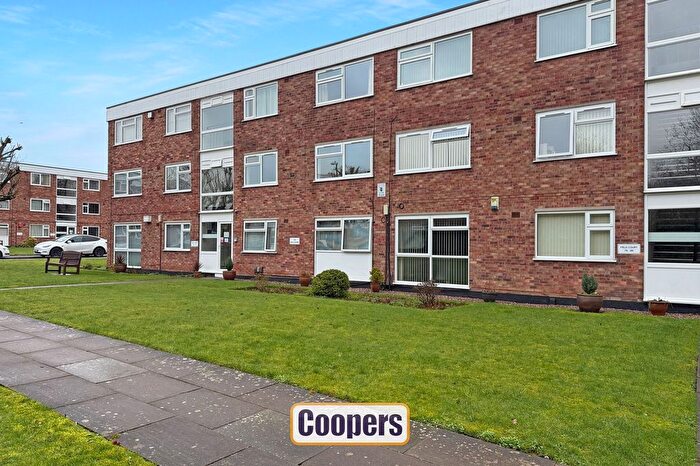
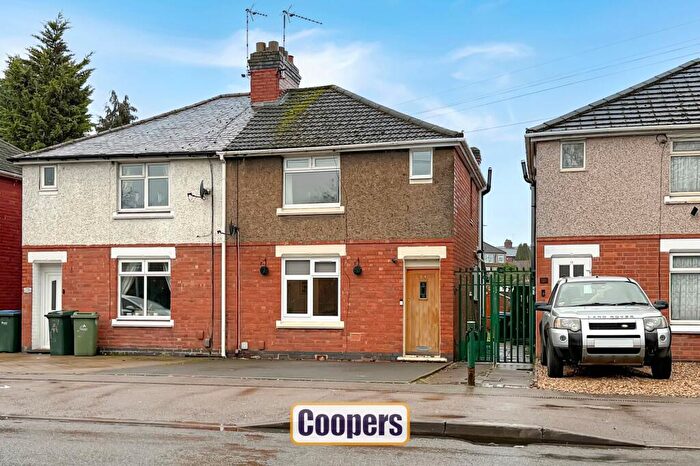
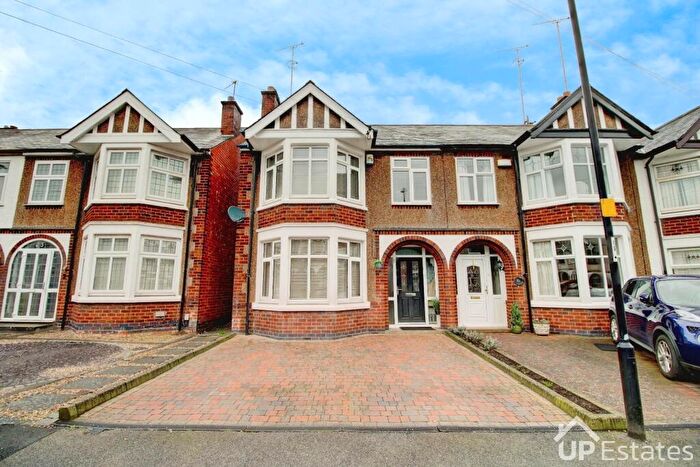
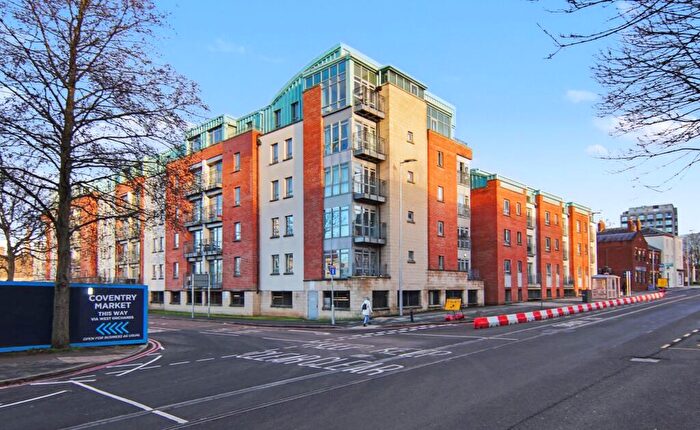
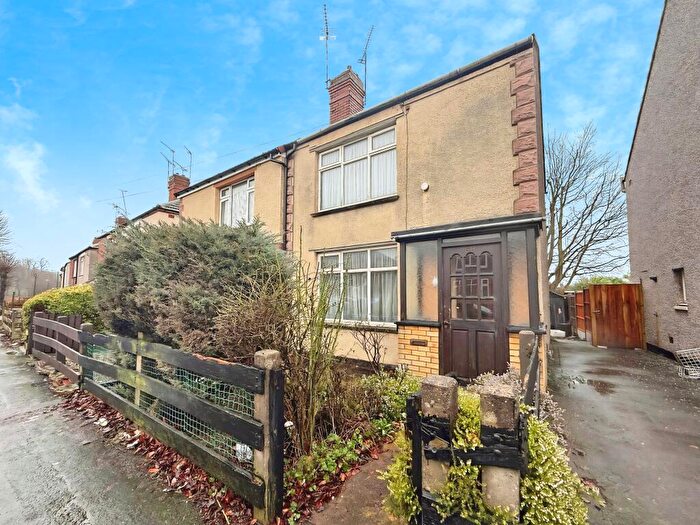
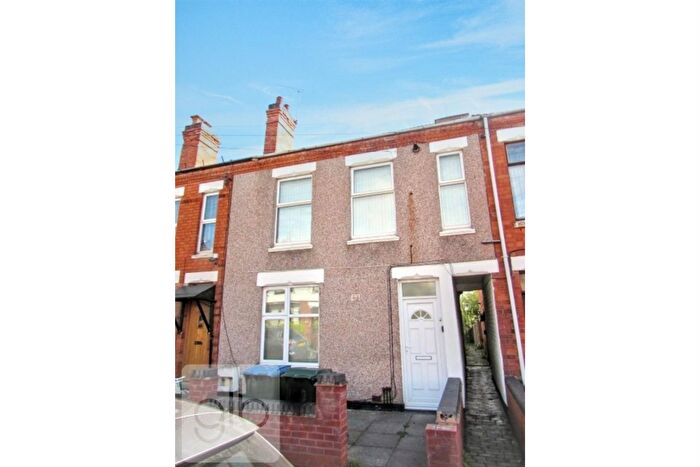
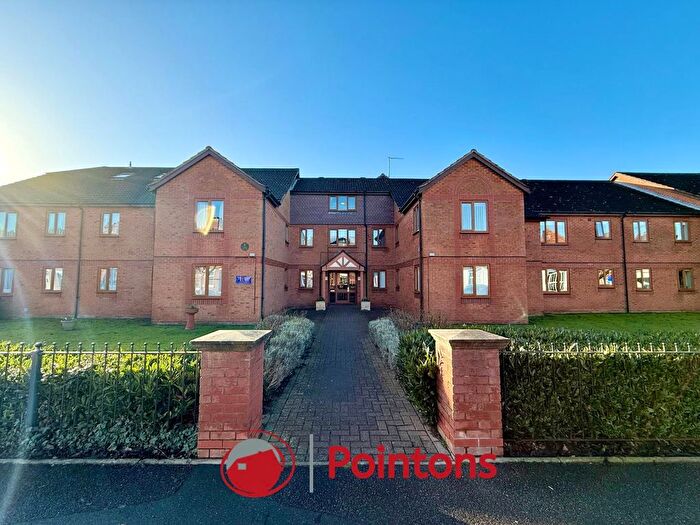
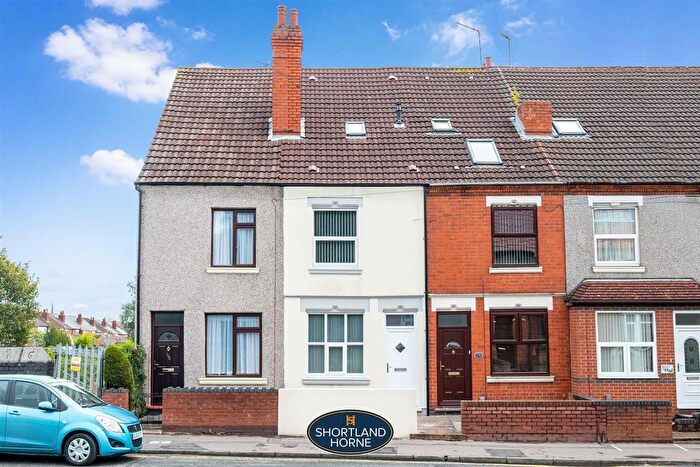
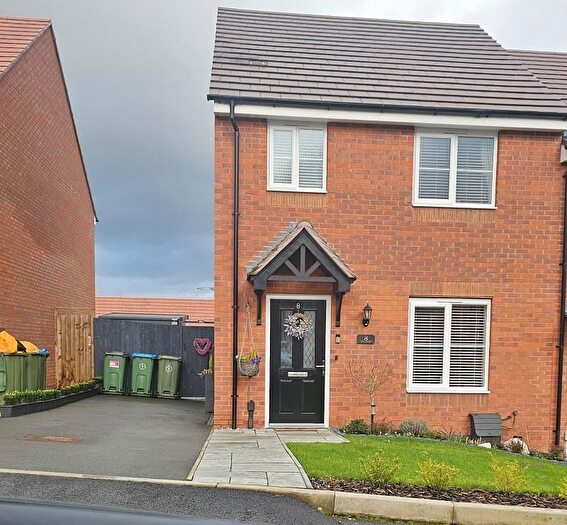
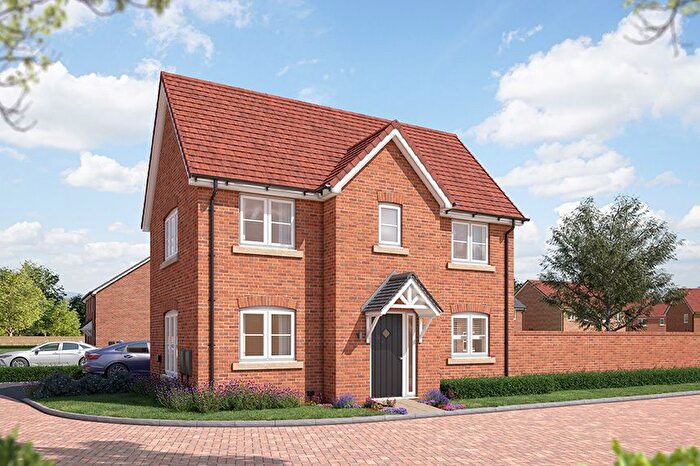
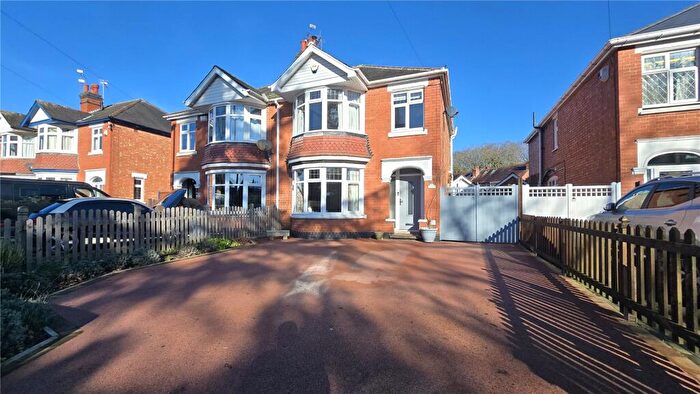
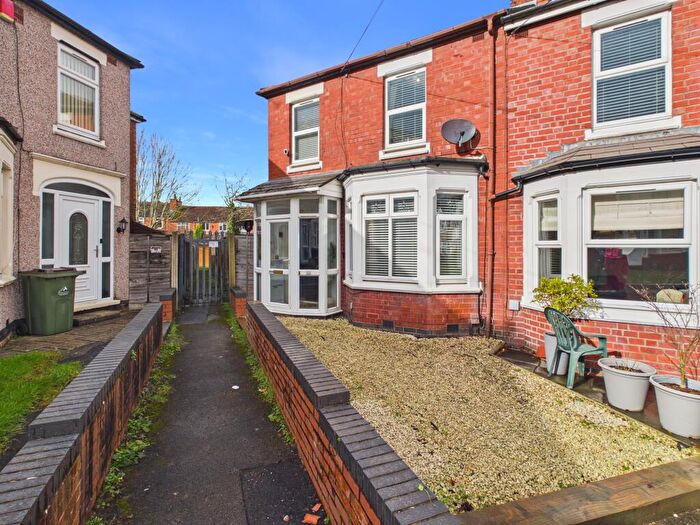
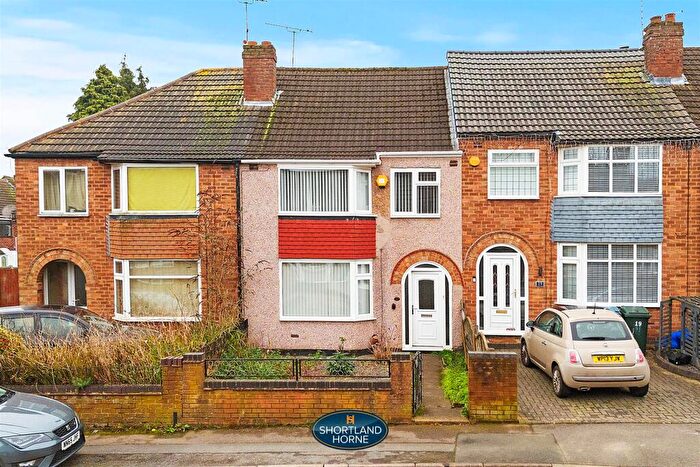
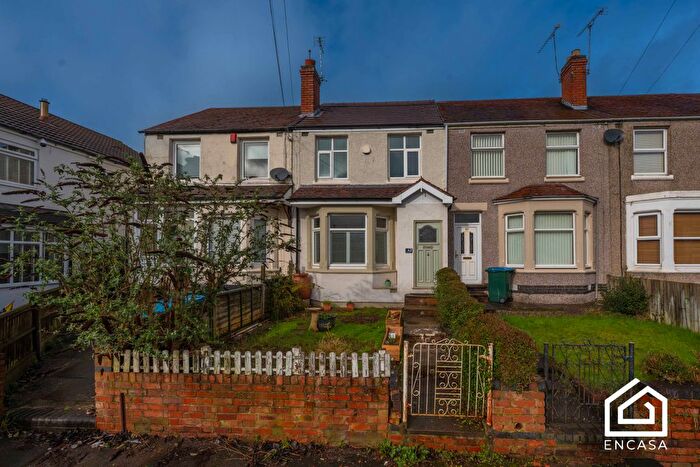
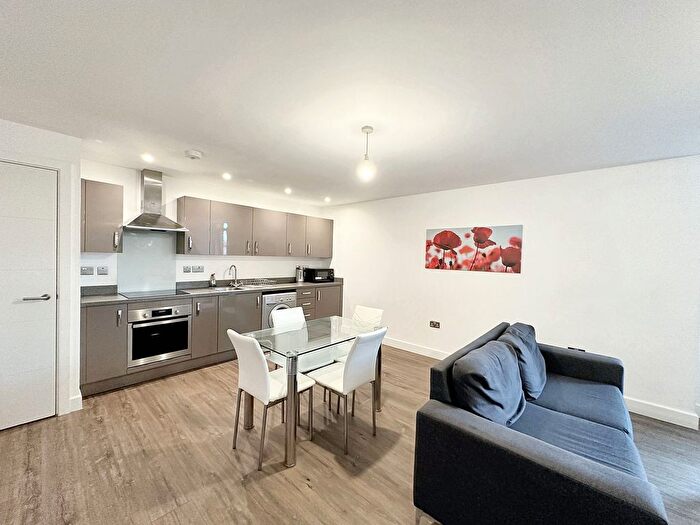
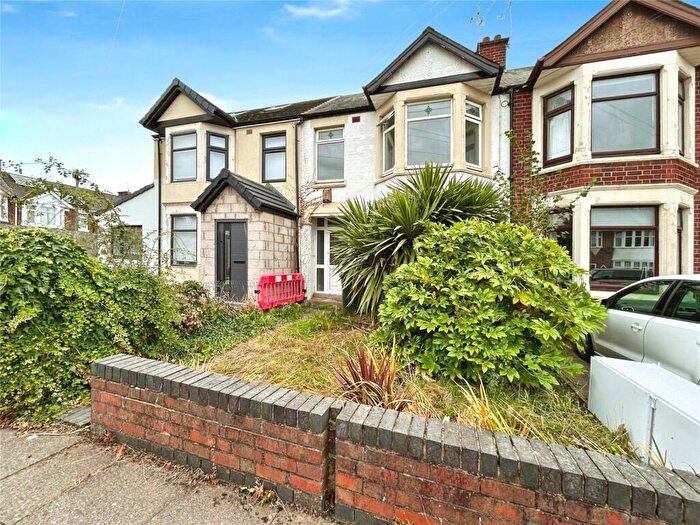
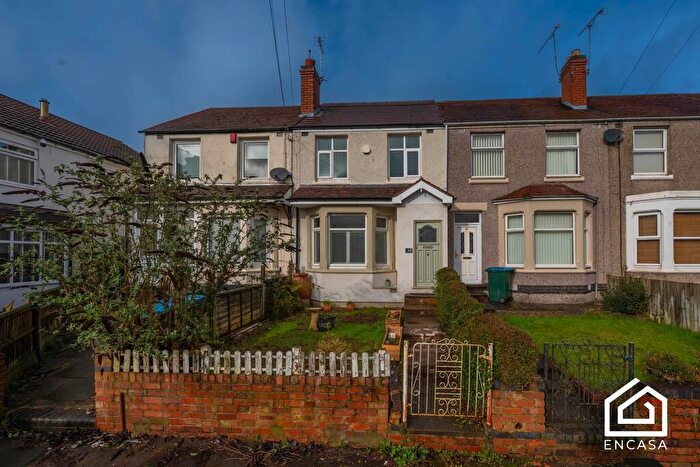
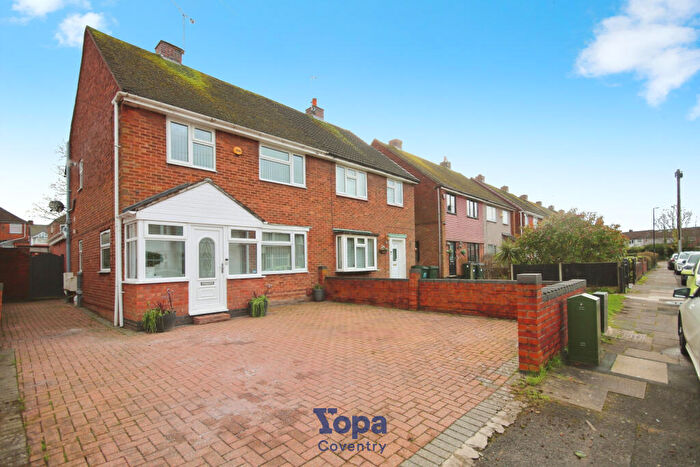
Houses for sale & to rent in Coventry, Coventry
House Prices in Coventry
Properties in Coventry have an average house price of £234,718.00 and had 10,813 Property Transactions within the last 3 years.¹
Coventry is an area in Coventry with 129,832 households², where the most expensive property was sold for £36,466,849.00.
Properties for sale in Coventry
Neighbourhoods in Coventry
Navigate through our locations to find the location of your next house in Coventry, Coventry for sale or to rent.
Transport in Coventry
Please see below transportation links in this area:
- FAQ
- Price Paid By Year
- Property Type Price
Frequently asked questions about Coventry
What is the average price for a property for sale in Coventry?
The average price for a property for sale in Coventry is £234,718. There are more than 10,000 property listings for sale in Coventry.
What locations have the most expensive properties for sale in Coventry?
The locations with the most expensive properties for sale in Coventry are Wainbody at an average of £377,565, Earlsdon at an average of £355,327 and Binley And Willenhall at an average of £281,260.
What locations have the most affordable properties for sale in Coventry?
The locations with the most affordable properties for sale in Coventry are Foleshill at an average of £162,922, St Michaels at an average of £169,760 and Radford at an average of £187,493.
Which train stations are available in or near Coventry?
Some of the train stations available in or near Coventry are Coventry Arena, Coventry and Canley.
Property Price Paid in Coventry by Year
The average sold property price by year was:
| Year | Average Sold Price | Price Change |
Sold Properties
|
|---|---|---|---|
| 2025 | £250,271 | 8% |
3,148 Properties |
| 2024 | £230,199 | 2% |
4,047 Properties |
| 2023 | £226,241 | -2% |
3,618 Properties |
| 2022 | £231,097 | 6% |
4,698 Properties |
| 2021 | £217,912 | 6% |
5,479 Properties |
| 2020 | £204,826 | 3% |
3,968 Properties |
| 2019 | £197,840 | 1% |
4,835 Properties |
| 2018 | £195,172 | 5% |
4,946 Properties |
| 2017 | £184,922 | 6% |
5,201 Properties |
| 2016 | £172,944 | 5% |
5,450 Properties |
| 2015 | £163,582 | 7% |
5,179 Properties |
| 2014 | £152,081 | 4% |
4,908 Properties |
| 2013 | £146,488 | 5% |
3,900 Properties |
| 2012 | £138,634 | 2% |
3,261 Properties |
| 2011 | £135,941 | -3% |
3,268 Properties |
| 2010 | £139,597 | 3% |
3,137 Properties |
| 2009 | £135,252 | -4% |
2,797 Properties |
| 2008 | £140,744 | -4% |
3,494 Properties |
| 2007 | £146,798 | 3% |
6,580 Properties |
| 2006 | £142,298 | 8% |
6,867 Properties |
| 2005 | £131,415 | 6% |
5,490 Properties |
| 2004 | £123,721 | 14% |
6,036 Properties |
| 2003 | £106,744 | 17% |
6,466 Properties |
| 2002 | £88,128 | 17% |
7,271 Properties |
| 2001 | £73,260 | 11% |
6,365 Properties |
| 2000 | £65,127 | 9% |
6,040 Properties |
| 1999 | £59,256 | 9% |
6,204 Properties |
| 1998 | £54,187 | 6% |
5,224 Properties |
| 1997 | £51,075 | 4% |
5,048 Properties |
| 1996 | £48,866 | 2% |
4,825 Properties |
| 1995 | £48,115 | - |
3,838 Properties |
Property Price per Property Type in Coventry
Here you can find historic sold price data in order to help with your property search.
The average Property Paid Price for specific property types in the last three years are:
| Property Type | Average Sold Price | Sold Properties |
|---|---|---|
| Semi Detached House | £279,385.00 | 2,897 Semi Detached Houses |
| Terraced House | £204,826.00 | 5,637 Terraced Houses |
| Detached House | £409,151.00 | 991 Detached Houses |
| Flat | £130,867.00 | 1,288 Flats |

