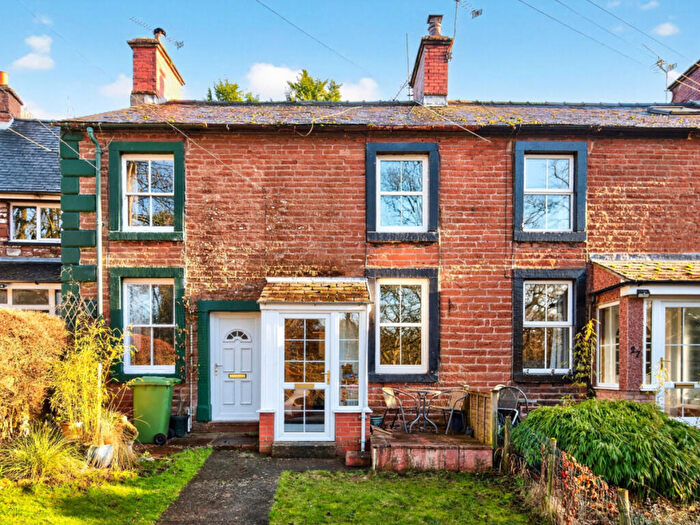
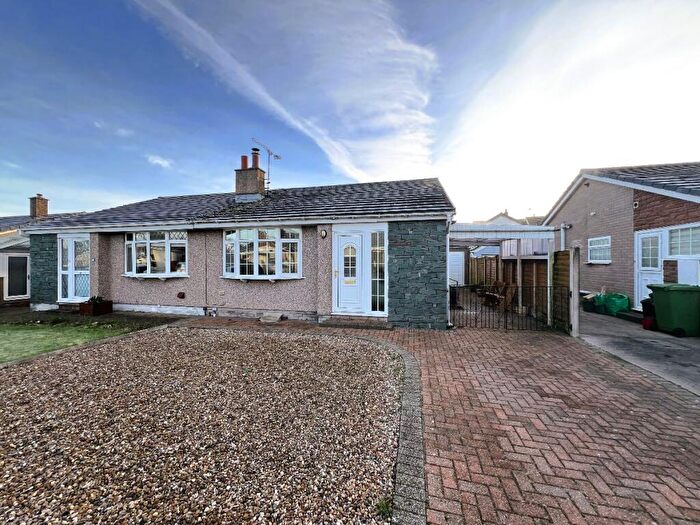
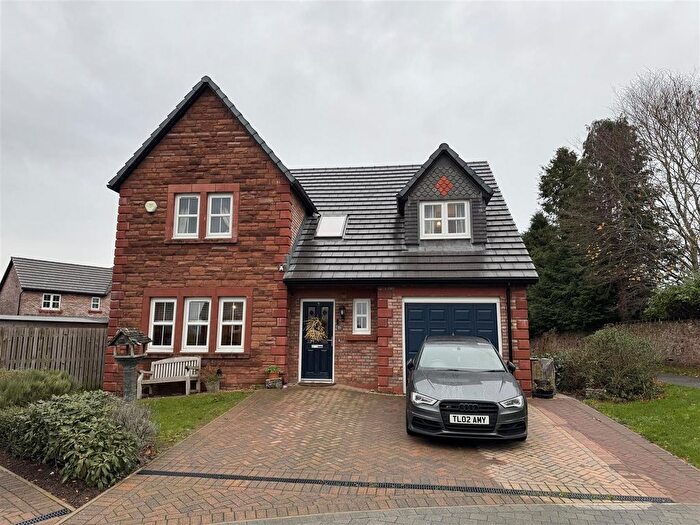
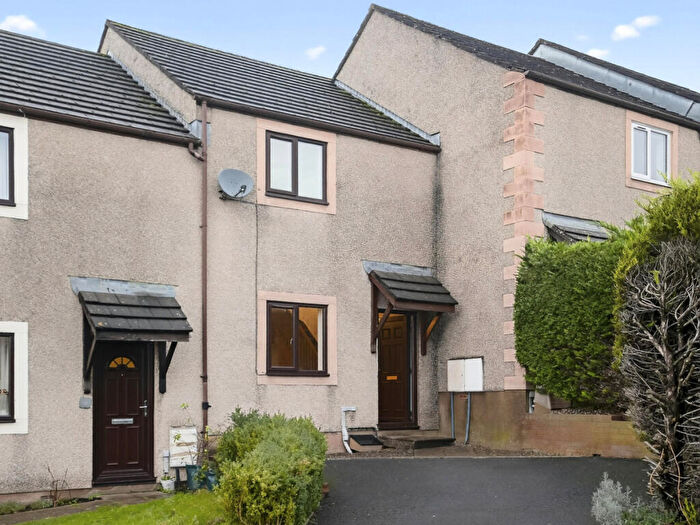
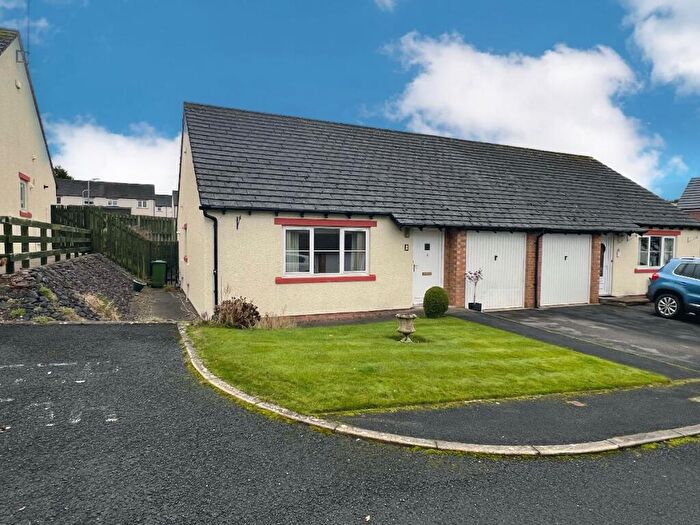
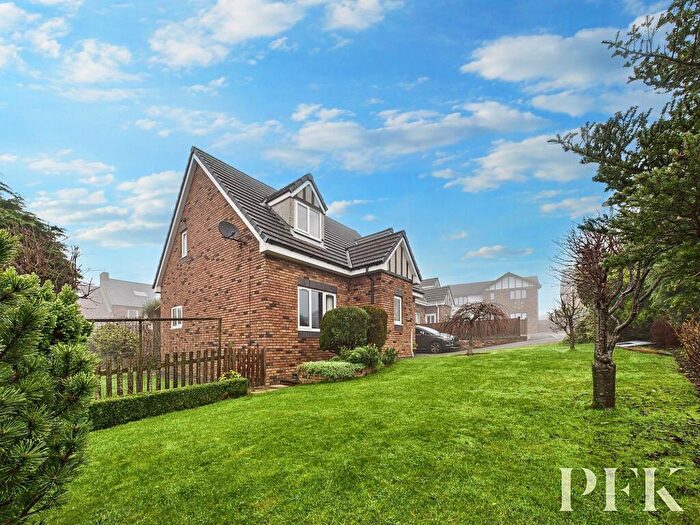
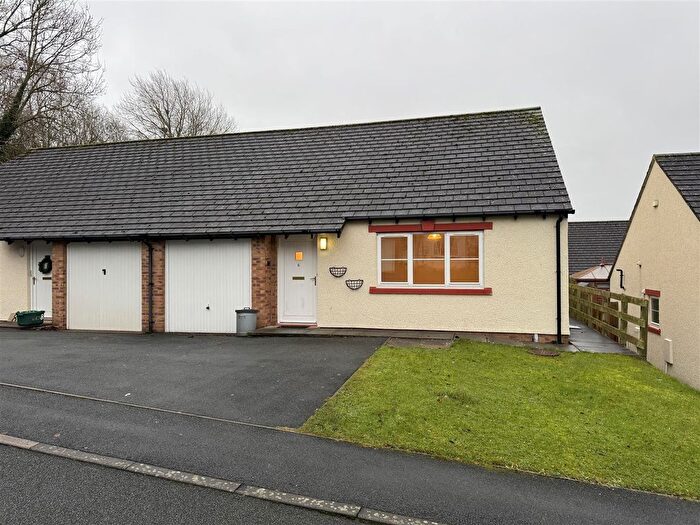
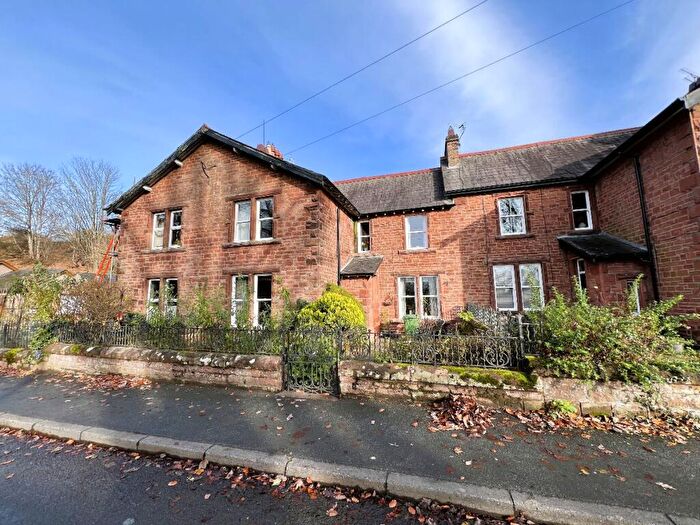
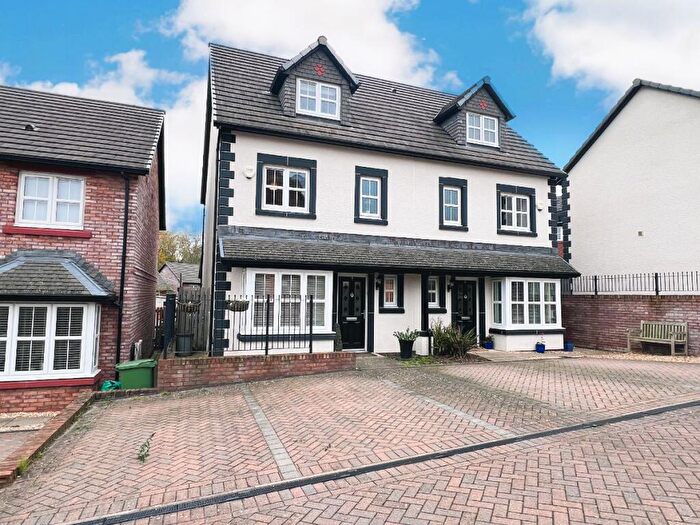
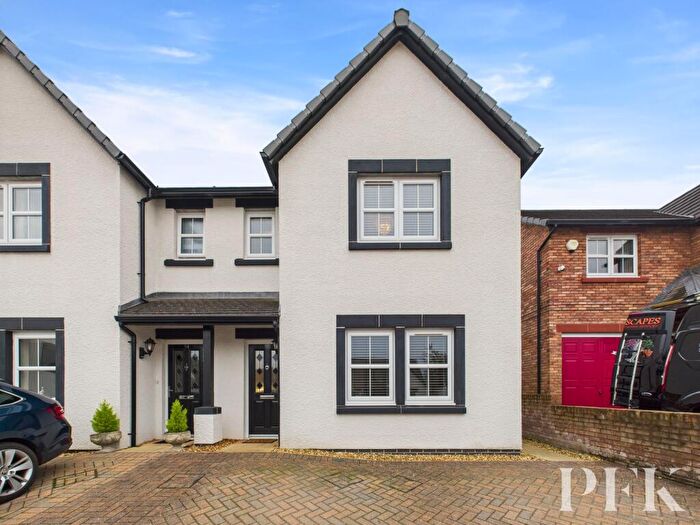
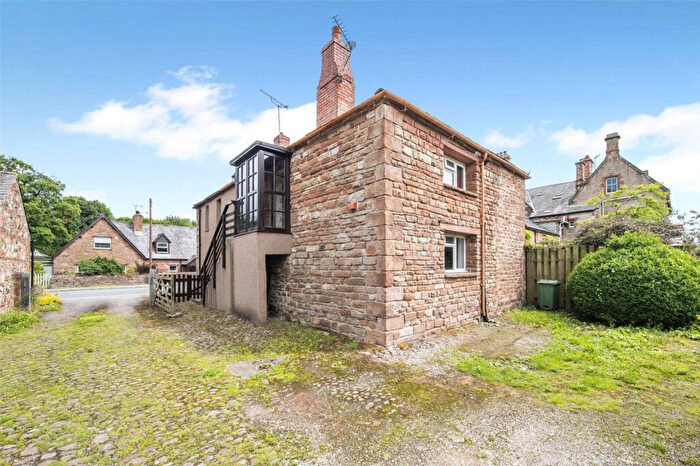
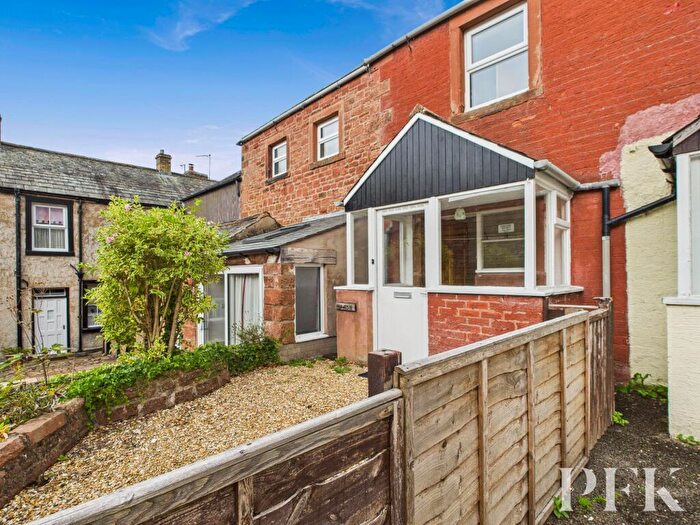
Houses for sale & to rent in Appleby (appleby), Appleby-in-westmorland
House Prices in Appleby (appleby)
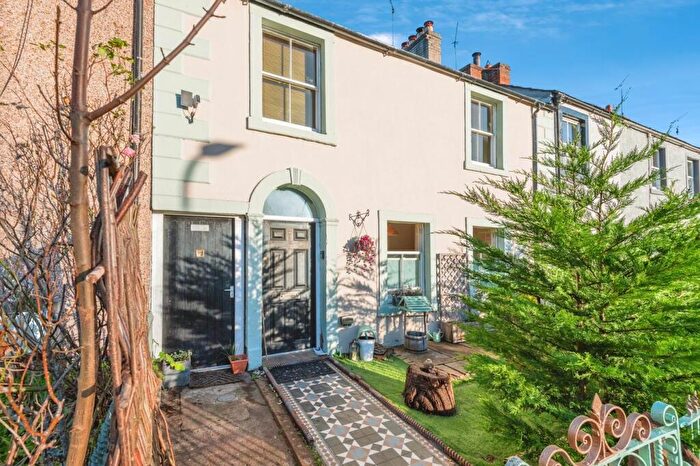
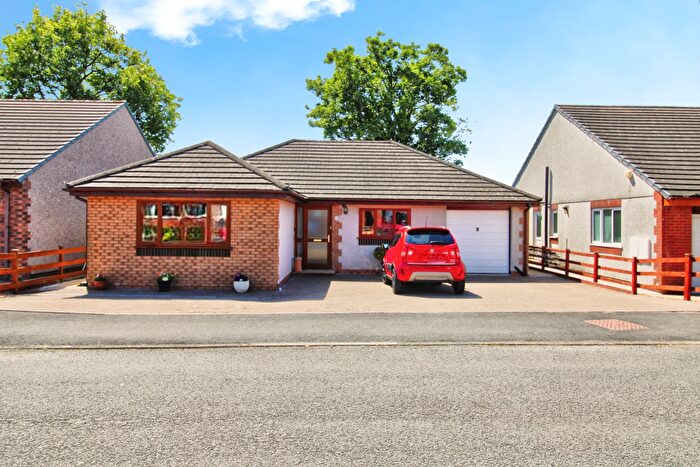
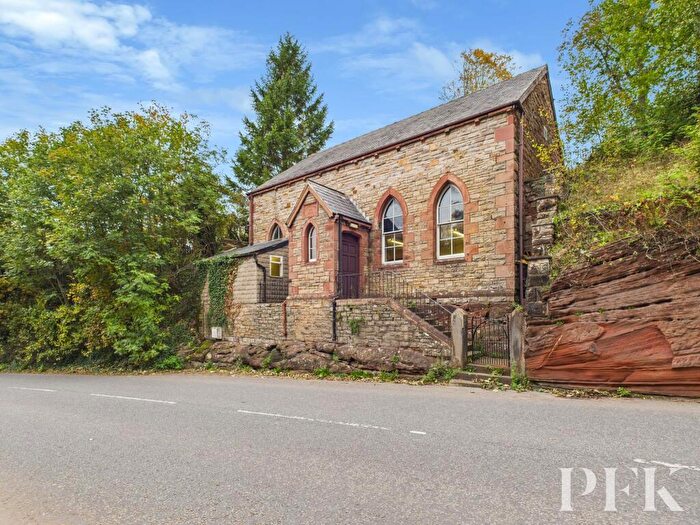
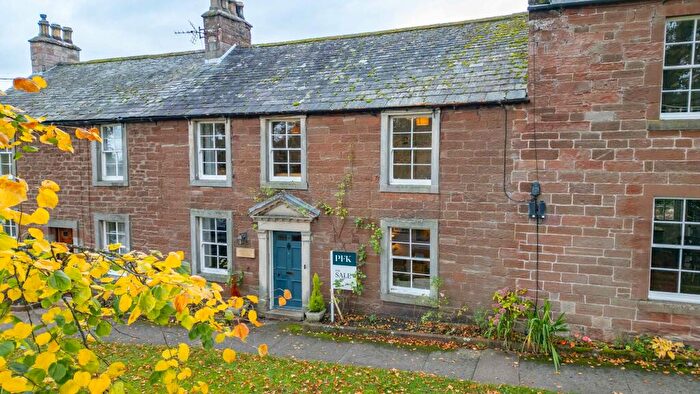
Properties in Appleby (appleby) have an average house price of £185,983.00 and had 92 Property Transactions within the last 3 years¹.
Appleby (appleby) is an area in Appleby-in-westmorland, Cumbria with 647 households², where the most expensive property was sold for £600,000.00.
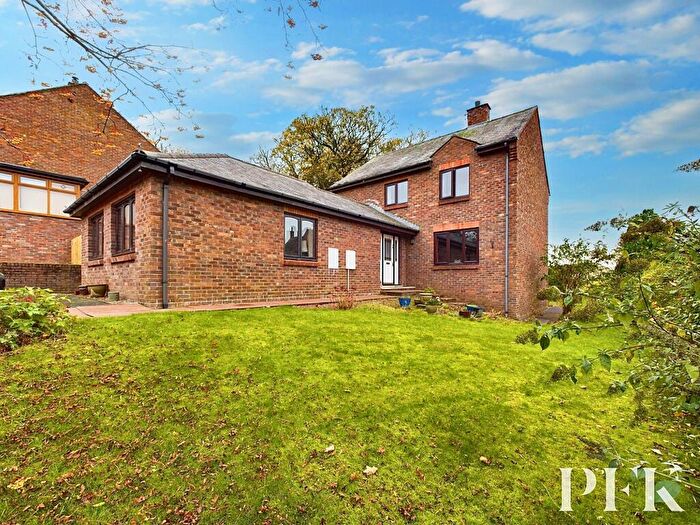
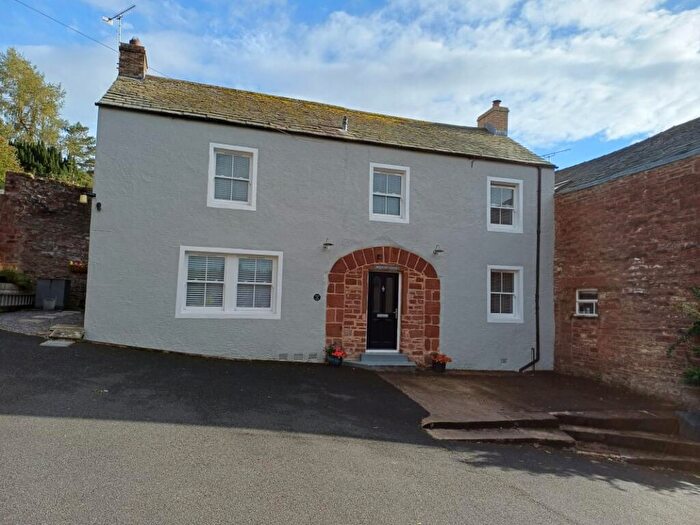
Properties for sale in Appleby (appleby)
Roads and Postcodes in Appleby (appleby)
Navigate through our locations to find the location of your next house in Appleby (appleby), Appleby-in-westmorland for sale or to rent.
| Streets | Postcodes |
|---|---|
| Banks Lane | CA16 6RA |
| Banks Terrace | CA16 6QZ |
| Barrowmoor Road | CA16 6SB |
| Boroughgate | CA16 6XF CA16 6XG CA16 6XH CA16 6UZ CA16 6XB CA16 6XE CA16 6YA CA16 6YB |
| Bridge Street | CA16 6QH |
| Caesars View | CA16 6SH |
| Castle Park View | CA16 6RG |
| Chapel Street | CA16 6QR |
| Colby Lane | CA16 6RH CA16 6RJ |
| Doomgate | CA16 6RB |
| Glebe Close | CA16 6RS |
| Glebe Crescent | CA16 6RX |
| Glebe Road | CA16 6RT CA16 6RU |
| High Wiend | CA16 6RD |
| Holme Court | CA16 6QT |
| Holme Street | CA16 6QU |
| Low Wiend | CA16 6QP |
| Margarets Way | CA16 6SA |
| Market Square | CA16 6XA |
| Murton Close | CA16 6RE |
| Murton View | CA16 6RF |
| Overwood Place | CA16 6RN |
| Parkin Hill | CA16 6EA CA16 6SY |
| Rampkin Pastures | CA16 6RL |
| Scattergate | CA16 6RQ |
| Scattergate Close | CA16 6SL |
| Scattergate Crescent | CA16 6SR |
| Scattergate Green | CA16 6SP |
| CA16 6BA CA16 6QW CA16 6SN CA16 6XQ CA16 6YL |
Transport near Appleby (appleby)
-
Appleby Station
-
Kirkby Stephen Station
-
Langwathby Station
-
Penrith Station
-
Lazonby and Kirkoswald Station
- FAQ
- Price Paid By Year
- Property Type Price
Frequently asked questions about Appleby (appleby)
What is the average price for a property for sale in Appleby (appleby)?
The average price for a property for sale in Appleby (appleby) is £185,983. This amount is 26% lower than the average price in Appleby-in-westmorland. There are 301 property listings for sale in Appleby (appleby).
What streets have the most expensive properties for sale in Appleby (appleby)?
The streets with the most expensive properties for sale in Appleby (appleby) are Parkin Hill at an average of £355,000, Holme Street at an average of £246,250 and Margarets Way at an average of £236,743.
What streets have the most affordable properties for sale in Appleby (appleby)?
The streets with the most affordable properties for sale in Appleby (appleby) are Holme Court at an average of £62,000, Overwood Place at an average of £74,400 and Rampkin Pastures at an average of £82,071.
Which train stations are available in or near Appleby (appleby)?
Some of the train stations available in or near Appleby (appleby) are Appleby, Kirkby Stephen and Langwathby.
Property Price Paid in Appleby (appleby) by Year
The average sold property price by year was:
| Year | Average Sold Price | Price Change |
Sold Properties
|
|---|---|---|---|
| 2025 | £164,231 | -9% |
16 Properties |
| 2024 | £179,544 | -16% |
19 Properties |
| 2023 | £208,673 | 10% |
19 Properties |
| 2022 | £187,016 | - |
38 Properties |
| 2021 | £186,970 | 13% |
26 Properties |
| 2020 | £162,450 | 6% |
20 Properties |
| 2019 | £152,217 | 4% |
23 Properties |
| 2018 | £146,775 | -1% |
20 Properties |
| 2017 | £147,522 | 17% |
22 Properties |
| 2016 | £123,118 | -41% |
16 Properties |
| 2015 | £173,714 | -0,1% |
14 Properties |
| 2014 | £173,843 | 27% |
16 Properties |
| 2013 | £126,777 | -16% |
18 Properties |
| 2012 | £146,938 | 7% |
12 Properties |
| 2011 | £136,416 | -5% |
18 Properties |
| 2010 | £142,785 | -2% |
14 Properties |
| 2009 | £145,000 | -19% |
18 Properties |
| 2008 | £172,630 | 6% |
15 Properties |
| 2007 | £163,008 | 1% |
33 Properties |
| 2006 | £160,597 | 9% |
36 Properties |
| 2005 | £146,457 | 12% |
27 Properties |
| 2004 | £129,017 | 2% |
26 Properties |
| 2003 | £126,015 | 38% |
30 Properties |
| 2002 | £78,185 | 2% |
27 Properties |
| 2001 | £76,339 | 15% |
19 Properties |
| 2000 | £65,125 | 4% |
16 Properties |
| 1999 | £62,583 | 17% |
18 Properties |
| 1998 | £52,238 | 5% |
26 Properties |
| 1997 | £49,629 | -5% |
22 Properties |
| 1996 | £52,038 | 22% |
26 Properties |
| 1995 | £40,404 | - |
11 Properties |
Property Price per Property Type in Appleby (appleby)
Here you can find historic sold price data in order to help with your property search.
The average Property Paid Price for specific property types in the last three years are:
| Property Type | Average Sold Price | Sold Properties |
|---|---|---|
| Semi Detached House | £182,210.00 | 37 Semi Detached Houses |
| Detached House | £294,041.00 | 12 Detached Houses |
| Terraced House | £177,906.00 | 29 Terraced Houses |
| Flat | £120,064.00 | 14 Flats |

