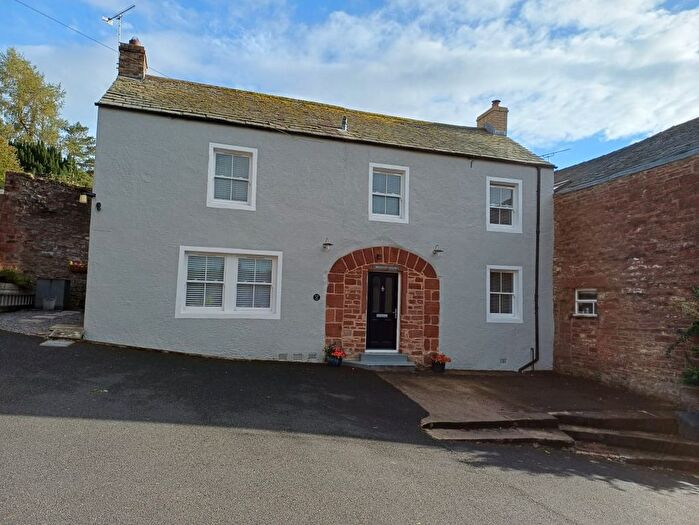
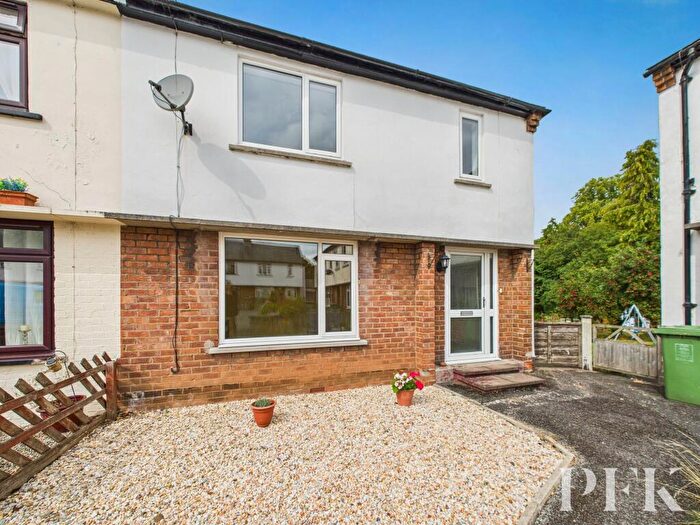
Houses for sale & to rent in Appleby (bongate), Appleby-in-westmorland
House Prices in Appleby (bongate)
Properties in Appleby (bongate) have an average house price of £227,230.00 and had 117 Property Transactions within the last 3 years¹.
Appleby (bongate) is an area in Appleby-in-westmorland, Cumbria with 762 households², where the most expensive property was sold for £595,000.00.
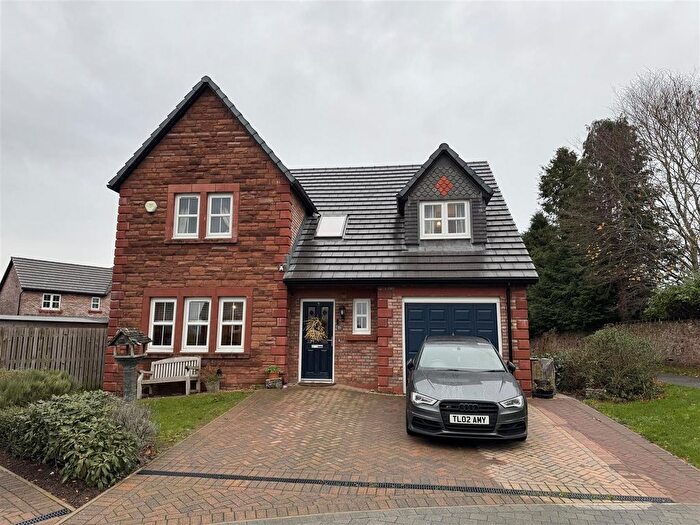
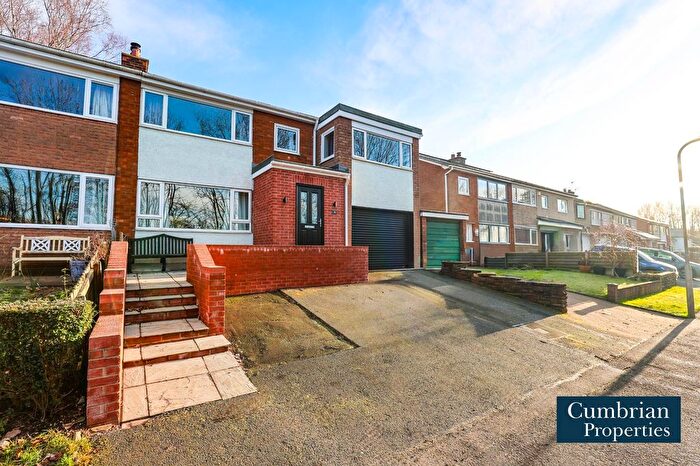
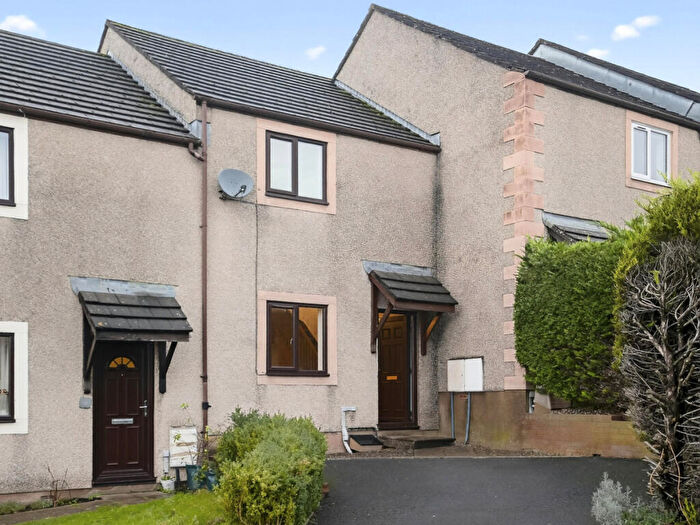
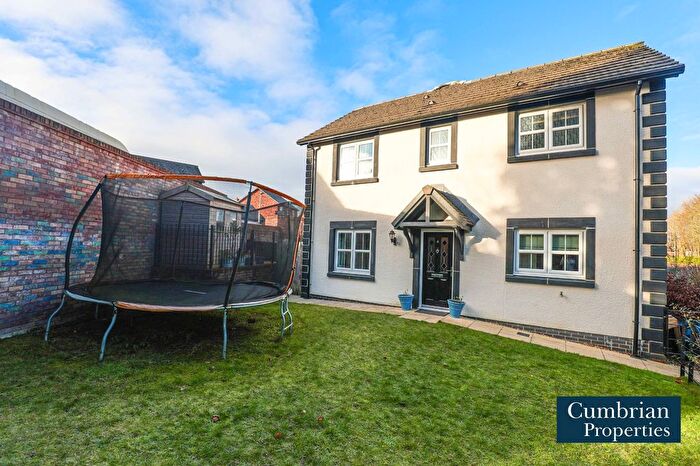
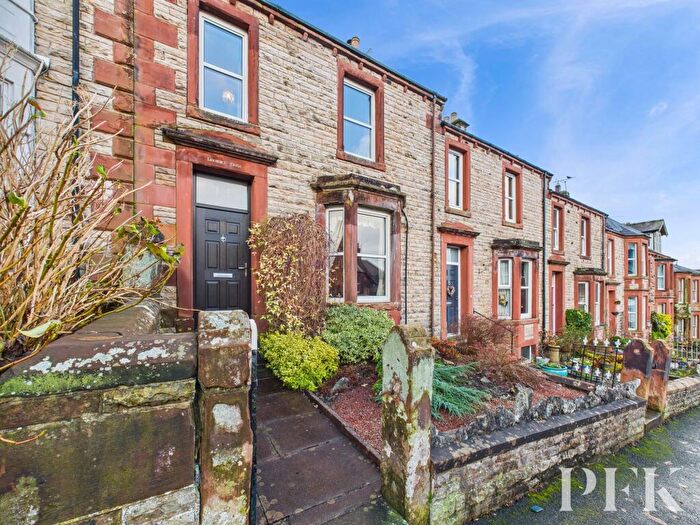
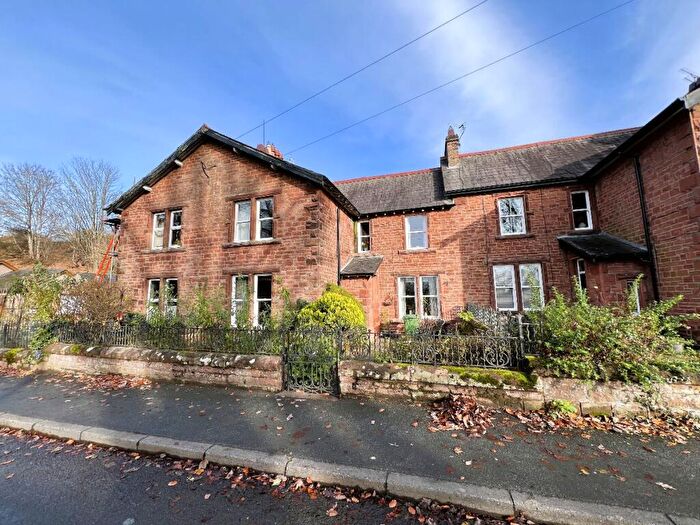
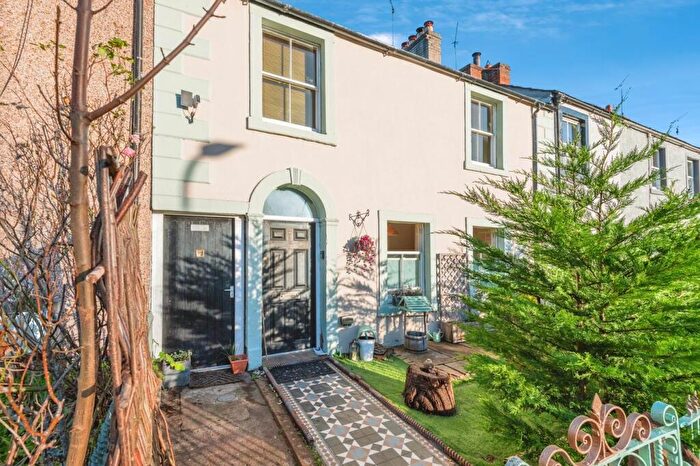
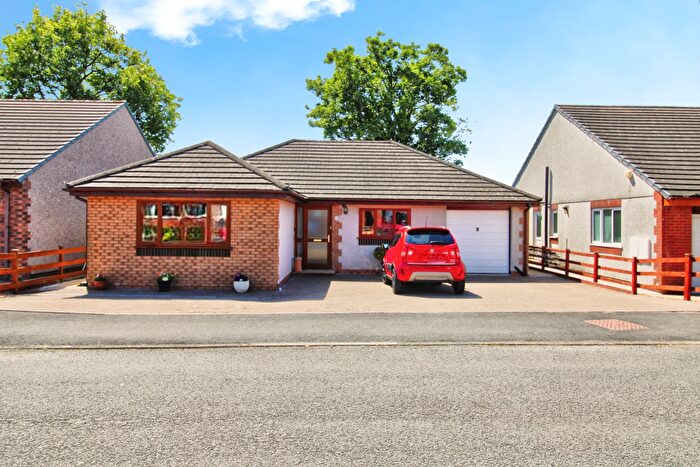
Properties for sale in Appleby (bongate)
Roads and Postcodes in Appleby (bongate)
Navigate through our locations to find the location of your next house in Appleby (bongate), Appleby-in-westmorland for sale or to rent.
| Streets | Postcodes |
|---|---|
| Back Lane | CA16 6UQ |
| Battlebarrow | CA16 6AA CA16 6XS CA16 6XT CA16 6XU |
| Beechcroft Mews | CA16 6US |
| Belgravia | CA16 6XZ |
| Bellevue Road | CA16 6TY |
| Bongate | CA16 6HR CA16 6HW CA16 6UE CA16 6UN CA16 6UP CA16 6HN CA16 6UW |
| Bridge End | CA16 6XL |
| Castle View Road | CA16 6HH |
| Clifford Street | CA16 6TS CA16 6TT |
| Cross Croft | CA16 6HP CA16 6DU |
| Crosscroft Industrial Estate | CA16 6HX |
| Drawbriggs Court | CA16 6JA |
| Drawbriggs Lane | CA16 6HT CA16 6HY CA16 6UG CA16 6LB |
| Drawbriggs Mount | CA16 6HL |
| Eden Terrace | CA16 6UB |
| Friary Fields | CA16 6UT |
| Friary Park | CA16 6XD |
| Garbridge Court | CA16 6JE |
| Garbridge Lane | CA16 6HZ |
| Garth Heads Road | CA16 6TN CA16 6TP CA16 6TR CA16 6TW CA16 6UD |
| Garths Head Rise | CA16 6HQ |
| Goldfinch Gardens | CA16 6FG |
| Goldington Drive | CA16 6FE |
| Heron Grove | CA16 6FJ |
| Honeywood Close | CA16 6FF |
| Hothfield Court | CA16 6JD |
| Hothfield Drive | CA16 6HJ |
| Hunriggs Lane | CA16 6JQ |
| Long Marton Road | CA16 6XX |
| Meadow Close | CA16 6TL |
| Meadow Court | CA16 6TJ |
| Middle Close | CA16 6SD |
| Midfield Mews | CA16 6SE |
| Mill Hill | CA16 6UR |
| Pear Tree Garth | CA16 6FH |
| Pembroke Street | CA16 6UA |
| Riverside Court | CA16 6BP |
| Rivington Park | CA16 6HU |
| Roman Road | CA16 6JB CA16 6JH |
| Romany Way | CA16 6XY |
| Rookery Lane | CA16 6FL |
| Salkeld Croft | CA16 6UJ |
| School Brow | CA16 6TB |
| St Michaels Lane | CA16 6UH |
| Station Road | CA16 6TX |
| Station Yard | CA16 6UL |
| Sycamore Close | CA16 6FP |
| Thanet Terrace | CA16 6TU |
| The Sands | CA16 6XN CA16 6XR CA16 6WZ |
| Westmorland Place | CA16 6SG |
| Westmorland Rise | CA16 6SJ CA16 6DW CA16 6DX |
| CA16 6XP |
Transport near Appleby (bongate)
-
Appleby Station
-
Kirkby Stephen Station
-
Langwathby Station
-
Penrith Station
-
Lazonby and Kirkoswald Station
- FAQ
- Price Paid By Year
- Property Type Price
Frequently asked questions about Appleby (bongate)
What is the average price for a property for sale in Appleby (bongate)?
The average price for a property for sale in Appleby (bongate) is £227,230. This amount is 10% lower than the average price in Appleby-in-westmorland. There are 287 property listings for sale in Appleby (bongate).
What streets have the most expensive properties for sale in Appleby (bongate)?
The streets with the most expensive properties for sale in Appleby (bongate) are Mill Hill at an average of £375,000, Drawbriggs Mount at an average of £340,500 and Bongate at an average of £337,500.
What streets have the most affordable properties for sale in Appleby (bongate)?
The streets with the most affordable properties for sale in Appleby (bongate) are School Brow at an average of £111,500, Bellevue Road at an average of £142,500 and Westmorland Rise at an average of £146,033.
Which train stations are available in or near Appleby (bongate)?
Some of the train stations available in or near Appleby (bongate) are Appleby, Kirkby Stephen and Langwathby.
Property Price Paid in Appleby (bongate) by Year
The average sold property price by year was:
| Year | Average Sold Price | Price Change |
Sold Properties
|
|---|---|---|---|
| 2025 | £255,000 | 21% |
26 Properties |
| 2024 | £200,250 | -32% |
26 Properties |
| 2023 | £263,619 | 21% |
21 Properties |
| 2022 | £209,397 | 9% |
44 Properties |
| 2021 | £190,628 | -9% |
39 Properties |
| 2020 | £207,226 | 10% |
42 Properties |
| 2019 | £187,050 | -9% |
61 Properties |
| 2018 | £204,568 | 16% |
51 Properties |
| 2017 | £172,021 | -12% |
85 Properties |
| 2016 | £192,275 | -9% |
61 Properties |
| 2015 | £209,807 | 27% |
28 Properties |
| 2014 | £154,170 | -5% |
35 Properties |
| 2013 | £161,382 | -13% |
26 Properties |
| 2012 | £182,970 | 17% |
25 Properties |
| 2011 | £152,176 | -21% |
25 Properties |
| 2010 | £184,282 | 19% |
23 Properties |
| 2009 | £148,852 | -26% |
24 Properties |
| 2008 | £187,307 | -9% |
21 Properties |
| 2007 | £203,593 | 10% |
32 Properties |
| 2006 | £183,908 | 6% |
57 Properties |
| 2005 | £173,479 | 4% |
47 Properties |
| 2004 | £166,503 | 21% |
33 Properties |
| 2003 | £130,721 | 22% |
44 Properties |
| 2002 | £101,537 | 11% |
45 Properties |
| 2001 | £90,868 | 16% |
29 Properties |
| 2000 | £76,685 | -5% |
27 Properties |
| 1999 | £80,847 | 10% |
47 Properties |
| 1998 | £72,928 | 3% |
40 Properties |
| 1997 | £70,762 | 16% |
32 Properties |
| 1996 | £59,270 | 13% |
30 Properties |
| 1995 | £51,602 | - |
17 Properties |
Property Price per Property Type in Appleby (bongate)
Here you can find historic sold price data in order to help with your property search.
The average Property Paid Price for specific property types in the last three years are:
| Property Type | Average Sold Price | Sold Properties |
|---|---|---|
| Semi Detached House | £202,628.00 | 39 Semi Detached Houses |
| Detached House | £340,090.00 | 33 Detached Houses |
| Terraced House | £195,611.00 | 27 Terraced Houses |
| Flat | £121,055.00 | 18 Flats |

