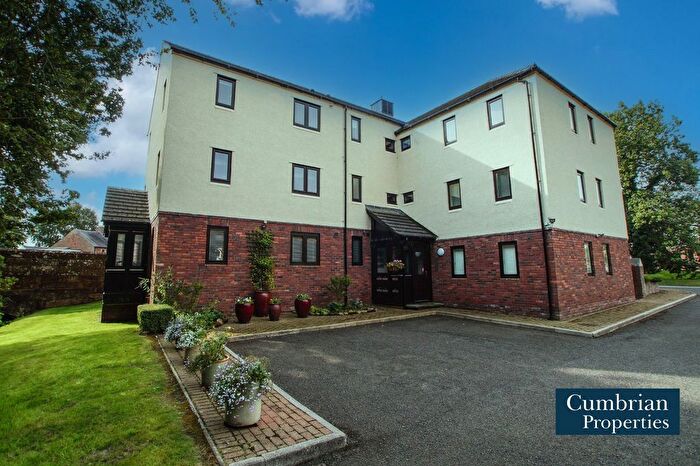
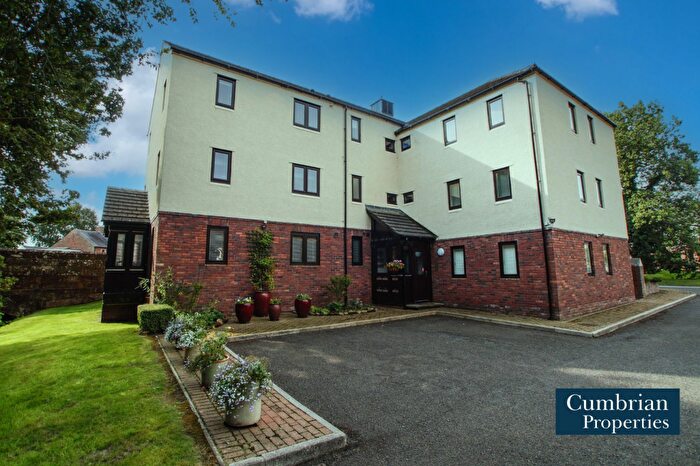
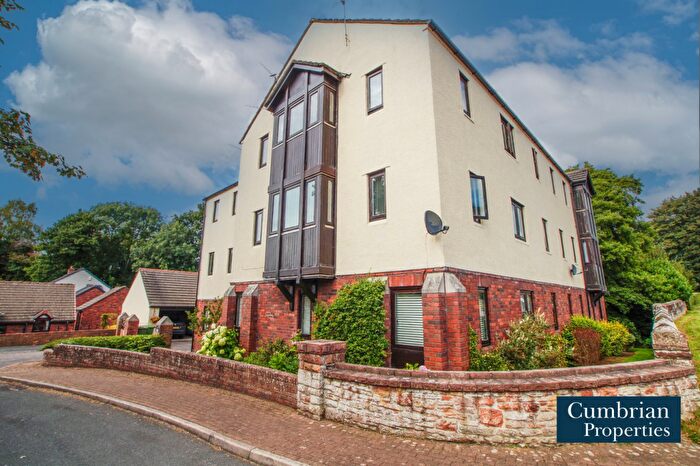
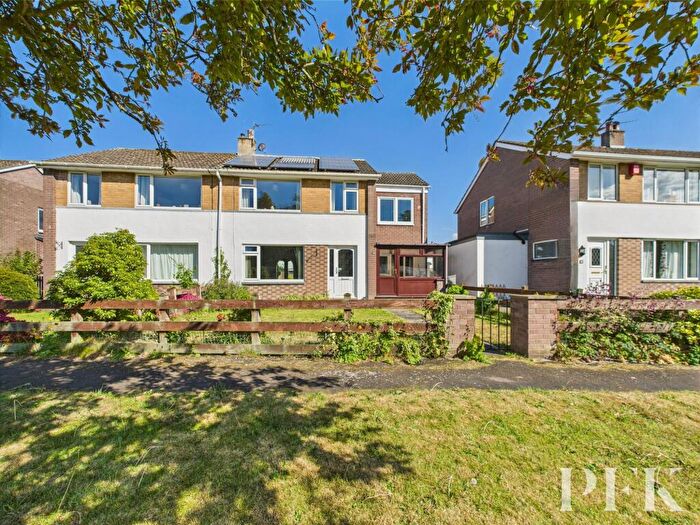
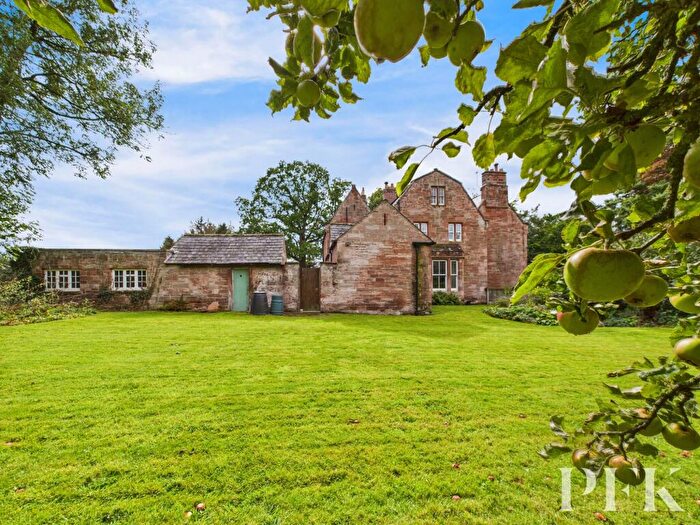
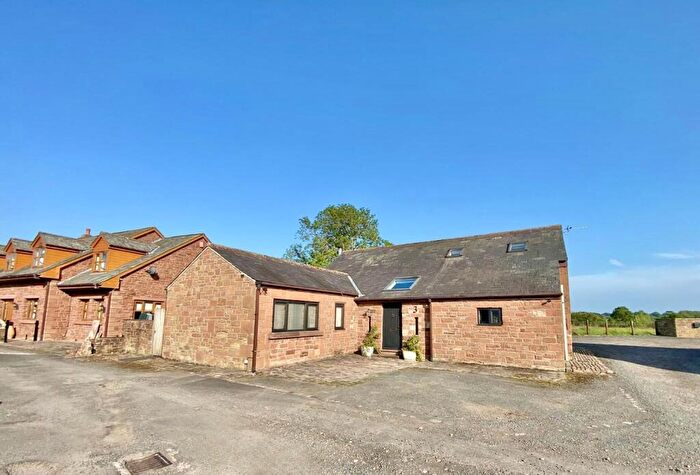
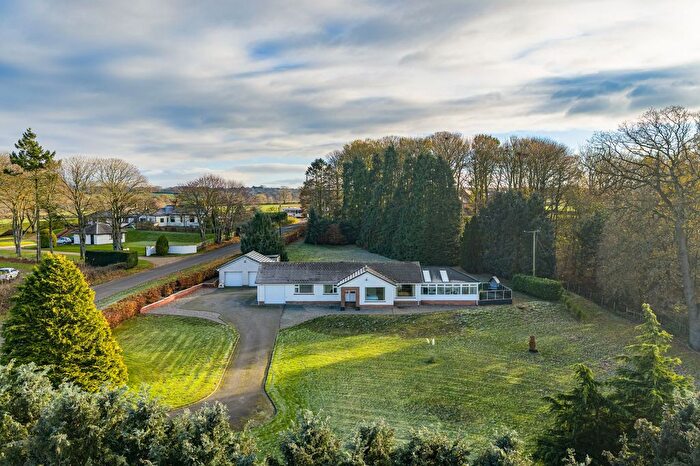
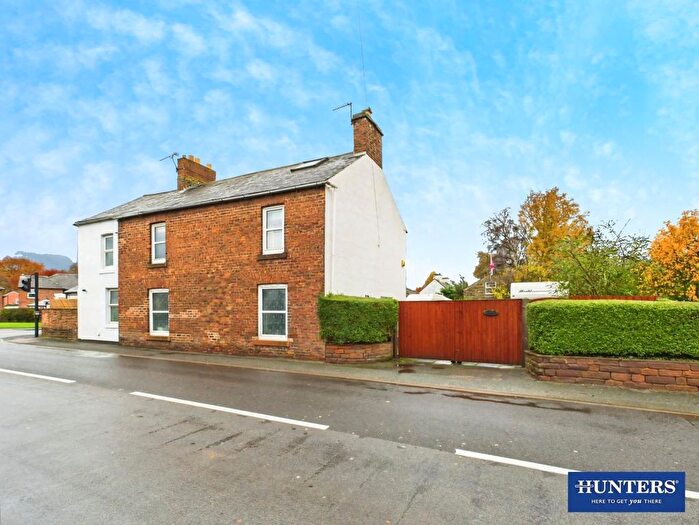
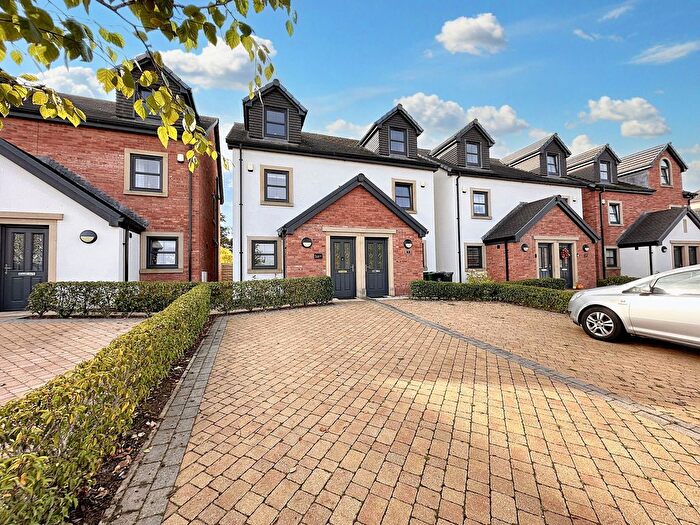
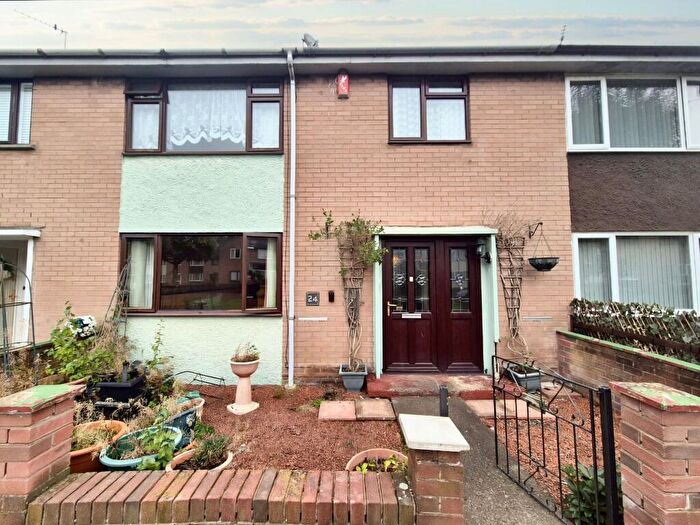
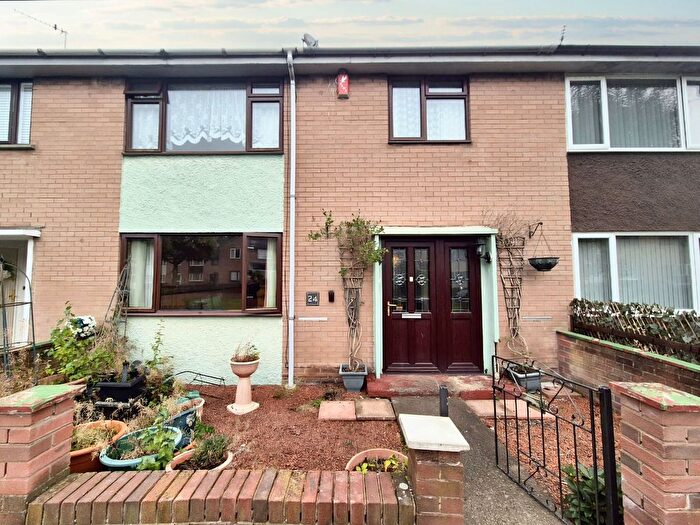
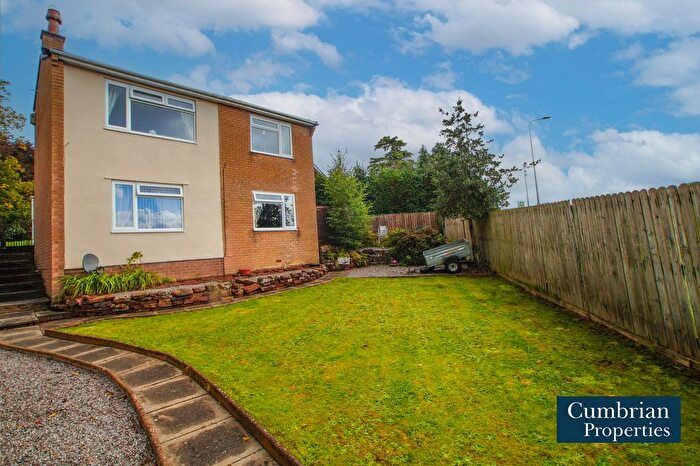
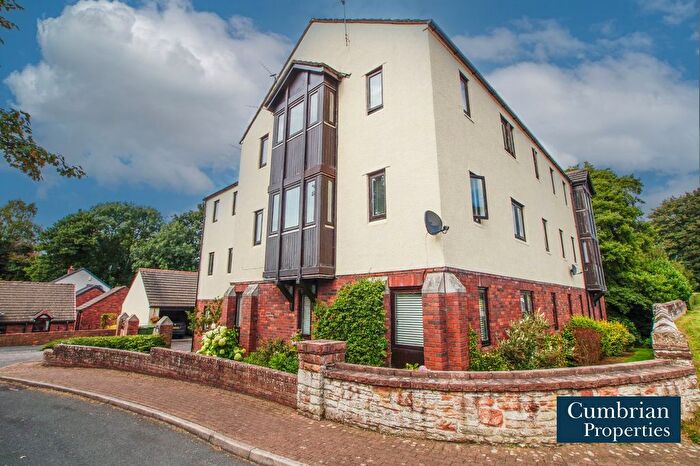
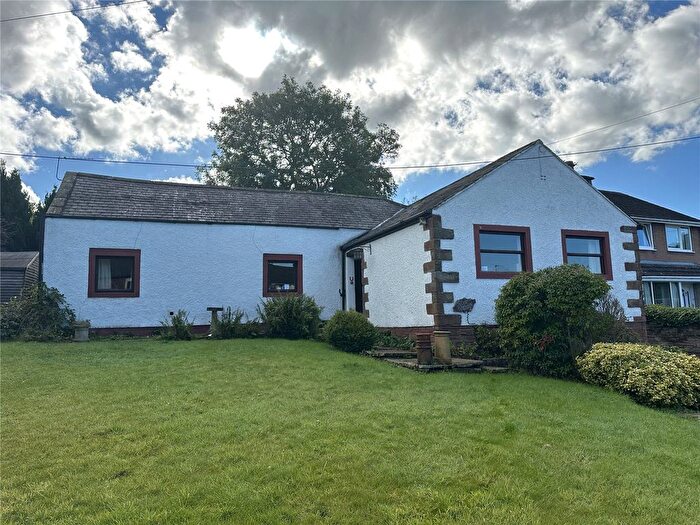
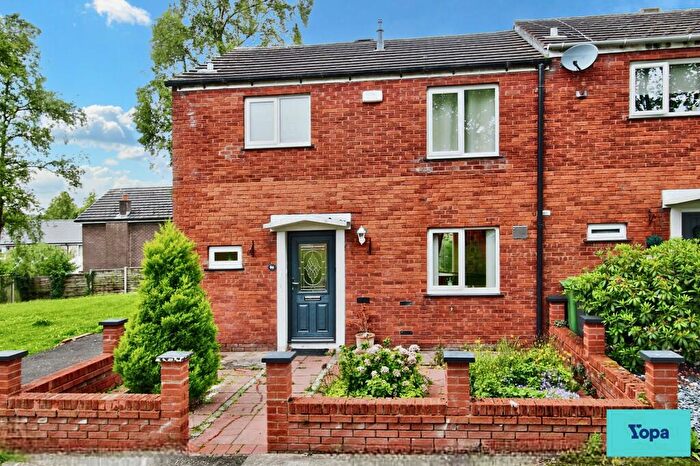
Houses for sale & to rent in Hayton, Carlisle
House Prices in Hayton
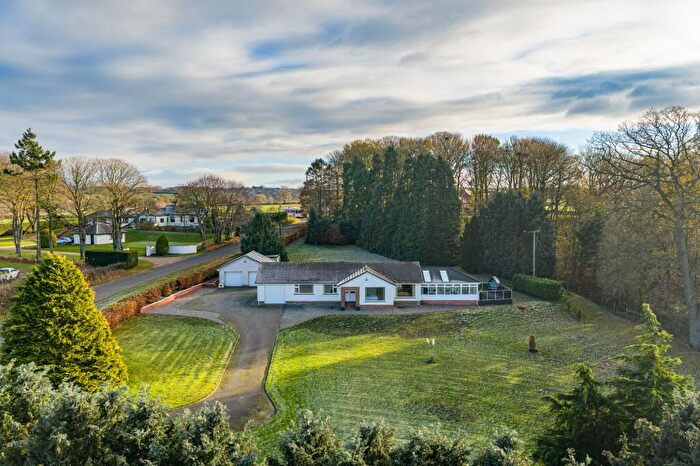
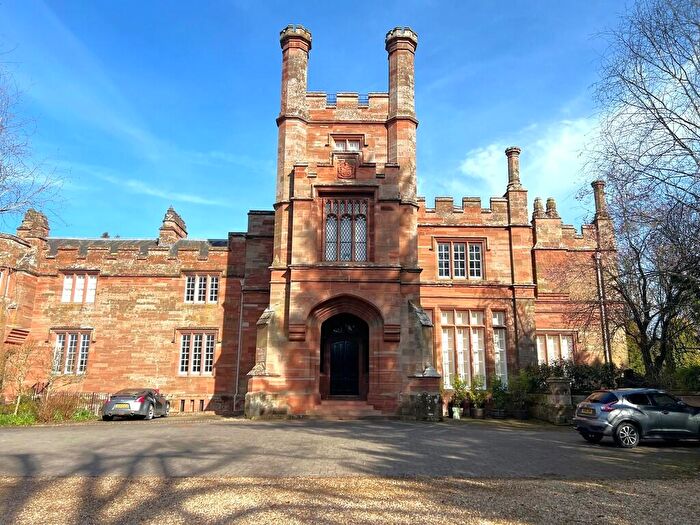
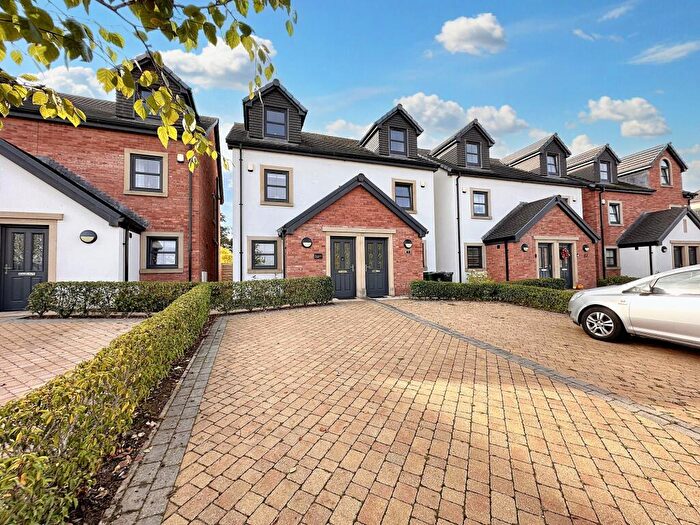
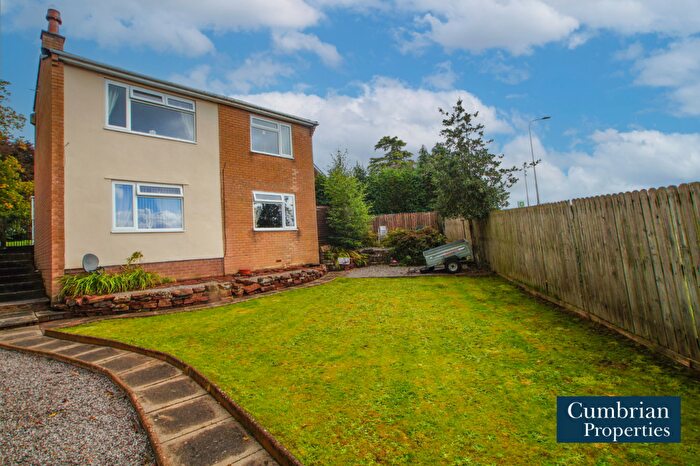
Properties in Hayton have an average house price of £203,929.00 and had 39 Property Transactions within the last 3 years¹.
Hayton is an area in Carlisle, Cumbria with 446 households², where the most expensive property was sold for £400,000.00.
Properties for sale in Hayton
Previously listed properties in Hayton
Roads and Postcodes in Hayton
Navigate through our locations to find the location of your next house in Hayton, Carlisle for sale or to rent.
| Streets | Postcodes |
|---|---|
| Cairn Crescent | CA4 8QH |
| Corby Hill | CA4 8PJ CA4 8PL CA4 8PN CA4 8PZ CA4 8QA CA4 8QB CA4 8QD CA4 8QG |
| Eden Cottages | CA4 8QL |
| Eden Grange | CA4 8QW |
| Hurley Road | CA4 8QF CA4 8QY |
| Langley Gardens | CA4 8PS |
| Little Corby Road | CA4 8QJ CA4 8QN CA4 8QQ |
| Millriggs | CA4 8QP CA4 8QR |
| Rose Bank Close | CA4 8QZ |
| CA4 8QS |
Transport near Hayton
- FAQ
- Price Paid By Year
- Property Type Price
Frequently asked questions about Hayton
What is the average price for a property for sale in Hayton?
The average price for a property for sale in Hayton is £203,929. This amount is 12% higher than the average price in Carlisle. There are 130 property listings for sale in Hayton.
What streets have the most expensive properties for sale in Hayton?
The streets with the most expensive properties for sale in Hayton are Corby Hill at an average of £254,551, Little Corby Road at an average of £247,500 and Hurley Road at an average of £210,136.
What streets have the most affordable properties for sale in Hayton?
The streets with the most affordable properties for sale in Hayton are Millriggs at an average of £146,214, Cairn Crescent at an average of £149,333 and Eden Grange at an average of £170,000.
Which train stations are available in or near Hayton?
Some of the train stations available in or near Hayton are Wetheral, Brampton (Cumbria) and Carlisle.
Property Price Paid in Hayton by Year
The average sold property price by year was:
| Year | Average Sold Price | Price Change |
Sold Properties
|
|---|---|---|---|
| 2025 | £175,906 | -19% |
8 Properties |
| 2024 | £209,266 | -2% |
15 Properties |
| 2023 | £212,937 | 2% |
16 Properties |
| 2022 | £209,055 | 3% |
9 Properties |
| 2021 | £202,126 | 3% |
16 Properties |
| 2020 | £197,000 | 25% |
17 Properties |
| 2019 | £147,300 | -44% |
15 Properties |
| 2018 | £212,303 | 21% |
14 Properties |
| 2017 | £166,892 | 16% |
14 Properties |
| 2016 | £139,895 | -9% |
10 Properties |
| 2015 | £153,131 | -2% |
11 Properties |
| 2014 | £155,749 | -4% |
16 Properties |
| 2013 | £161,780 | 8% |
21 Properties |
| 2012 | £149,428 | -27% |
7 Properties |
| 2011 | £189,772 | 32% |
11 Properties |
| 2010 | £129,708 | -29% |
12 Properties |
| 2009 | £166,750 | -43% |
8 Properties |
| 2008 | £238,750 | 10% |
4 Properties |
| 2007 | £214,084 | 24% |
25 Properties |
| 2006 | £162,720 | 3% |
34 Properties |
| 2005 | £157,216 | 17% |
15 Properties |
| 2004 | £130,565 | 17% |
13 Properties |
| 2003 | £108,972 | 17% |
20 Properties |
| 2002 | £90,702 | 24% |
17 Properties |
| 2001 | £68,864 | 0,1% |
17 Properties |
| 2000 | £68,777 | 30% |
24 Properties |
| 1999 | £48,479 | -32% |
12 Properties |
| 1998 | £64,233 | -0,5% |
15 Properties |
| 1997 | £64,532 | 15% |
26 Properties |
| 1996 | £55,065 | 11% |
13 Properties |
| 1995 | £49,055 | - |
9 Properties |
Property Price per Property Type in Hayton
Here you can find historic sold price data in order to help with your property search.
The average Property Paid Price for specific property types in the last three years are:
| Property Type | Average Sold Price | Sold Properties |
|---|---|---|
| Semi Detached House | £177,062.00 | 16 Semi Detached Houses |
| Terraced House | £176,000.00 | 11 Terraced Houses |
| Detached House | £265,354.00 | 12 Detached Houses |

