
Houses for sale & to rent in Carlisle, Cumbria
House Prices in Carlisle
Properties in Carlisle have an average house price of £184k and had 5,260 Property Transactions within the last 3 years.¹
Carlisle is an area in Cumbria with 46,235 households², where the most expensive property was sold for £1.2M.
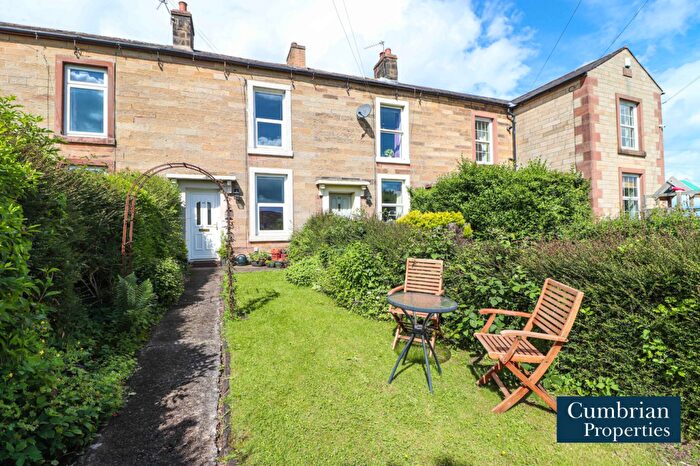
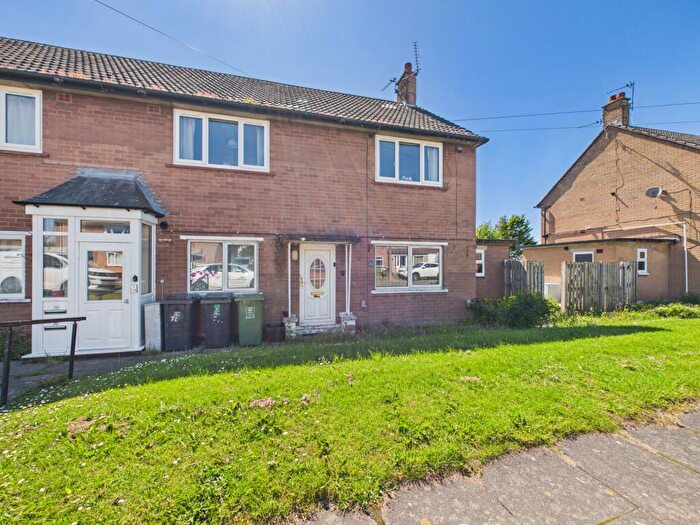
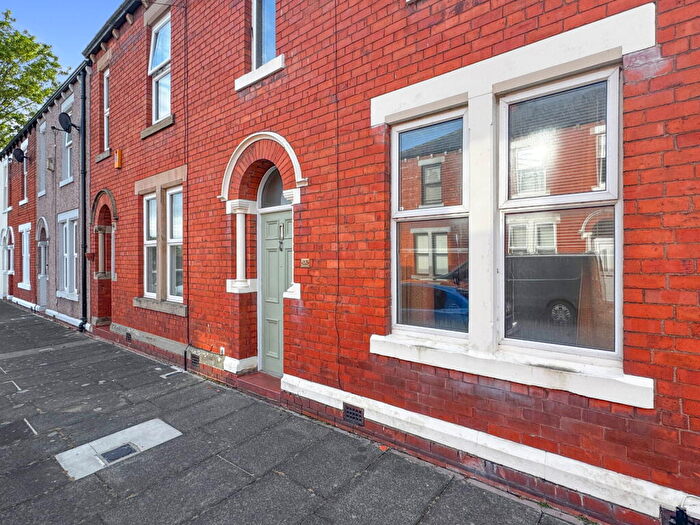
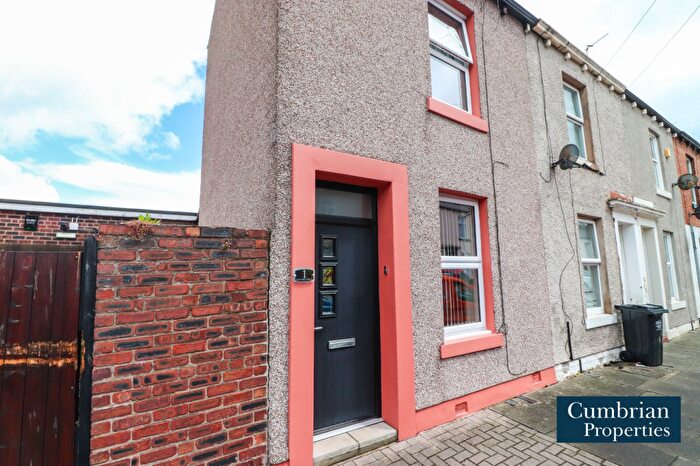
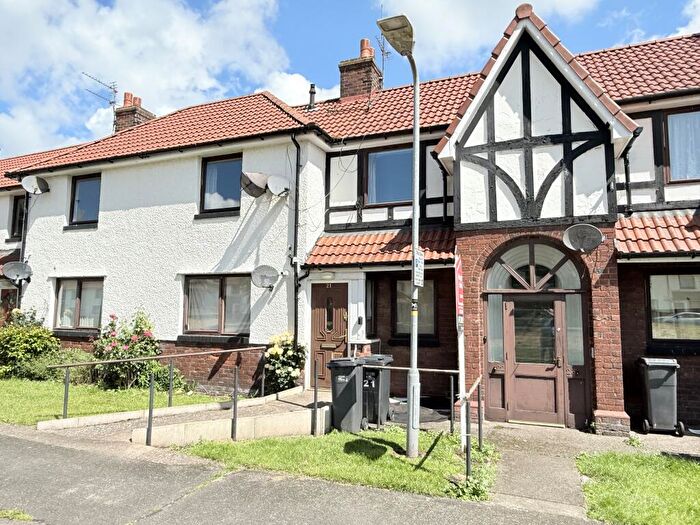
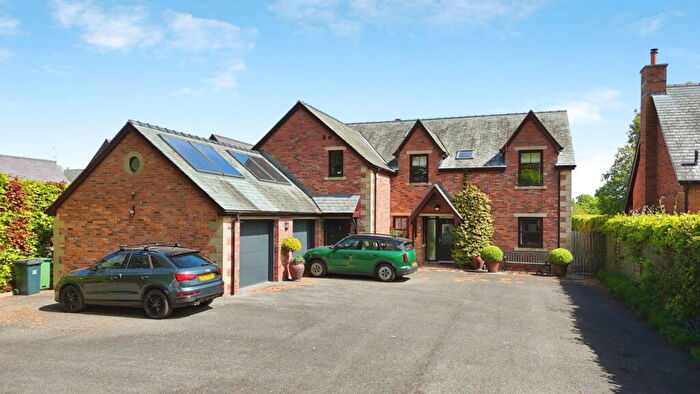
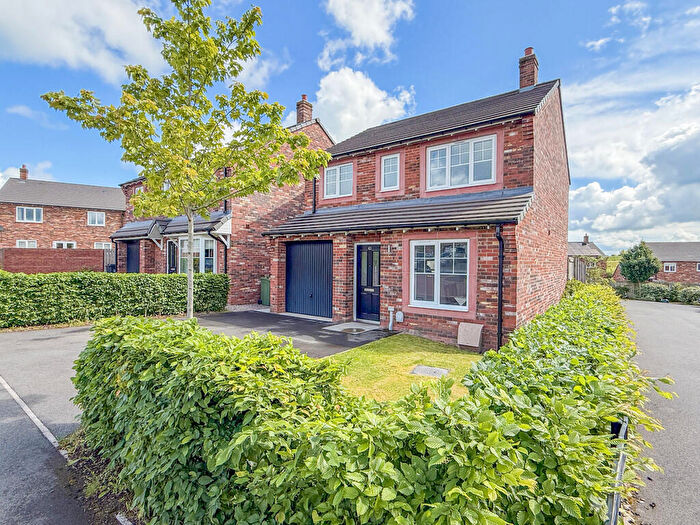
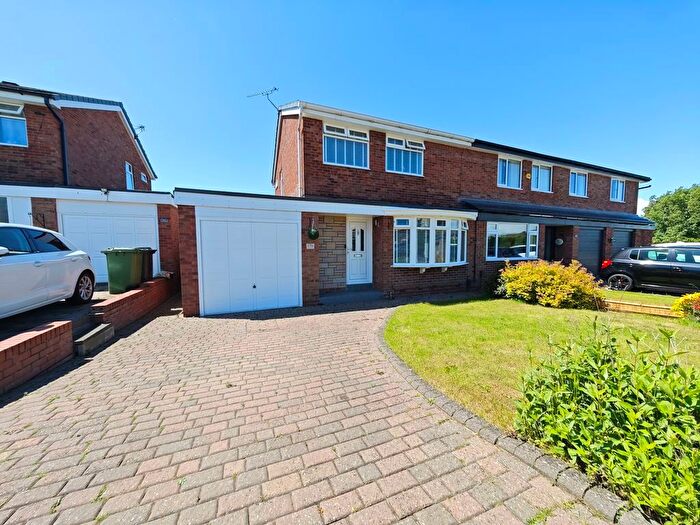
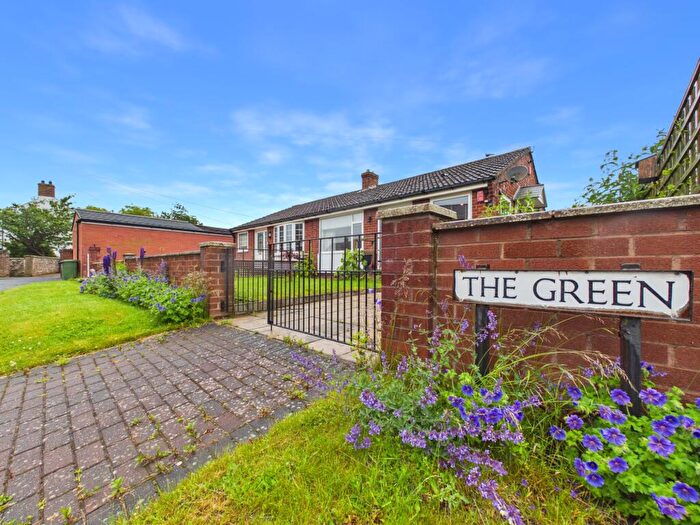
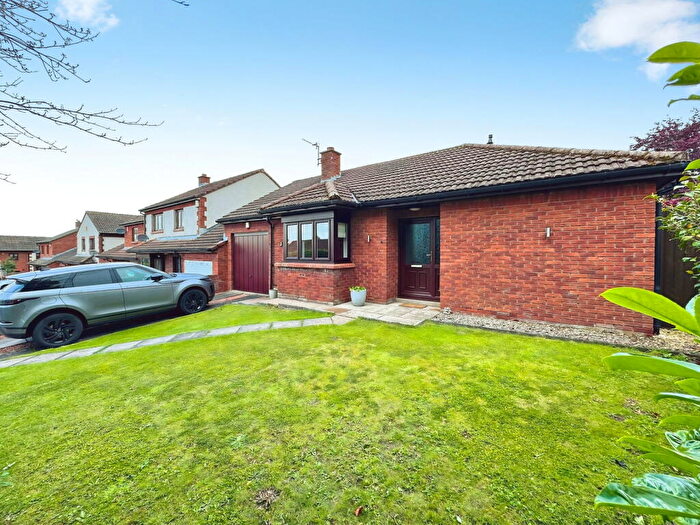
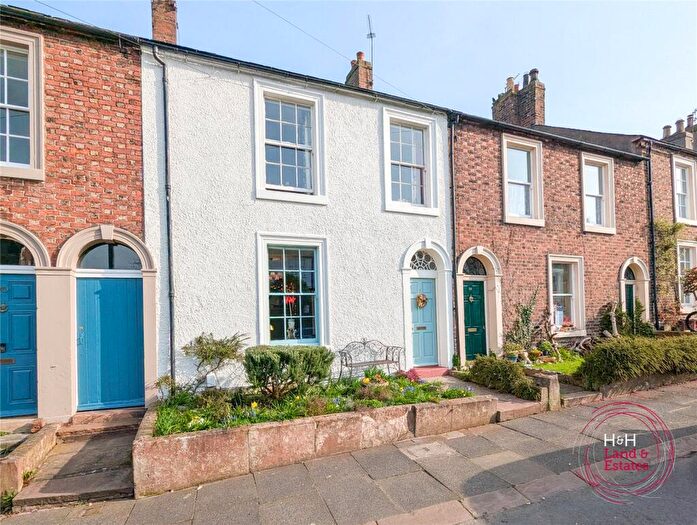
Properties for sale in Carlisle
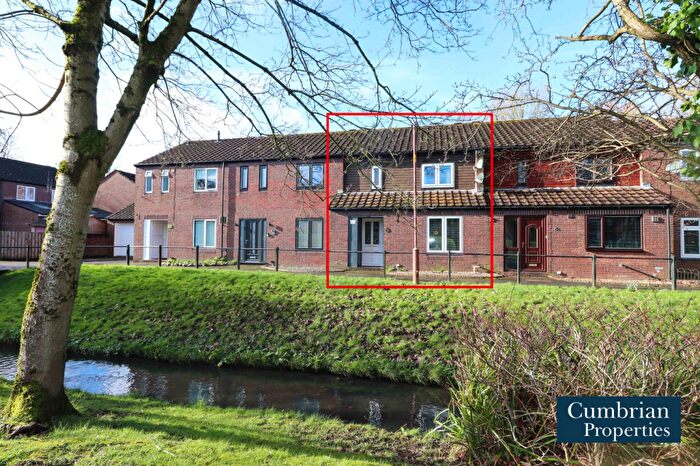
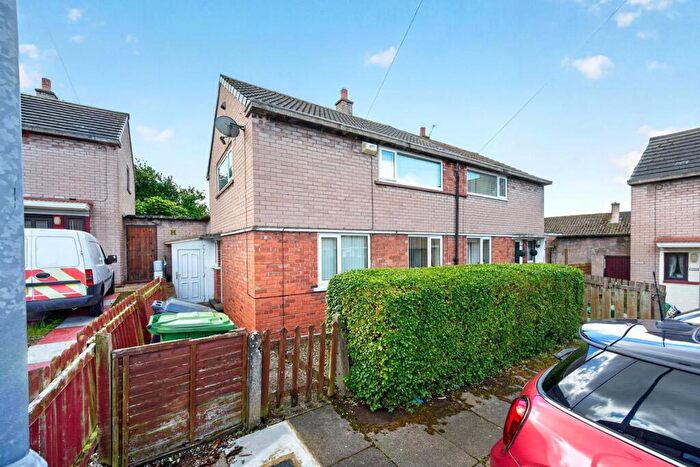
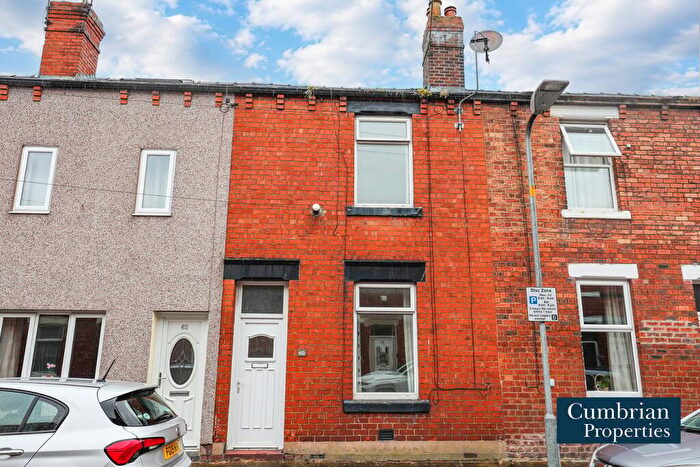
![]()
If you are looking to sell your house, let it out, or receive a property valuation, an expert can help you.
Click the button below to get started.

Neighbourhoods in Carlisle
Navigate through our locations to find the location of your next house in Carlisle, Cumbria for sale or to rent.
- Belah
- Belle Vue
- Botcherby
- Brampton
- Burgh
- Castle
- Currock
- Dalston
- Denton Holme
- Great Corby And Geltsdale
- Harraby
- Hayton
- Hesket
- Irthing
- Kirkoswald
- Lazonby
- Longtown And Rockcliffe
- Lyne
- Marsh
- Morton
- Skelton
- St Aidans
- Stanwix Rural
- Stanwix Urban
- Upperby
- Wampool
- Warnell
- Wetheral
- Yewdale
- Cathedral & Castle
- Botcherby & Harraby North
- Harraby South & Parklands
- Dalston & Burgh
- Currock & Upperby
- Denton Holme & Morton South
- Sandsfield & Morton West
- Newtown & Morton North
- Belah & Kingmoor
- Stanwix & Houghton
- Wetheral & Corby
- Brampton & Fellside
- Longtown & the Border
- Marsh & Wampool
- Houghton And Irthington
- Dalston And Burgh
- Corby And Hayton
- Alston And Fellside
- Longtown
- Harraby North
- Harraby South
Transport in Carlisle
Please see below transportation links in this area:

- FAQ
- Price Paid By Year
- Property Type Price
Frequently asked questions about Carlisle
What is the average price for a property for sale in Carlisle?
The average price for a property for sale in Carlisle is £183,687. This amount is 18% lower than the average price in Cumbria. There are more than 10,000 property listings for sale in Carlisle.
What locations have the most expensive properties for sale in Carlisle?
The locations with the most expensive properties for sale in Carlisle are Brampton at an average of £452,500, Skelton at an average of £420,000 and Irthing at an average of £402,000.
What locations have the most affordable properties for sale in Carlisle?
The locations with the most affordable properties for sale in Carlisle are Currock at an average of £116,832, St Aidans at an average of £119,450 and Denton Holme at an average of £122,408.
Which train stations are available in or near Carlisle?
Some of the train stations available in or near Carlisle are Carlisle, Wetheral and Dalston.
Property Price Paid in Carlisle by Year
The average sold property price by year was:
| Year | Average Sold Price | Price Change |
Sold Properties
|
|---|---|---|---|
| 2026 | £211,252 | 10% |
121 Properties |
| 2025 | £190,953 | 4% |
1,614 Properties |
| 2024 | £183,110 | 4% |
1,760 Properties |
| 2023 | £175,726 | -4% |
1,765 Properties |
| 2022 | £182,370 | 6% |
1,999 Properties |
| 2021 | £172,087 | 2% |
2,424 Properties |
| 2020 | £168,542 | 5% |
1,836 Properties |
| 2019 | £160,378 | 1% |
2,055 Properties |
| 2018 | £158,011 | 3% |
2,205 Properties |
| 2017 | £154,058 | 2% |
2,139 Properties |
| 2016 | £151,677 | 3% |
1,916 Properties |
| 2015 | £147,881 | 4% |
1,992 Properties |
| 2014 | £142,158 | 3% |
1,844 Properties |
| 2013 | £137,730 | -0,2% |
1,500 Properties |
| 2012 | £138,073 | -1% |
1,187 Properties |
| 2011 | £140,032 | 1% |
1,279 Properties |
| 2010 | £139,292 | 2% |
1,282 Properties |
| 2009 | £136,592 | -4% |
1,150 Properties |
| 2008 | £142,536 | -2% |
1,228 Properties |
| 2007 | £145,313 | 8% |
2,641 Properties |
| 2006 | £133,652 | 6% |
2,625 Properties |
| 2005 | £126,003 | 8% |
2,182 Properties |
| 2004 | £116,293 | 20% |
2,441 Properties |
| 2003 | £93,041 | 23% |
2,684 Properties |
| 2002 | £72,060 | 14% |
2,611 Properties |
| 2001 | £62,148 | 3% |
2,336 Properties |
| 2000 | £60,578 | 6% |
1,989 Properties |
| 1999 | £57,104 | 2% |
2,013 Properties |
| 1998 | £55,834 | 5% |
1,811 Properties |
| 1997 | £53,015 | 3% |
1,739 Properties |
| 1996 | £51,234 | 4% |
1,704 Properties |
| 1995 | £49,332 | - |
1,435 Properties |
Property Price per Property Type in Carlisle
Here you can find historic sold price data in order to help with your property search.
The average Property Paid Price for specific property types in the last three years are:
| Property Type | Average Sold Price | Sold Properties |
|---|---|---|
| Semi Detached House | £178,430.00 | 1,789 Semi Detached Houses |
| Terraced House | £131,844.00 | 1,976 Terraced Houses |
| Detached House | £315,878.00 | 1,094 Detached Houses |
| Flat | £101,961.00 | 401 Flats |