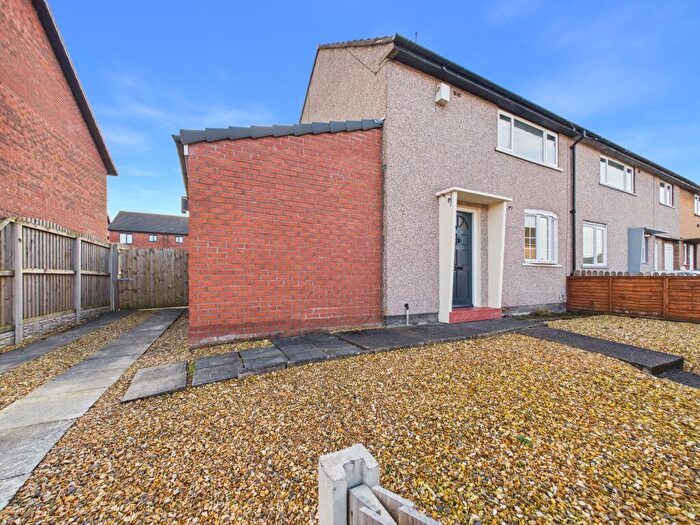
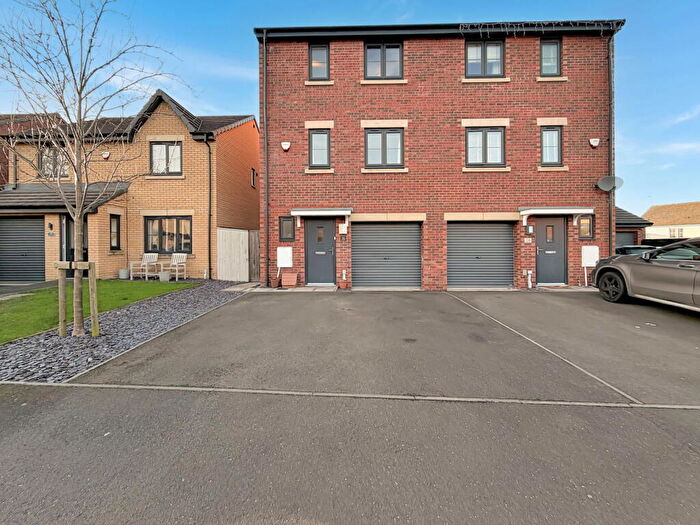
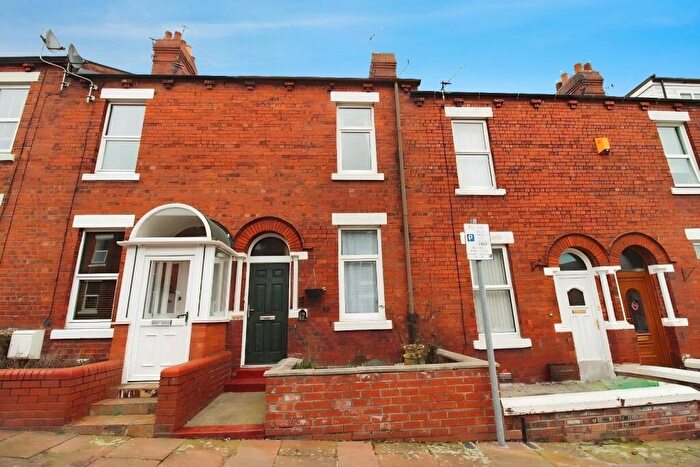
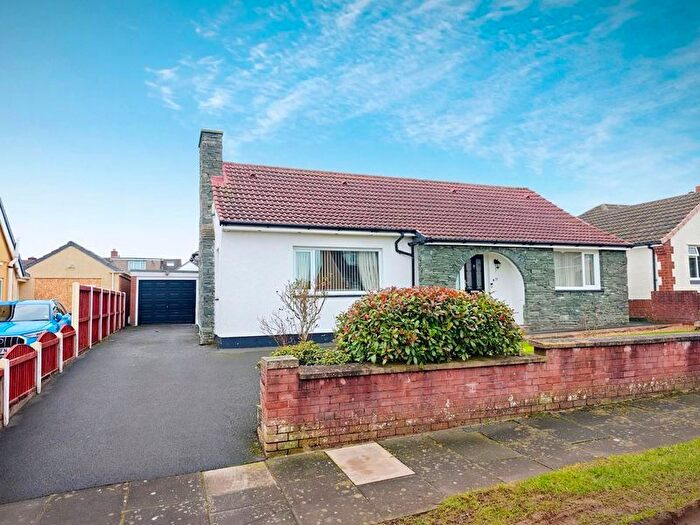
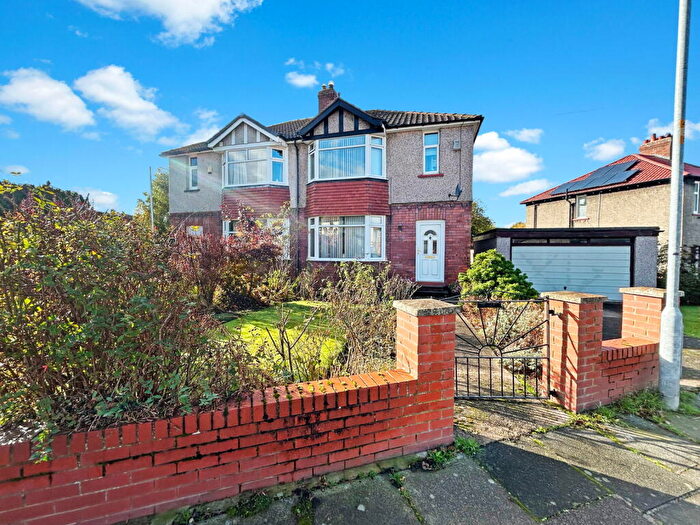
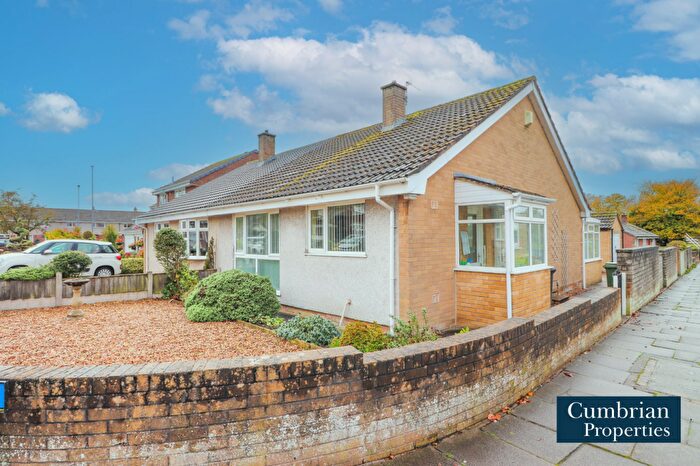
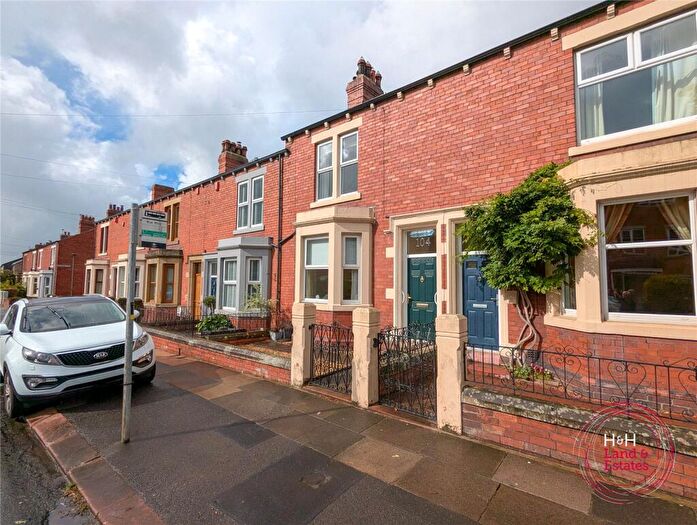
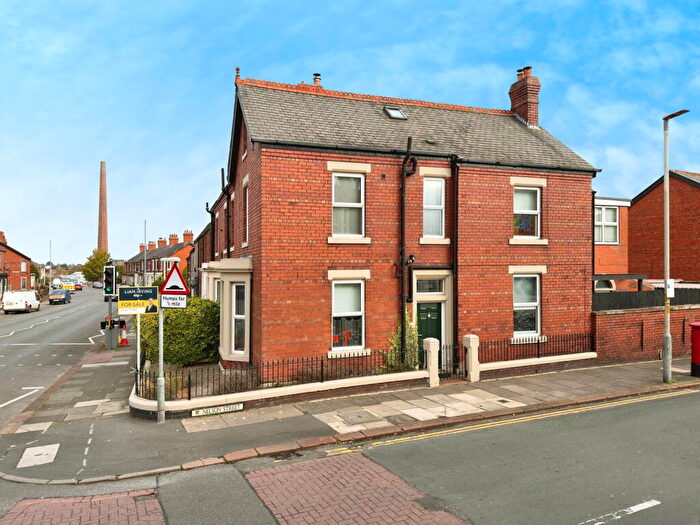
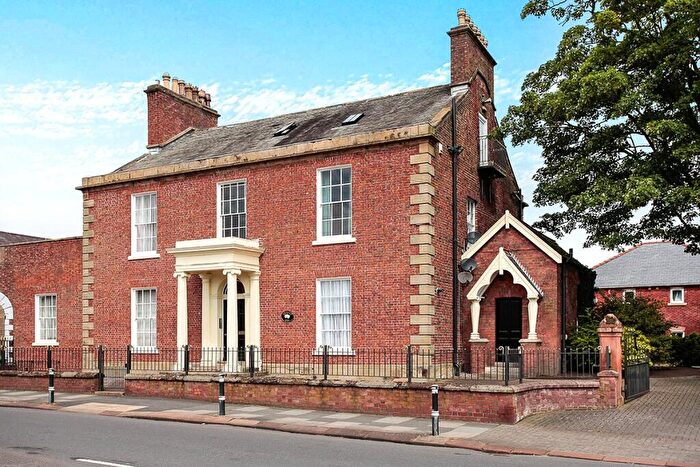
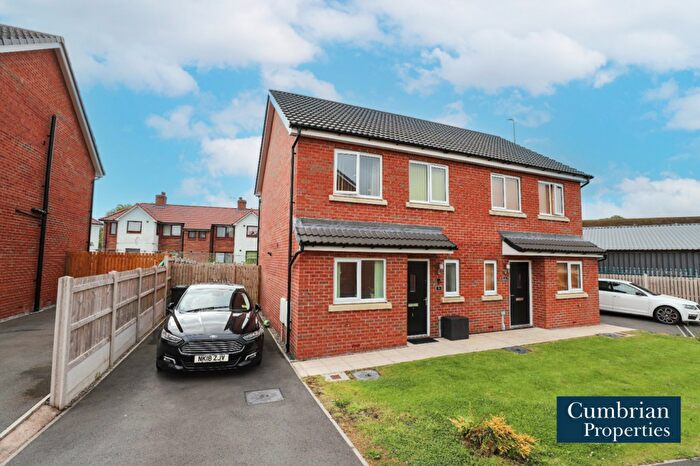
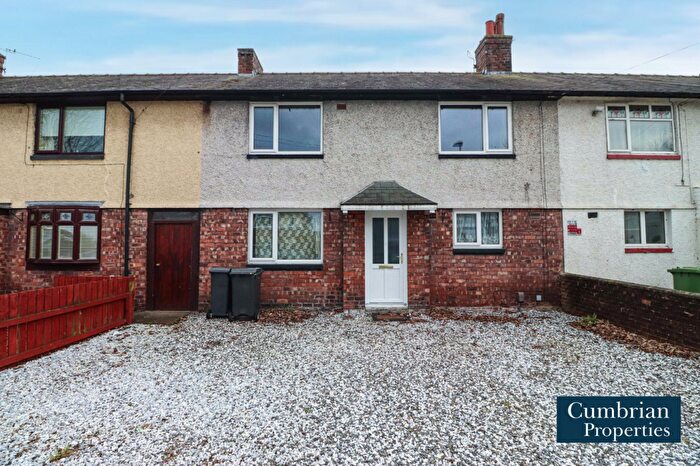
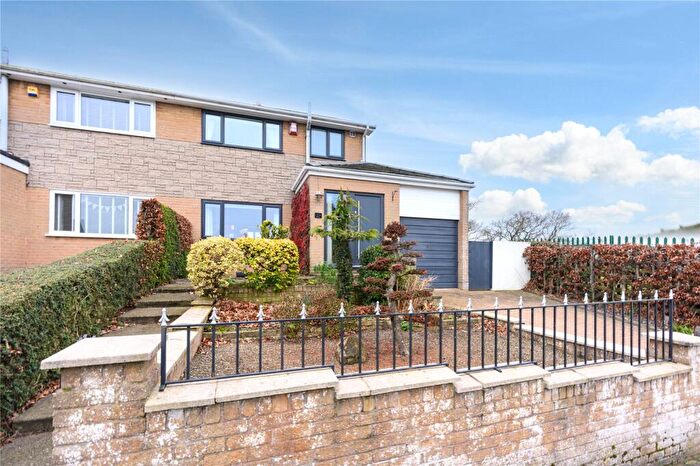
Houses for sale & to rent in Morton, Carlisle
House Prices in Morton
Properties in Morton have an average house price of £140,787.00 and had 252 Property Transactions within the last 3 years¹.
Morton is an area in Carlisle, Cumbria with 2,821 households², where the most expensive property was sold for £340,000.00.
Properties for sale in Morton
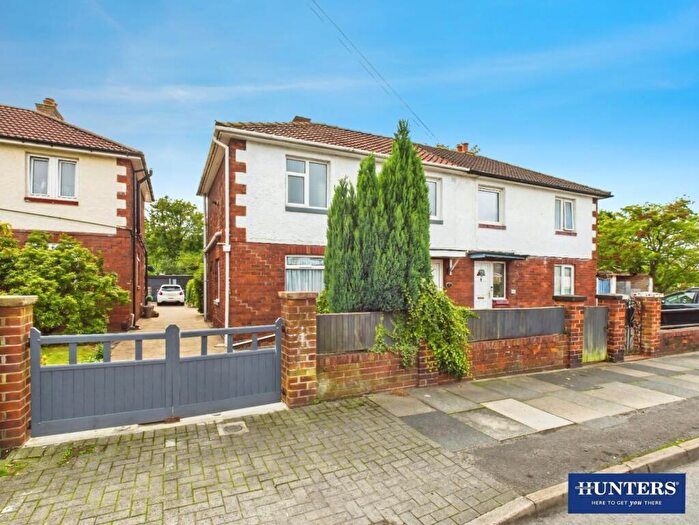
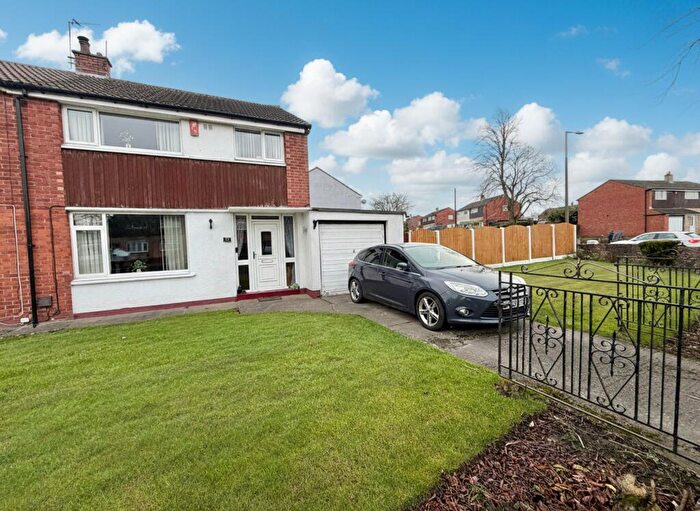
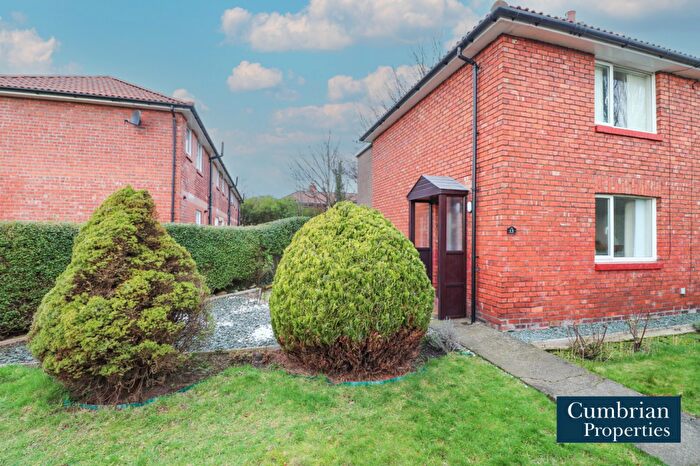
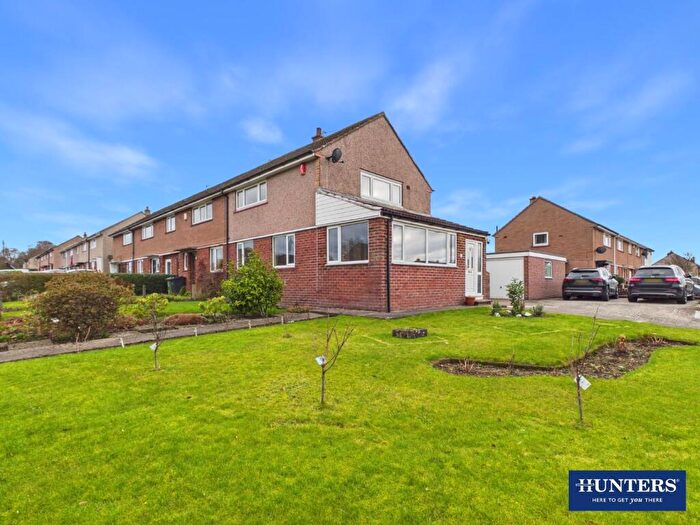
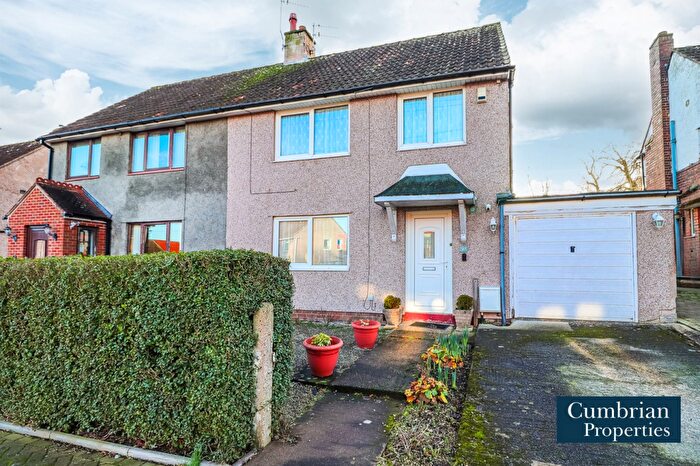
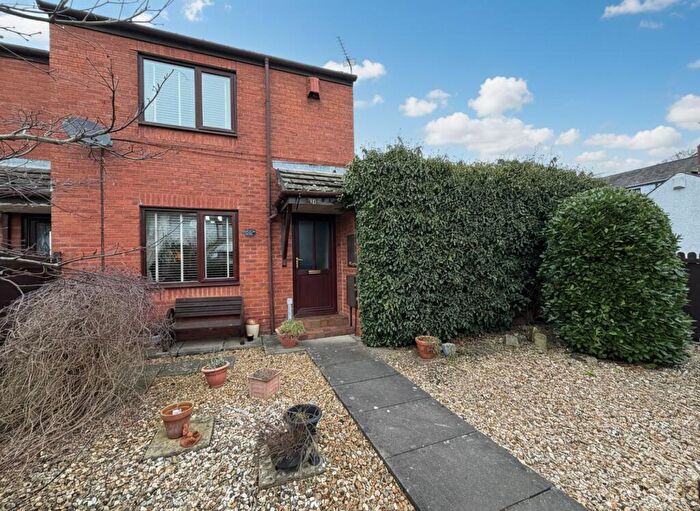
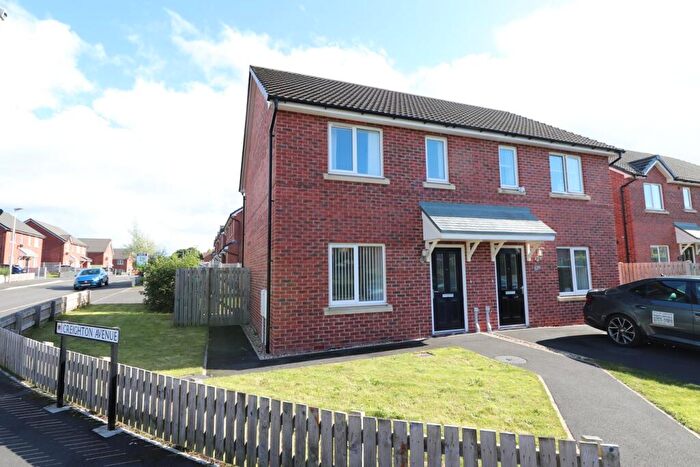
Previously listed properties in Morton
Roads and Postcodes in Morton
Navigate through our locations to find the location of your next house in Morton, Carlisle for sale or to rent.
| Streets | Postcodes |
|---|---|
| Abbots Road | CA2 5PZ |
| Ashness Drive | CA2 6NF CA2 6NG |
| Bannisdale Way | CA2 6LR |
| Bedford Road | CA2 5QE |
| Borrowdale Gardens | CA2 5RE |
| Borrowdale Road | CA2 5QZ CA2 5RD |
| Briery Grove | CA2 6LL |
| Brownrigg Drive | CA2 6NX CA2 6PA |
| Burnrigg | CA2 6QG CA2 6QH |
| Buttermere Close | CA2 5QH |
| Castlerigg Drive | CA2 6PF CA2 6PG |
| Chestnut Hill | CA2 6LW |
| Dalston Road | CA2 5PJ CA2 5PN CA2 6DY CA2 6HA |
| Deepdale Drive | CA2 6LS |
| Dunmail Drive | CA2 6DE CA2 6DF CA2 6DG CA2 6DQ |
| Dunmallet Rigg | CA2 6NS CA2 6NT CA2 6NU |
| Ellesmere Way | CA2 6LZ CA2 6NA |
| Eskdale Avenue | CA2 5QY CA2 5RA |
| Fairfield Gardens | CA2 7EW |
| Glendale Rise | CA2 6ND CA2 6NJ |
| Greenside Road | CA2 6HN CA2 6HP |
| Greta Avenue | CA2 5RH CA2 5RJ |
| Hallin Crescent | CA2 6JA |
| Highfield Avenue | CA2 6NH |
| Irton Place | CA2 6LX |
| Kelvin Grove | CA2 6HE |
| Kentmere Grove | CA2 6JD |
| Kingrigg | CA2 6QF |
| Kirkstone Crescent | CA2 5QW |
| Langdale Avenue | CA2 5QG |
| Langrigg Road | CA2 6DH CA2 6DJ CA2 6DT CA2 6DX |
| Levens Drive | CA2 6HY CA2 6HZ CA2 6JB CA2 6JE CA2 6JF |
| Lowther Browns Lonning | CA2 6PB |
| Lyndhurst Gardens | CA2 6NL |
| Middle Rigg | CA2 6NY |
| Millbeck | CA2 6NN |
| Morton Rigg | CA2 6QE |
| Mossrigg | CA2 6PN |
| Newlaithes Avenue | CA2 6PP CA2 6PS CA2 6PU CA2 6PW CA2 6PX CA2 6PY CA2 6QB CA2 6QD |
| Park Road | CA2 6DL CA2 6DS |
| Raiselands Road | CA2 6HJ |
| Rashdall Road | CA2 6HR CA2 6HS |
| Robert Chance Gardens | CA2 6QS |
| Rosehill Drive | CA2 6HL |
| Sandalwood Drive | CA2 6DN |
| Scawfell Road | CA2 5QL CA2 5QQ |
| Seatoller Close | CA2 6LQ |
| Shap Grove | CA2 5QR |
| Skiddaw Road | CA2 5QF CA2 5QN CA2 5QS CA2 5QX |
| Stonegarth | CA2 6NR CA2 6PD CA2 6PE CA2 6PH CA2 6PJ CA2 6PL CA2 6PQ |
| Ullswater Road | CA2 5RF CA2 5RG CA2 5RL CA2 5RQ |
| Wansfell Avenue | CA2 6HD |
| Wastwater Close | CA2 5QJ |
| Westrigg Road | CA2 6LD CA2 6LE CA2 6LF CA2 6LH |
| Whinlatter Way | CA2 5QP |
| Whinrigg | CA2 6QQ |
| Wigton Road | CA2 6JN CA2 6JR CA2 6JX CA2 6JY CA2 7EL CA2 7EN |
| Windermere Road | CA2 5RB |
| Winscale Way | CA2 6HG CA2 6HQ CA2 6HT CA2 6HW |
| Woodend Drive | CA2 6HB CA2 6HF |
Transport near Morton
-
Carlisle Station
-
Dalston Station
-
Wetheral Station
-
Wigton Station
-
Armathwaite Station
-
Gretna Green Station
- FAQ
- Price Paid By Year
- Property Type Price
Frequently asked questions about Morton
What is the average price for a property for sale in Morton?
The average price for a property for sale in Morton is £140,787. This amount is 23% lower than the average price in Carlisle. There are 1,079 property listings for sale in Morton.
What streets have the most expensive properties for sale in Morton?
The streets with the most expensive properties for sale in Morton are Park Road at an average of £340,000, Wansfell Avenue at an average of £250,000 and Dalston Road at an average of £241,618.
What streets have the most affordable properties for sale in Morton?
The streets with the most affordable properties for sale in Morton are Irton Place at an average of £46,000, Borrowdale Gardens at an average of £51,000 and Fairfield Gardens at an average of £70,000.
Which train stations are available in or near Morton?
Some of the train stations available in or near Morton are Carlisle, Dalston and Wetheral.
Property Price Paid in Morton by Year
The average sold property price by year was:
| Year | Average Sold Price | Price Change |
Sold Properties
|
|---|---|---|---|
| 2025 | £153,894 | 8% |
62 Properties |
| 2024 | £142,320 | 8% |
93 Properties |
| 2023 | £130,939 | -30% |
97 Properties |
| 2022 | £170,287 | 24% |
100 Properties |
| 2021 | £129,572 | 4% |
116 Properties |
| 2020 | £124,765 | 11% |
80 Properties |
| 2019 | £110,590 | -4% |
90 Properties |
| 2018 | £115,261 | 4% |
108 Properties |
| 2017 | £110,934 | 1% |
82 Properties |
| 2016 | £109,286 | -0,2% |
98 Properties |
| 2015 | £109,534 | 3% |
100 Properties |
| 2014 | £106,112 | 12% |
94 Properties |
| 2013 | £93,247 | -12% |
80 Properties |
| 2012 | £104,560 | 3% |
64 Properties |
| 2011 | £101,939 | -6% |
52 Properties |
| 2010 | £108,475 | 6% |
70 Properties |
| 2009 | £102,185 | -7% |
48 Properties |
| 2008 | £109,118 | -4% |
49 Properties |
| 2007 | £113,622 | 4% |
110 Properties |
| 2006 | £108,816 | 8% |
130 Properties |
| 2005 | £99,723 | 12% |
91 Properties |
| 2004 | £87,693 | 17% |
72 Properties |
| 2003 | £72,743 | 28% |
100 Properties |
| 2002 | £52,039 | 6% |
83 Properties |
| 2001 | £49,122 | 3% |
84 Properties |
| 2000 | £47,764 | 8% |
77 Properties |
| 1999 | £44,110 | -0,3% |
104 Properties |
| 1998 | £44,246 | 7% |
89 Properties |
| 1997 | £41,114 | -2% |
70 Properties |
| 1996 | £41,889 | -2% |
58 Properties |
| 1995 | £42,865 | - |
52 Properties |
Property Price per Property Type in Morton
Here you can find historic sold price data in order to help with your property search.
The average Property Paid Price for specific property types in the last three years are:
| Property Type | Average Sold Price | Sold Properties |
|---|---|---|
| Semi Detached House | £153,604.00 | 142 Semi Detached Houses |
| Detached House | £181,153.00 | 13 Detached Houses |
| Terraced House | £128,443.00 | 80 Terraced Houses |
| Flat | £60,941.00 | 17 Flats |

