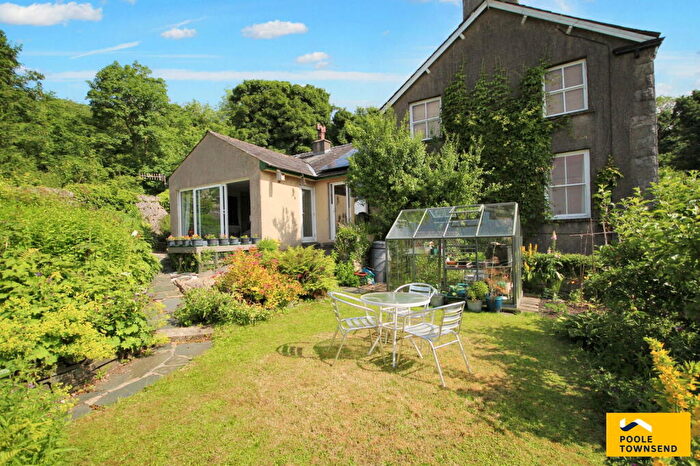
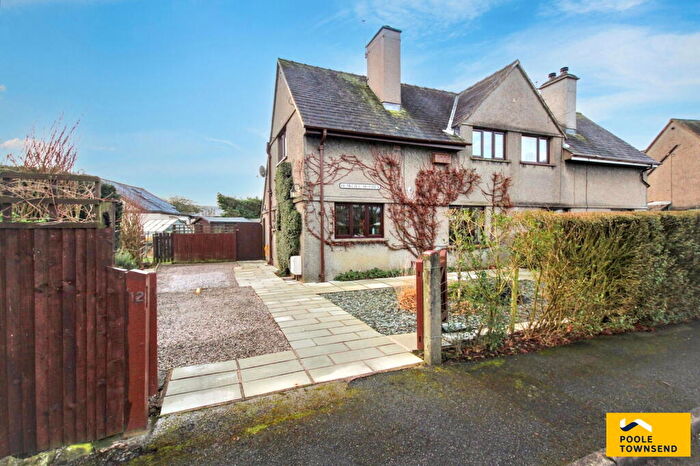
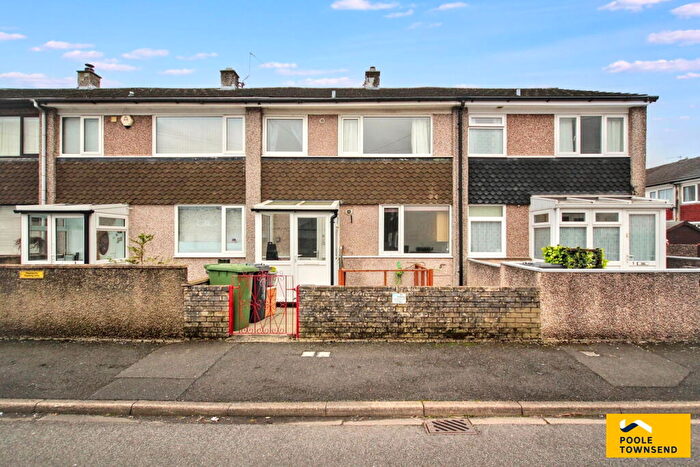
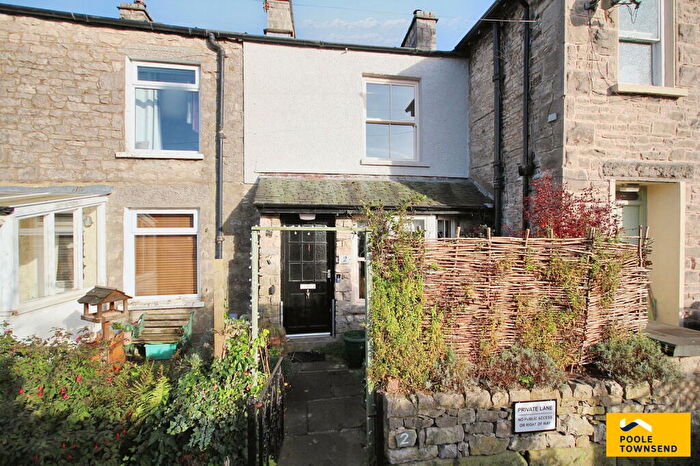
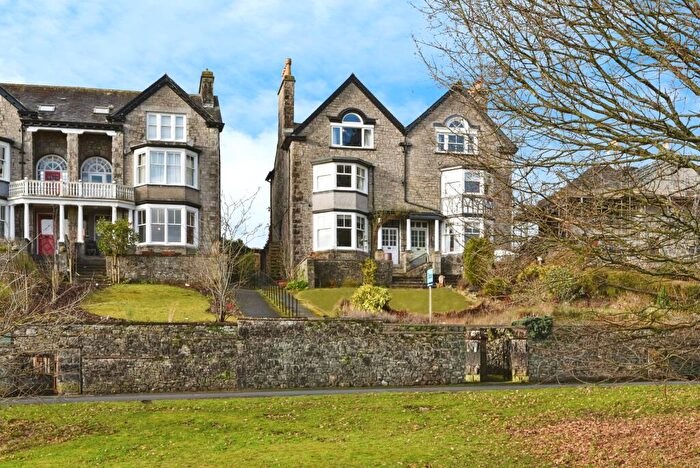
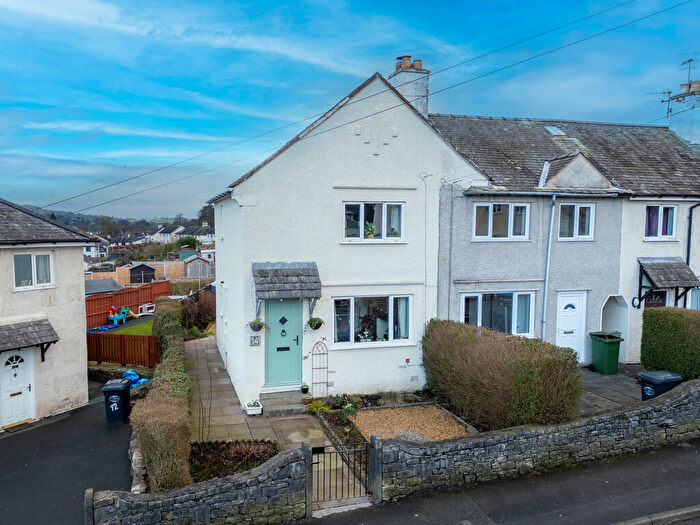
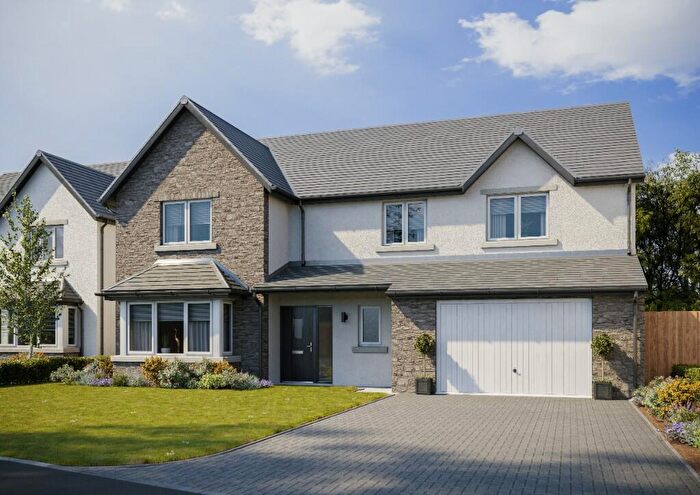
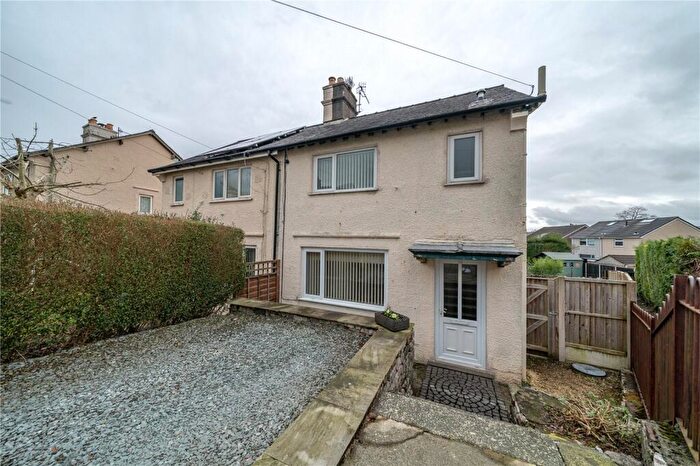
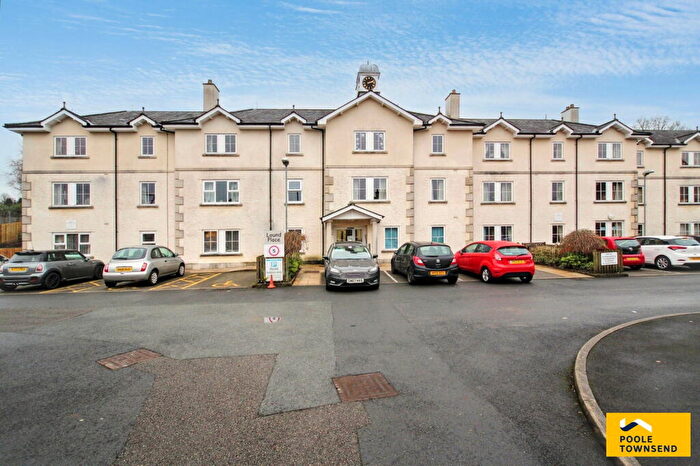
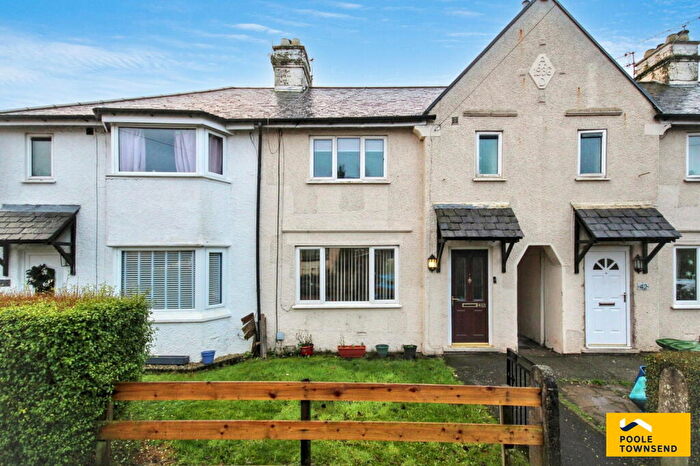
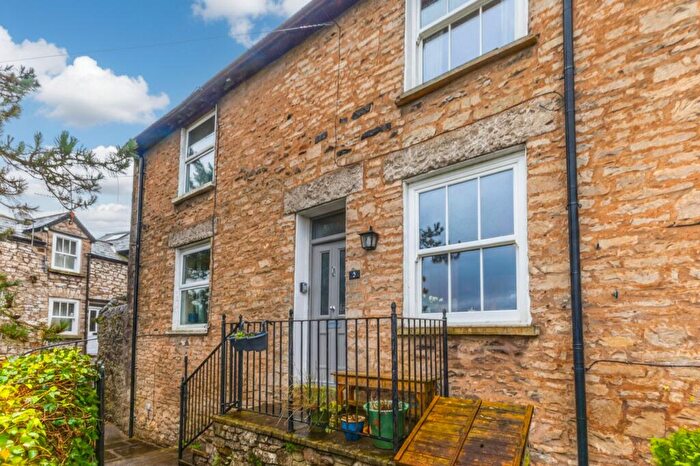
Houses for sale & to rent in Burneside, Kendal
House Prices in Burneside
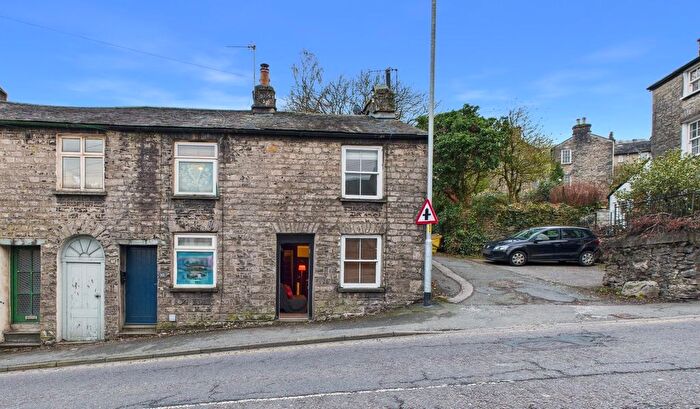
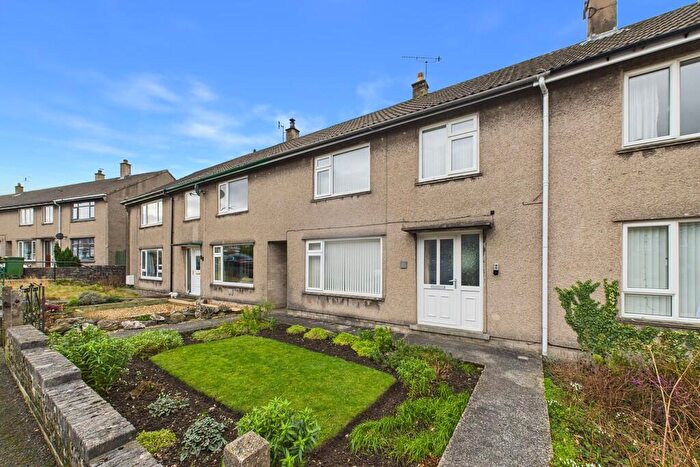
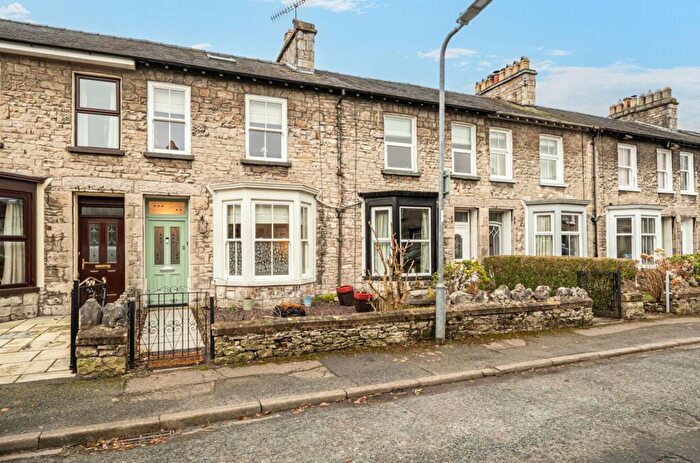
Properties in Burneside have an average house price of £361,245.00 and had 62 Property Transactions within the last 3 years¹.
Burneside is an area in Kendal, Cumbria with 765 households², where the most expensive property was sold for £900,000.00.
Properties for sale in Burneside
Roads and Postcodes in Burneside
Navigate through our locations to find the location of your next house in Burneside, Kendal for sale or to rent.
| Streets | Postcodes |
|---|---|
| Ash View | LA8 9DN |
| Bonningate | LA8 8JU LA8 8JX |
| Bournville | LA9 6PS |
| Bournville Bungalows | LA9 6PR |
| Carling Steps | LA9 6PQ |
| Carlingdale | LA9 6PW |
| Chapel Field | LA9 6QP |
| Church View Cottage | LA9 6QT |
| Churchill Court | LA9 6QW |
| Cowan Head | LA8 9HL LA8 9HN LA8 9HQ LA8 9HX LA8 9HY |
| Crook Road | LA8 8LX LA8 8LY |
| Dodding Holme | LA8 9DH |
| Garnett Bridge Road | LA8 9AU |
| Garth Row | LA8 9AT LA8 9AW |
| Gilthwaiterigg Lane | LA9 6LJ |
| Halhead Mews | LA9 6RD |
| Hall Park | LA9 6QF LA9 6RE |
| Hall Road | LA9 6QE |
| Hollins Lane | LA9 6QL |
| Hollins Row | LA9 6QN |
| Holme Houses | LA9 6RA |
| Howgill Close | LA9 6QJ |
| Howgill Houses | LA9 6QH |
| Ivy Crescent | LA9 6QQ |
| Junction Cottages | LA9 6PU |
| Kent Bank | LA8 9HD |
| Kent Close | LA8 9HJ |
| Ketel Houses | LA9 6QU |
| Kiln Croft | LA9 6NE |
| Lane Foot | LA9 5RW |
| Lane Head Cottages | LA8 9JR |
| Laverock Hill | LA8 9EP |
| Meadow Close | LA8 9HA |
| Oakbank Cottages | LA8 9AQ |
| Old Bowston | LA8 9HE |
| Sprint Holme | LA9 6PT |
| St Oswalds View | LA9 6RH |
| Steeles Row | LA9 6PY |
| The Hollins | LA9 5SG |
| Two Mile Hill | LA8 8LZ |
| Windermere Road | LA9 5RY LA9 5RZ LA9 5SA |
| Winstanley Place | LA8 9HF |
| LA8 0DA LA8 9AB LA8 9AD LA8 9AG LA8 9AS LA8 9AY LA8 9DJ LA8 9DP LA8 9DR LA8 9DW LA8 9HG LA8 9HH LA8 9JU LA9 5SE LA9 6NU LA9 6NX LA9 6PN LA9 6QX LA9 6RB |
Transport near Burneside
- FAQ
- Price Paid By Year
- Property Type Price
Frequently asked questions about Burneside
What is the average price for a property for sale in Burneside?
The average price for a property for sale in Burneside is £361,245. This amount is 20% higher than the average price in Kendal. There are 1,730 property listings for sale in Burneside.
What streets have the most expensive properties for sale in Burneside?
The streets with the most expensive properties for sale in Burneside are Bonningate at an average of £560,000, Garth Row at an average of £476,416 and Cowan Head at an average of £462,000.
What streets have the most affordable properties for sale in Burneside?
The streets with the most affordable properties for sale in Burneside are Howgill Close at an average of £140,000, Steeles Row at an average of £162,500 and St Oswalds View at an average of £194,233.
Which train stations are available in or near Burneside?
Some of the train stations available in or near Burneside are Burneside, Kendal and Staveley (Cumbria).
Property Price Paid in Burneside by Year
The average sold property price by year was:
| Year | Average Sold Price | Price Change |
Sold Properties
|
|---|---|---|---|
| 2025 | £360,866 | -4% |
15 Properties |
| 2024 | £374,361 | 7% |
22 Properties |
| 2023 | £349,930 | -14% |
25 Properties |
| 2022 | £400,360 | 13% |
26 Properties |
| 2021 | £349,726 | -2% |
42 Properties |
| 2020 | £355,958 | 20% |
18 Properties |
| 2019 | £284,310 | -4% |
24 Properties |
| 2018 | £296,786 | -5% |
25 Properties |
| 2017 | £310,596 | 23% |
18 Properties |
| 2016 | £238,708 | 3% |
12 Properties |
| 2015 | £231,062 | -21% |
16 Properties |
| 2014 | £279,211 | 15% |
27 Properties |
| 2013 | £236,184 | 2% |
19 Properties |
| 2012 | £231,228 | -16% |
27 Properties |
| 2011 | £268,026 | 12% |
19 Properties |
| 2010 | £236,941 | -13% |
16 Properties |
| 2009 | £266,772 | -3% |
20 Properties |
| 2008 | £275,406 | 13% |
16 Properties |
| 2007 | £239,508 | -12% |
23 Properties |
| 2006 | £267,633 | -14% |
28 Properties |
| 2005 | £304,237 | 22% |
20 Properties |
| 2004 | £236,801 | 16% |
32 Properties |
| 2003 | £199,977 | 22% |
27 Properties |
| 2002 | £155,015 | 12% |
36 Properties |
| 2001 | £136,639 | 8% |
32 Properties |
| 2000 | £125,240 | 3% |
29 Properties |
| 1999 | £122,039 | 16% |
53 Properties |
| 1998 | £102,412 | 29% |
52 Properties |
| 1997 | £72,825 | -76% |
56 Properties |
| 1996 | £128,092 | 18% |
48 Properties |
| 1995 | £104,736 | - |
30 Properties |
Property Price per Property Type in Burneside
Here you can find historic sold price data in order to help with your property search.
The average Property Paid Price for specific property types in the last three years are:
| Property Type | Average Sold Price | Sold Properties |
|---|---|---|
| Semi Detached House | £322,343.00 | 16 Semi Detached Houses |
| Detached House | £554,159.00 | 11 Detached Houses |
| Terraced House | £253,725.00 | 22 Terraced Houses |
| Flat | £427,846.00 | 13 Flats |

