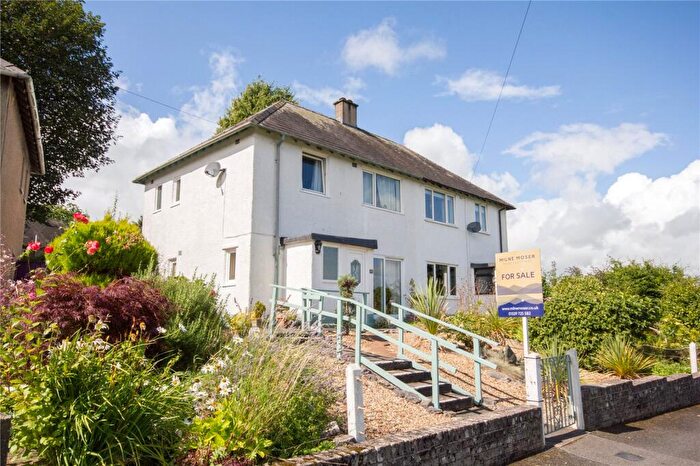
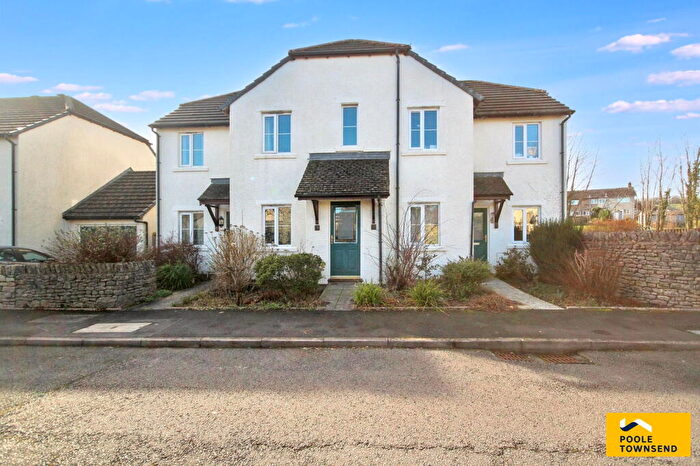
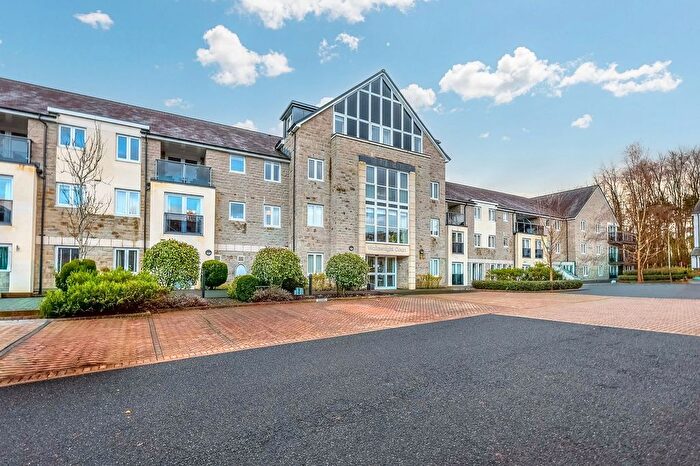
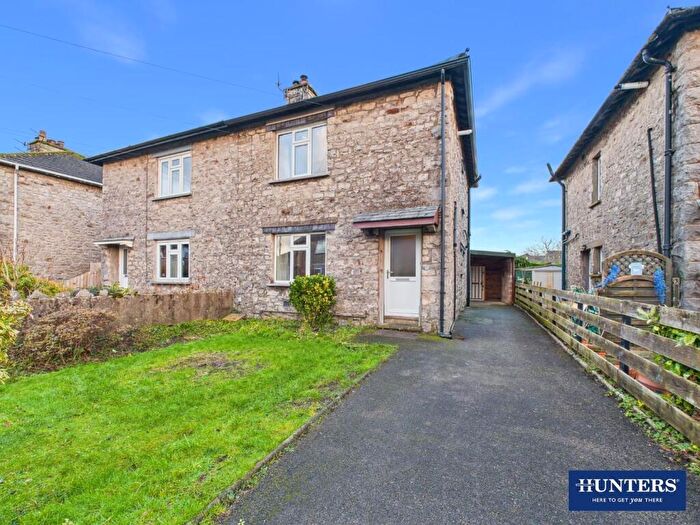
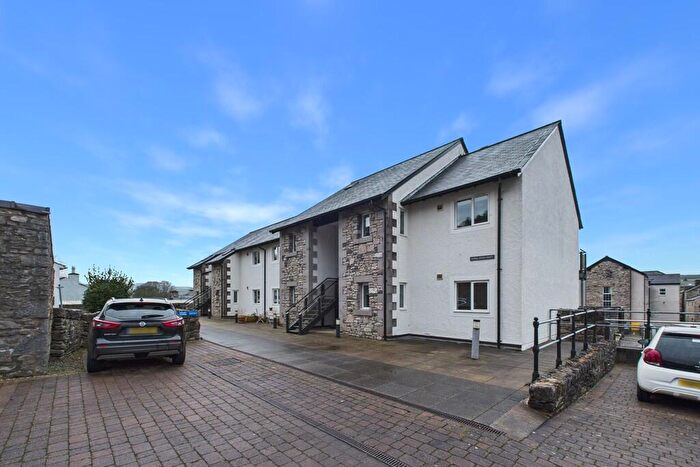
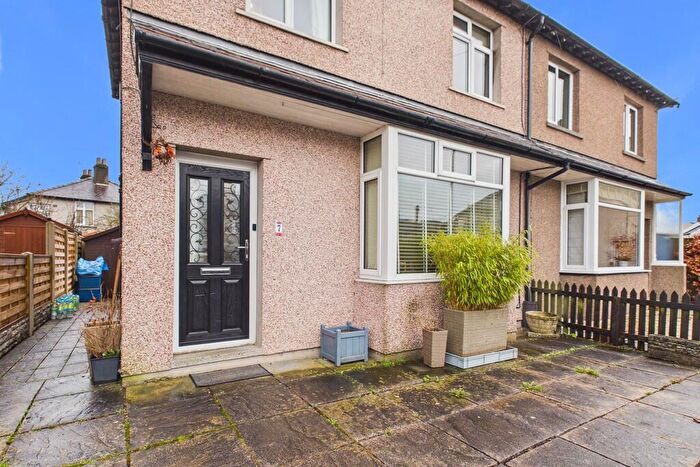
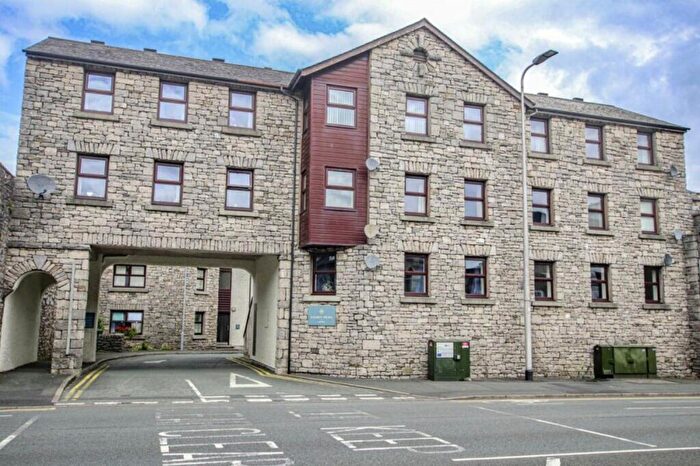
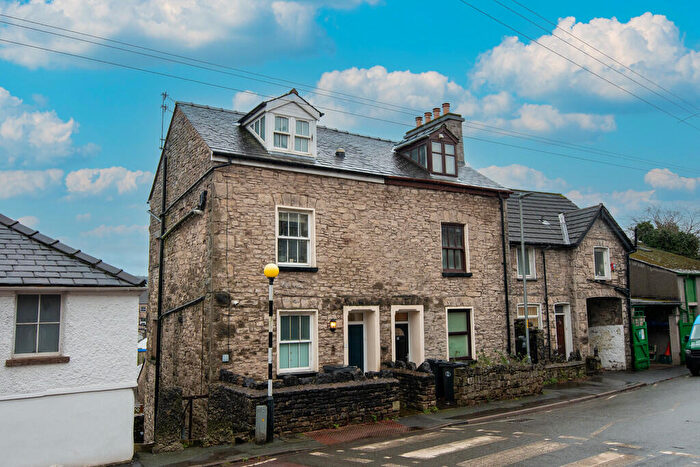
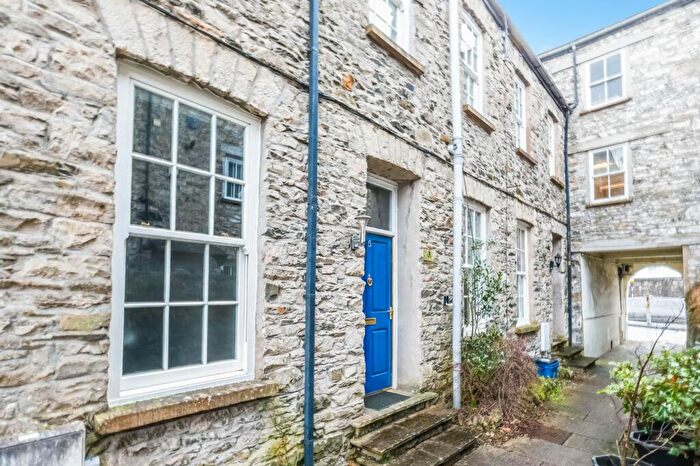
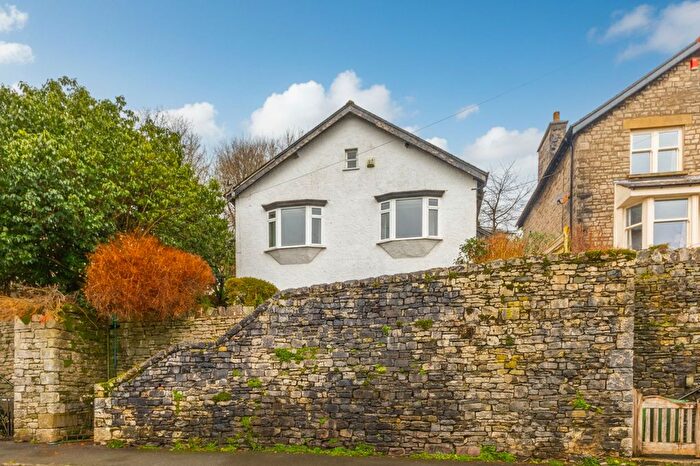
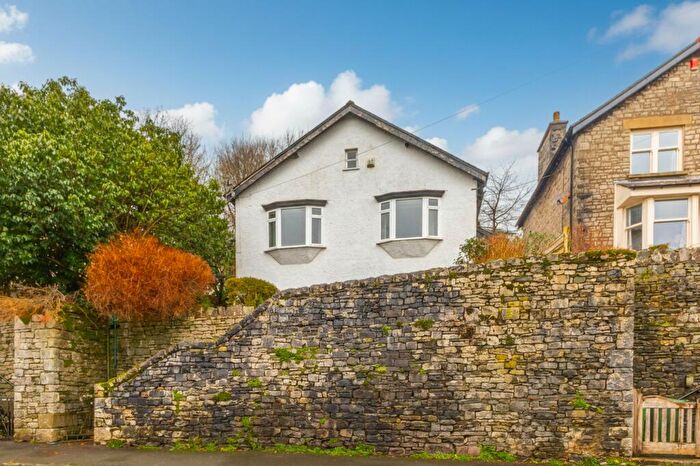
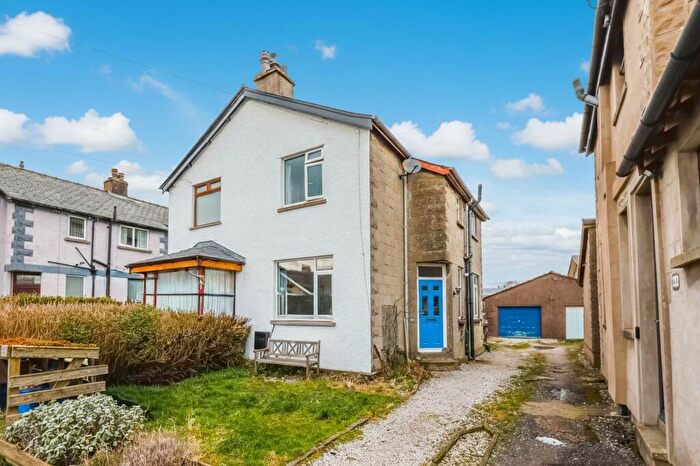
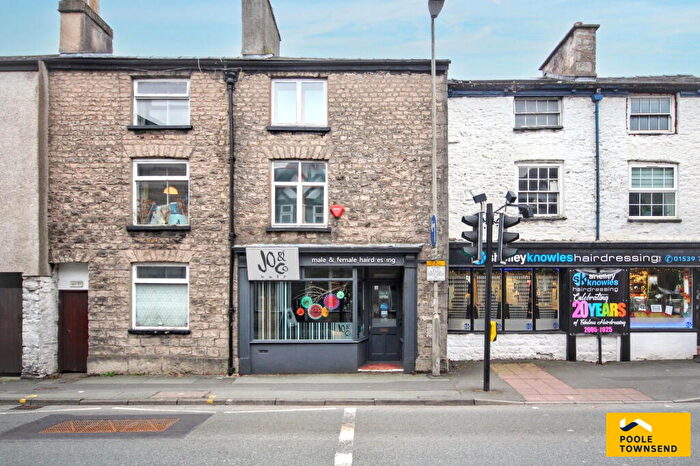
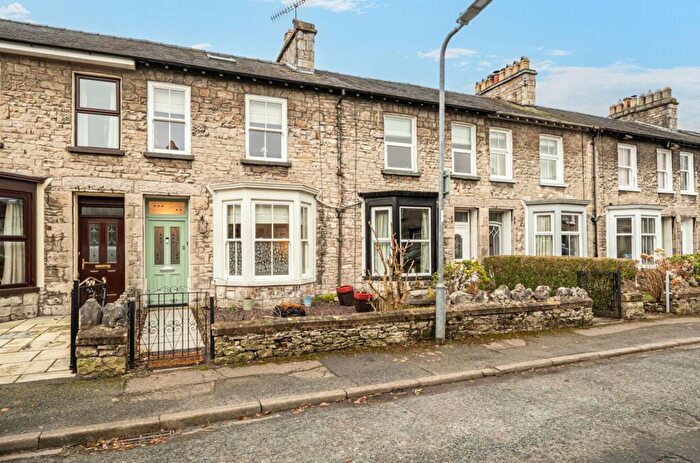
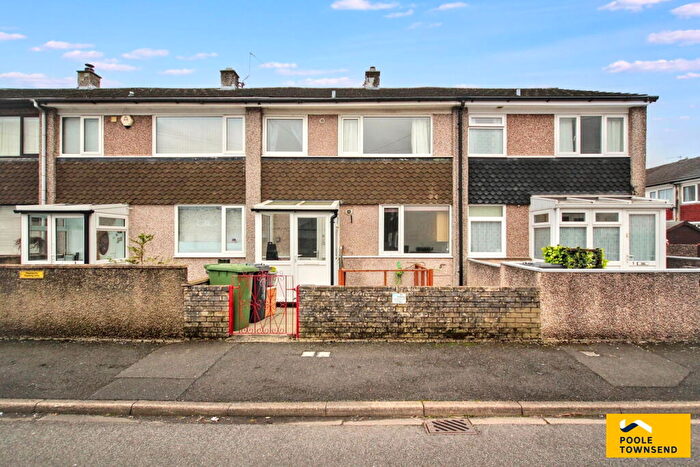
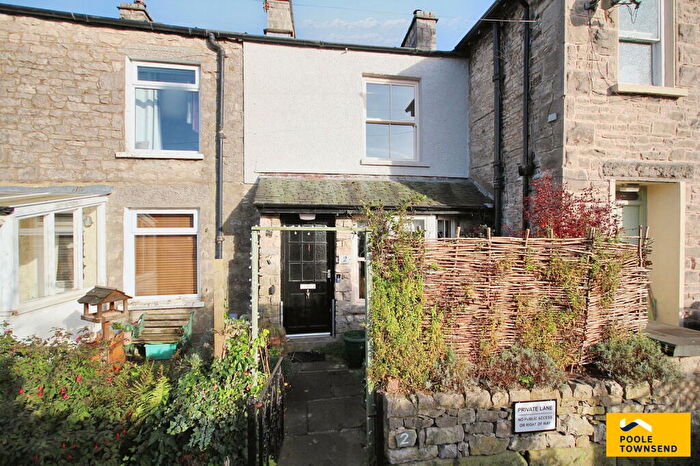
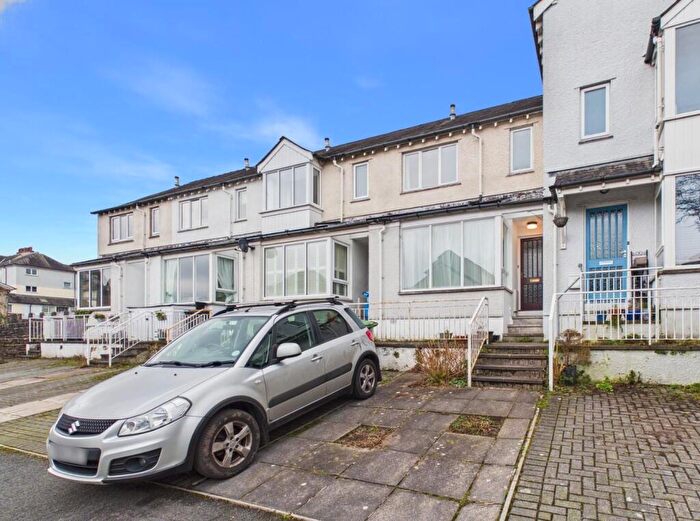
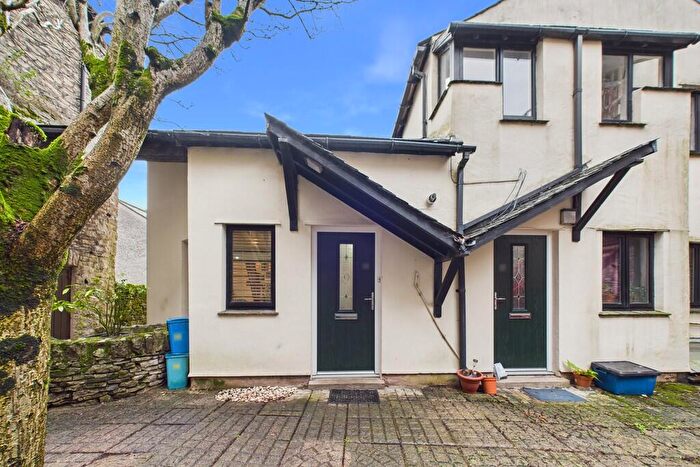
Houses for sale & to rent in Kendal Strickland, Kendal
House Prices in Kendal Strickland
Properties in Kendal Strickland have an average house price of £267,347.00 and had 100 Property Transactions within the last 3 years¹.
Kendal Strickland is an area in Kendal, Cumbria with 892 households², where the most expensive property was sold for £920,000.00.
Properties for sale in Kendal Strickland
Roads and Postcodes in Kendal Strickland
Navigate through our locations to find the location of your next house in Kendal Strickland, Kendal for sale or to rent.
| Streets | Postcodes |
|---|---|
| Aikrigg Avenue | LA9 6DY |
| Applerigg | LA9 6EA |
| Ashleigh Road | LA9 4SS |
| Blackthorn Close | LA9 6FD |
| Bramble Close | LA9 6FF |
| Briarigg | LA9 6FA |
| Burneside Road | LA9 4RL LA9 4RN LA9 4RT LA9 4RZ LA9 6DZ LA9 6EB |
| Caroline Street | LA9 4SH |
| Charles Street | LA9 4SB |
| Crook Lea | LA9 4QW |
| Cross Street | LA9 4RW |
| Dockray Hall Road | LA9 4QY |
| Earle Court | LA9 4SF |
| Ferney Green | LA9 4SW |
| Gardiner Bank | LA9 4SL |
| Green Road | LA9 4QR |
| Green View Flats | LA9 4QS |
| Hawthorn Gardens | LA9 6FG |
| High Mead | LA9 5PY |
| Horncop Lane | LA9 4SR |
| Kent Lea | LA9 6ED |
| Kentrigg | LA9 6EE |
| Kentrigg Walk | LA9 6EF |
| Laurel Gardens | LA9 6FE |
| Low Mead | LA9 5PZ |
| Rydal Mount | LA9 4RS |
| Sparrowmire Lane | LA9 5PF LA9 5PU LA9 5PX |
| Strickland Court | LA9 4QU |
| Union Street | LA9 4RP LA9 4RR |
| Webb View | LA9 4SN |
Transport near Kendal Strickland
- FAQ
- Price Paid By Year
- Property Type Price
Frequently asked questions about Kendal Strickland
What is the average price for a property for sale in Kendal Strickland?
The average price for a property for sale in Kendal Strickland is £267,347. This amount is 11% lower than the average price in Kendal. There are 928 property listings for sale in Kendal Strickland.
What streets have the most expensive properties for sale in Kendal Strickland?
The streets with the most expensive properties for sale in Kendal Strickland are Horncop Lane at an average of £584,400, Applerigg at an average of £436,000 and Bramble Close at an average of £376,000.
What streets have the most affordable properties for sale in Kendal Strickland?
The streets with the most affordable properties for sale in Kendal Strickland are Green View Flats at an average of £125,000, Cross Street at an average of £153,833 and Dockray Hall Road at an average of £169,000.
Which train stations are available in or near Kendal Strickland?
Some of the train stations available in or near Kendal Strickland are Kendal, Burneside and Oxenholme Lake District.
Property Price Paid in Kendal Strickland by Year
The average sold property price by year was:
| Year | Average Sold Price | Price Change |
Sold Properties
|
|---|---|---|---|
| 2025 | £256,497 | -10% |
38 Properties |
| 2024 | £283,022 | 5% |
24 Properties |
| 2023 | £268,297 | 5% |
38 Properties |
| 2022 | £254,605 | -4% |
35 Properties |
| 2021 | £263,517 | 7% |
46 Properties |
| 2020 | £245,381 | 14% |
38 Properties |
| 2019 | £211,243 | -3% |
48 Properties |
| 2018 | £218,036 | 3% |
43 Properties |
| 2017 | £211,470 | 3% |
42 Properties |
| 2016 | £205,436 | 1% |
47 Properties |
| 2015 | £203,144 | -0,4% |
57 Properties |
| 2014 | £204,048 | -2% |
40 Properties |
| 2013 | £208,403 | 12% |
43 Properties |
| 2012 | £182,450 | -12% |
40 Properties |
| 2011 | £205,159 | -5% |
47 Properties |
| 2010 | £216,339 | 8% |
32 Properties |
| 2009 | £199,760 | -6% |
43 Properties |
| 2008 | £211,563 | 6% |
34 Properties |
| 2007 | £199,886 | 6% |
72 Properties |
| 2006 | £187,369 | 11% |
78 Properties |
| 2005 | £166,508 | 2% |
49 Properties |
| 2004 | £163,834 | 8% |
55 Properties |
| 2003 | £150,419 | 25% |
89 Properties |
| 2002 | £113,043 | 17% |
104 Properties |
| 2001 | £94,173 | 15% |
149 Properties |
| 2000 | £80,208 | 22% |
78 Properties |
| 1999 | £62,927 | 18% |
57 Properties |
| 1998 | £51,629 | 0,4% |
29 Properties |
| 1997 | £51,407 | -2% |
51 Properties |
| 1996 | £52,388 | -3% |
40 Properties |
| 1995 | £54,165 | - |
45 Properties |
Property Price per Property Type in Kendal Strickland
Here you can find historic sold price data in order to help with your property search.
The average Property Paid Price for specific property types in the last three years are:
| Property Type | Average Sold Price | Sold Properties |
|---|---|---|
| Semi Detached House | £290,748.00 | 29 Semi Detached Houses |
| Detached House | £418,687.00 | 16 Detached Houses |
| Terraced House | £227,067.00 | 42 Terraced Houses |
| Flat | £159,017.00 | 13 Flats |

