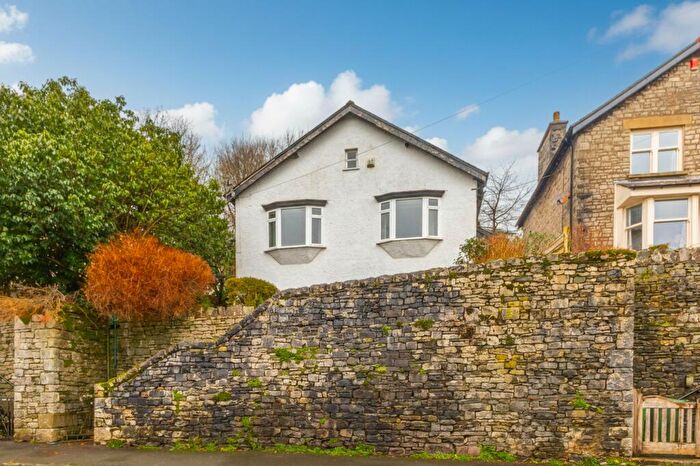
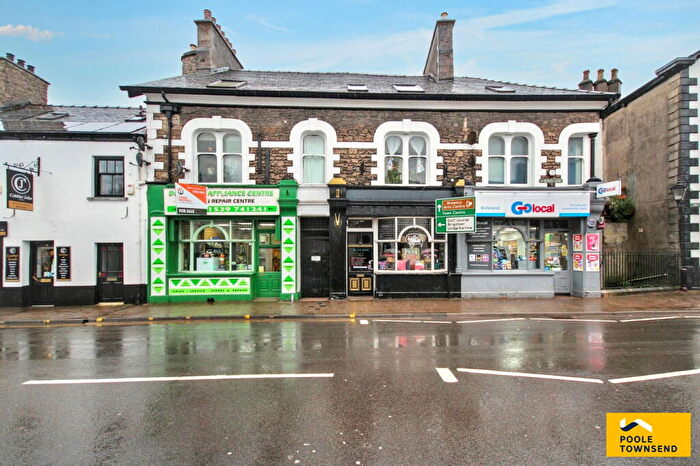
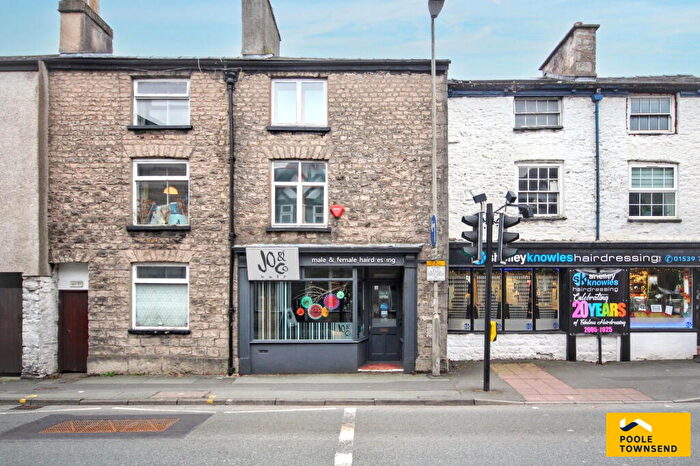
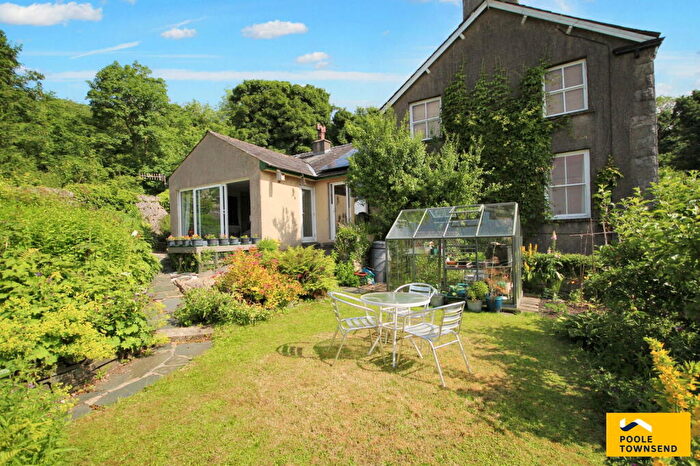
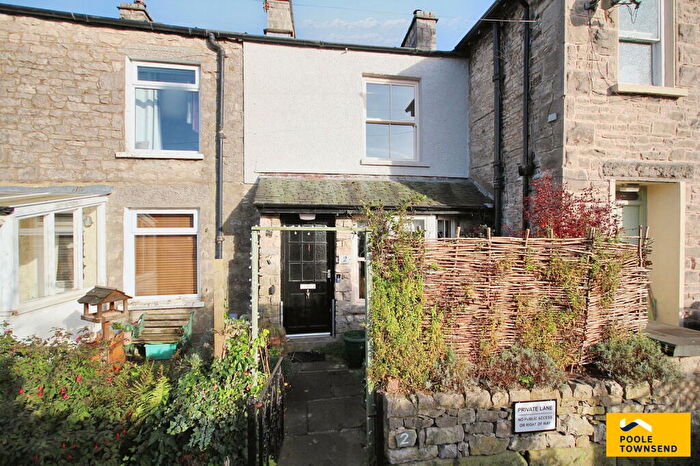
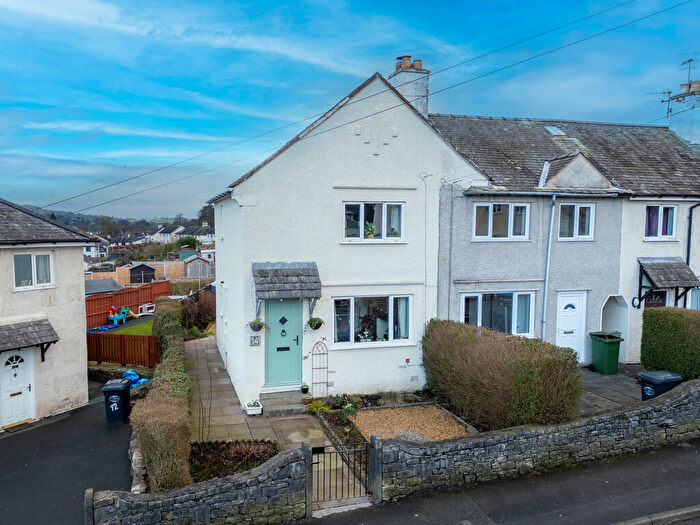
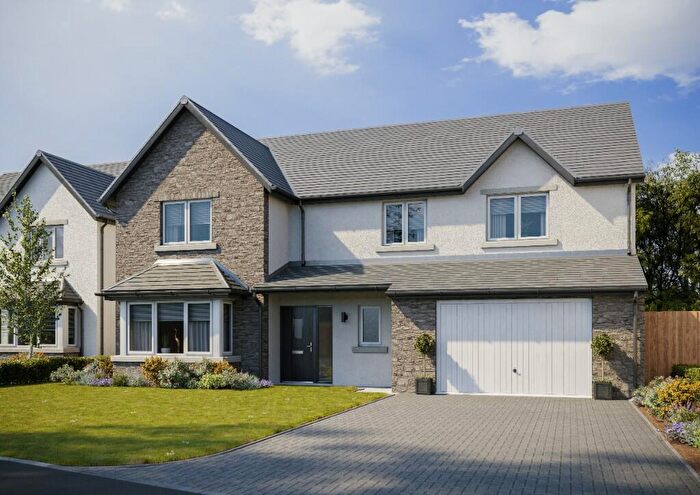
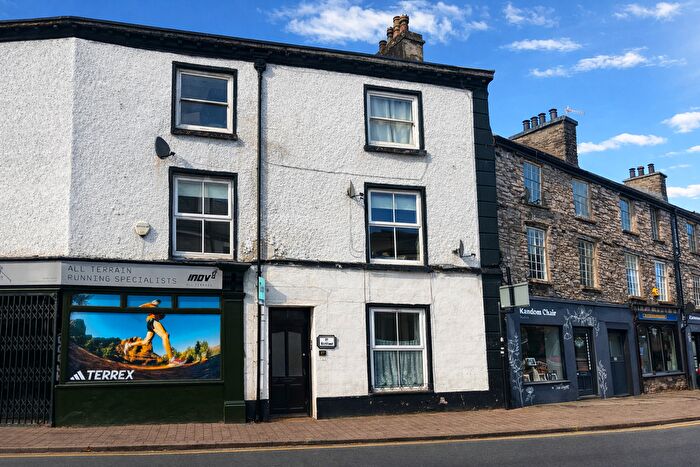
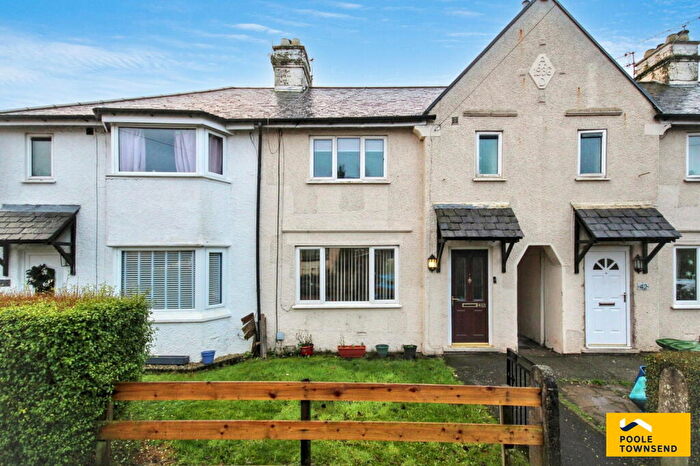
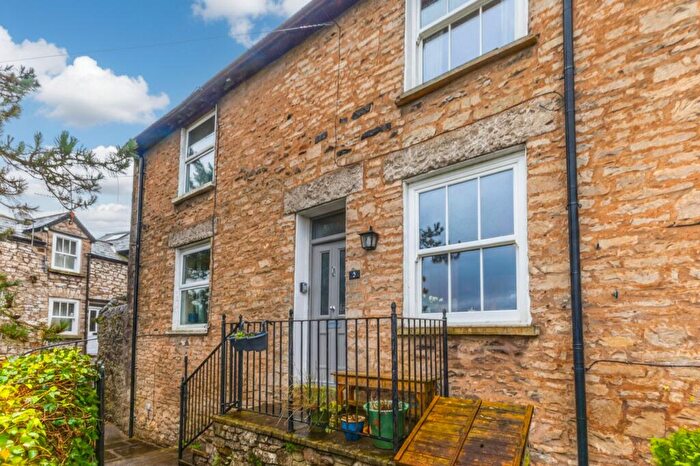
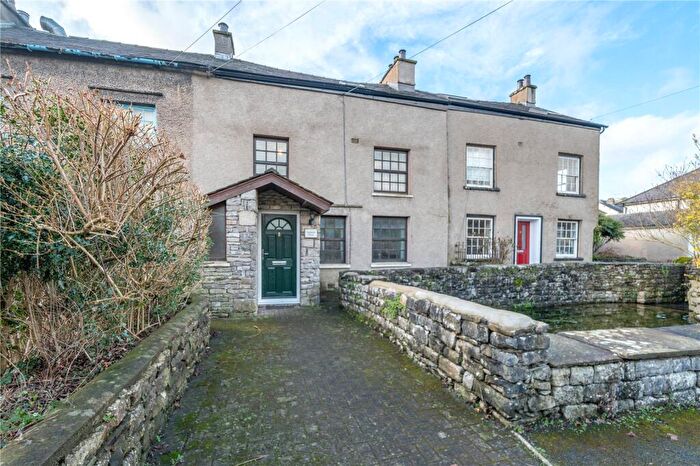
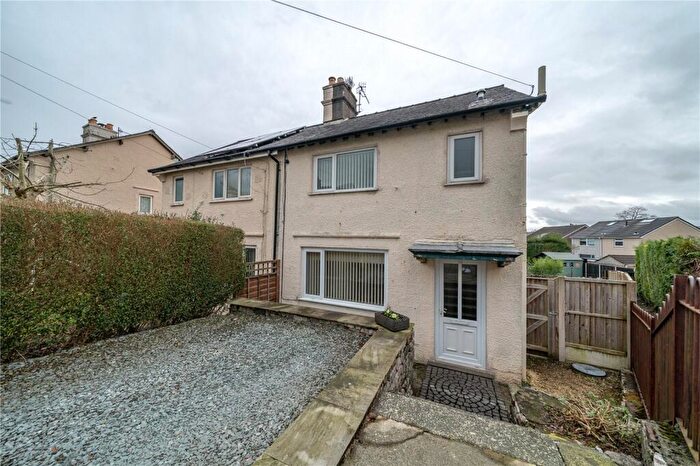
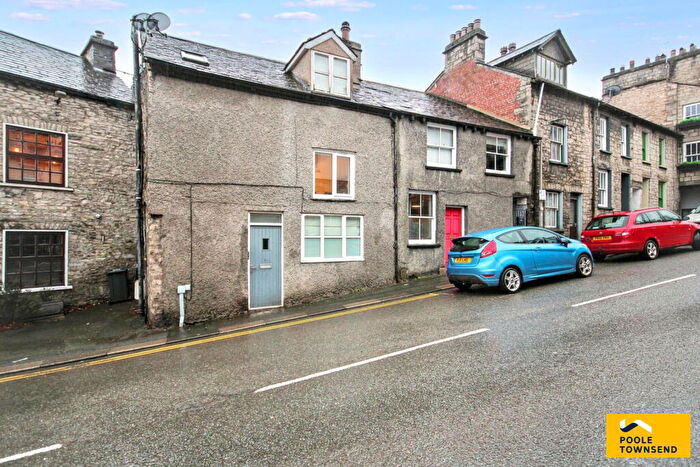
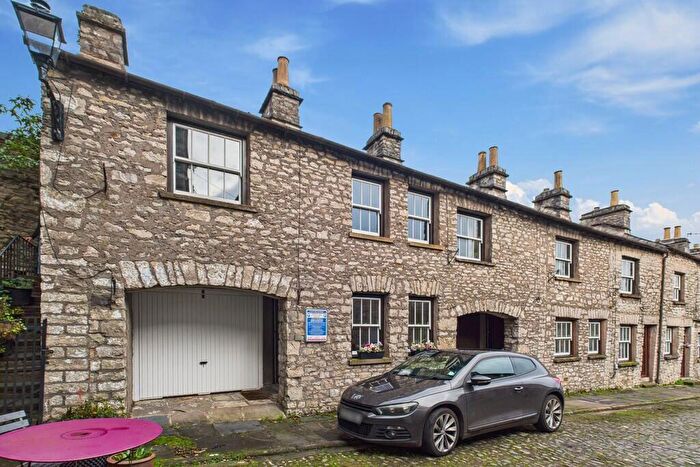
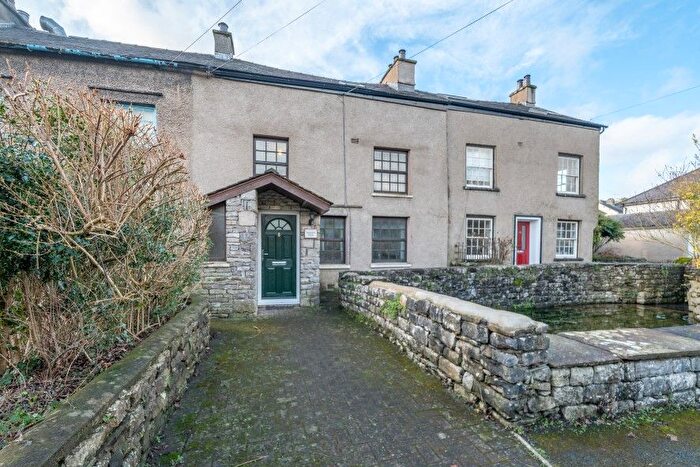
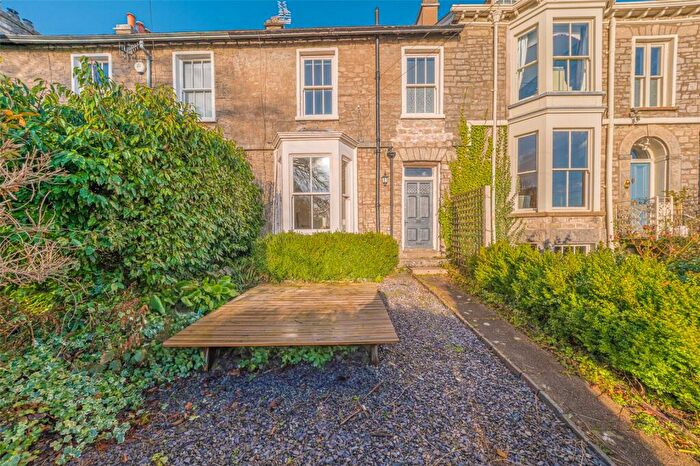
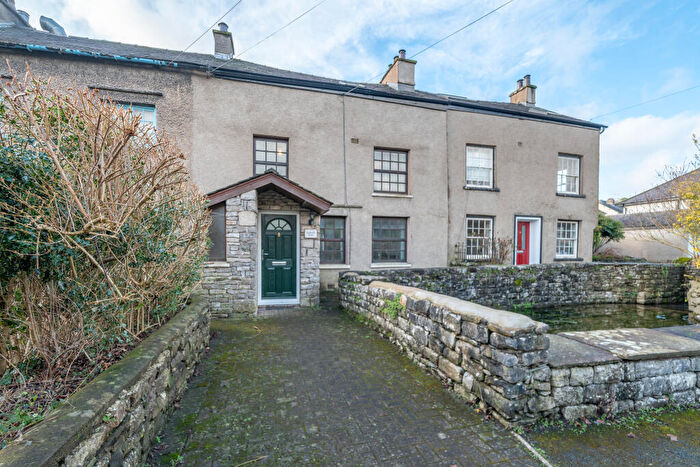
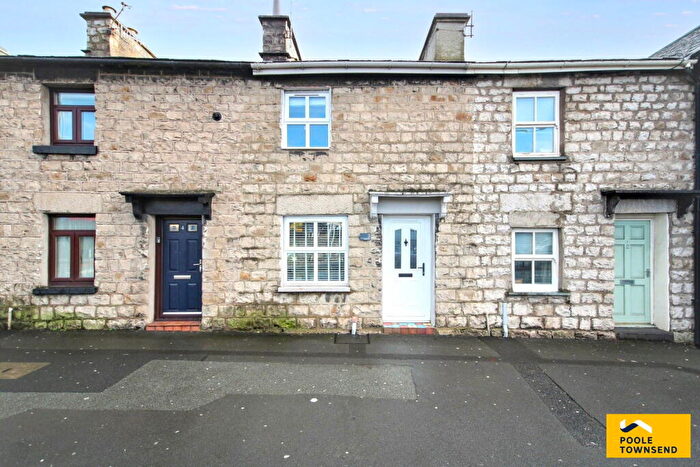
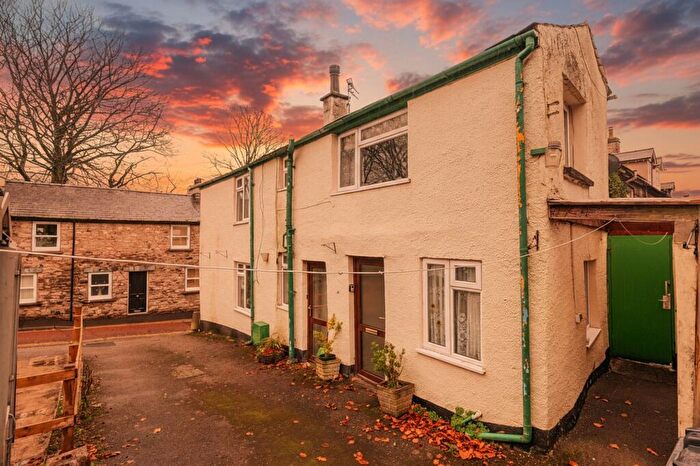
Houses for sale & to rent in Kendal Fell, Kendal
House Prices in Kendal Fell
Properties in Kendal Fell have an average house price of £213,779.00 and had 143 Property Transactions within the last 3 years¹.
Kendal Fell is an area in Kendal, Cumbria with 1,080 households², where the most expensive property was sold for £775,000.00.
Properties for sale in Kendal Fell
Roads and Postcodes in Kendal Fell
Navigate through our locations to find the location of your next house in Kendal Fell, Kendal for sale or to rent.
| Streets | Postcodes |
|---|---|
| Allhallows Lane | LA9 4JH |
| Bank Street | LA9 4LG |
| Beast Banks | LA9 4JT LA9 4JW |
| Beech Hill Terrace | LA9 4PB LA9 4PP |
| Belmont | LA9 4JP |
| Belmont Brow | LA9 4LH |
| Benson Green | LA9 4RG |
| Birch Yard | LA9 4RA |
| Blackhall Road | LA9 4UU |
| Chapel Close | LA9 4LQ |
| Church Terrace | LA9 4PR |
| Cliff Lane | LA9 4LJ |
| Cliff Terrace | LA9 4JR |
| College Mews | LA9 4BF |
| Entry Lane | LA9 4NQ |
| Fellside Court | LA9 4HB |
| Finkle Street | LA9 4AB |
| Fleece Inn Yard | LA9 4TA |
| Fountain Brow | LA9 4NW |
| Greencoats Yard | LA9 4XA |
| Greenside | LA9 4LD LA9 5DT |
| High Fellside | LA9 4JG |
| High Tenterfell | LA9 4PG LA9 4PQ |
| Highgate | LA9 4BU LA9 4DA |
| Jamiesons Place | LA9 4NY |
| Kings Arms Croft | LA9 4DG |
| Knott View | LA9 4NU |
| Lambrigg Terrace | LA9 4BB |
| Low Fellside | LA9 4NH LA9 4NZ |
| Market Place | LA9 4TN LA9 4TP |
| Maude Street | LA9 4QD |
| Melrose Place | LA9 4BA |
| Middle Lane | LA9 4NR |
| Mount Pleasant | LA9 4JS |
| Mount Street | LA9 4LB |
| Mountain View | LA9 4QT |
| New Road | LA9 4AY |
| Orchard View | LA9 4NT |
| Printers Croft | LA9 4DJ |
| Prospect Terrace | LA9 4NL |
| Queen Street | LA9 4LF |
| Queens Road | LA9 4PH LA9 4PL LA9 4QP |
| Rosemary Hill | LA9 4NN |
| Rosemary Lane | LA9 4NP |
| Sandes Avenue | LA9 4LL LA9 4LN LA9 4SG |
| Sepulchre Lane | LA9 4NJ |
| Serpentine Road | LA9 4PD LA9 4PE LA9 4PF |
| Spital View | LA9 4NX |
| Spring Gardens | LA9 4PA |
| Stramongate | LA9 4BD LA9 4BH LA9 4UA |
| Stricklandgate | LA9 4PU LA9 4RF |
| Summerhill Gardens | LA9 4LE |
| The Old Woodyard | LA9 4PZ |
| Town View | LA9 4QL |
| Underbarrow Road | LA9 5RS |
| Undercliff Road | LA9 4PS |
| West Grove | LA9 4PN |
| Windermere Road | LA9 4QJ LA9 5EZ LA9 5SH |
| Woolpack Yard | LA9 4NG |
Transport near Kendal Fell
- FAQ
- Price Paid By Year
- Property Type Price
Frequently asked questions about Kendal Fell
What is the average price for a property for sale in Kendal Fell?
The average price for a property for sale in Kendal Fell is £213,779. This amount is 29% lower than the average price in Kendal. There are 1,304 property listings for sale in Kendal Fell.
What streets have the most expensive properties for sale in Kendal Fell?
The streets with the most expensive properties for sale in Kendal Fell are Belmont at an average of £487,500, Beech Hill Terrace at an average of £435,750 and Greenside at an average of £431,250.
What streets have the most affordable properties for sale in Kendal Fell?
The streets with the most affordable properties for sale in Kendal Fell are Market Place at an average of £72,000, Blackhall Road at an average of £83,840 and Greencoats Yard at an average of £105,642.
Which train stations are available in or near Kendal Fell?
Some of the train stations available in or near Kendal Fell are Kendal, Burneside and Oxenholme Lake District.
Property Price Paid in Kendal Fell by Year
The average sold property price by year was:
| Year | Average Sold Price | Price Change |
Sold Properties
|
|---|---|---|---|
| 2025 | £222,039 | 10% |
49 Properties |
| 2024 | £199,328 | -11% |
49 Properties |
| 2023 | £220,522 | -2% |
45 Properties |
| 2022 | £225,247 | 4% |
74 Properties |
| 2021 | £217,045 | 9% |
71 Properties |
| 2020 | £198,053 | 5% |
49 Properties |
| 2019 | £187,686 | 12% |
68 Properties |
| 2018 | £166,081 | 0,1% |
48 Properties |
| 2017 | £165,866 | 3% |
55 Properties |
| 2016 | £161,165 | -26% |
47 Properties |
| 2015 | £202,630 | 9% |
59 Properties |
| 2014 | £184,533 | 6% |
54 Properties |
| 2013 | £173,438 | -7% |
49 Properties |
| 2012 | £184,960 | 3% |
48 Properties |
| 2011 | £178,542 | 6% |
47 Properties |
| 2010 | £167,237 | -14% |
38 Properties |
| 2009 | £190,465 | 11% |
50 Properties |
| 2008 | £169,485 | 5% |
47 Properties |
| 2007 | £161,081 | -1% |
87 Properties |
| 2006 | £162,118 | -5% |
102 Properties |
| 2005 | £169,659 | 8% |
77 Properties |
| 2004 | £156,466 | 21% |
111 Properties |
| 2003 | £124,078 | 17% |
109 Properties |
| 2002 | £102,916 | 10% |
146 Properties |
| 2001 | £92,349 | 21% |
68 Properties |
| 2000 | £72,757 | 17% |
87 Properties |
| 1999 | £60,398 | 1% |
67 Properties |
| 1998 | £59,802 | -10% |
76 Properties |
| 1997 | £65,829 | 12% |
78 Properties |
| 1996 | £57,962 | -1% |
66 Properties |
| 1995 | £58,588 | - |
70 Properties |
Property Price per Property Type in Kendal Fell
Here you can find historic sold price data in order to help with your property search.
The average Property Paid Price for specific property types in the last three years are:
| Property Type | Average Sold Price | Sold Properties |
|---|---|---|
| Detached House | £370,250.00 | 10 Detached Houses |
| Semi Detached House | £373,660.00 | 10 Semi Detached Houses |
| Terraced House | £259,628.00 | 48 Terraced Houses |
| Flat | £142,256.00 | 75 Flats |

