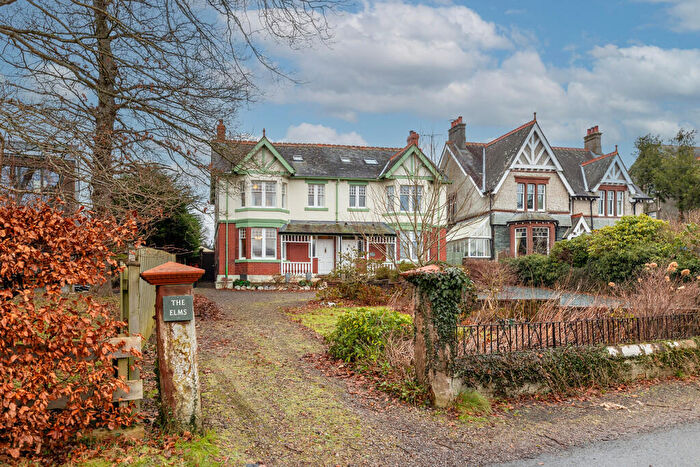
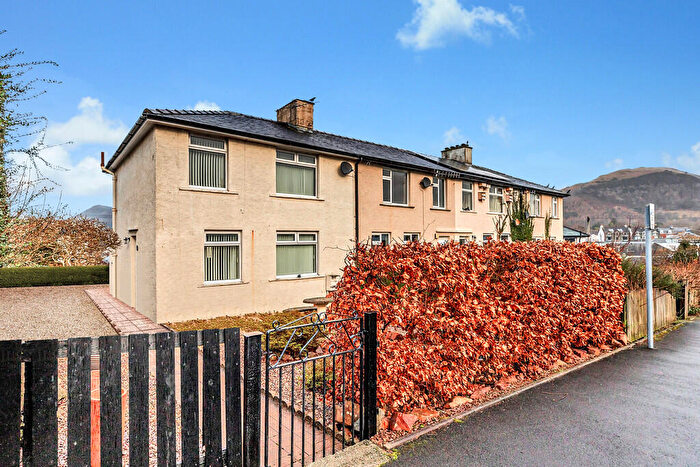
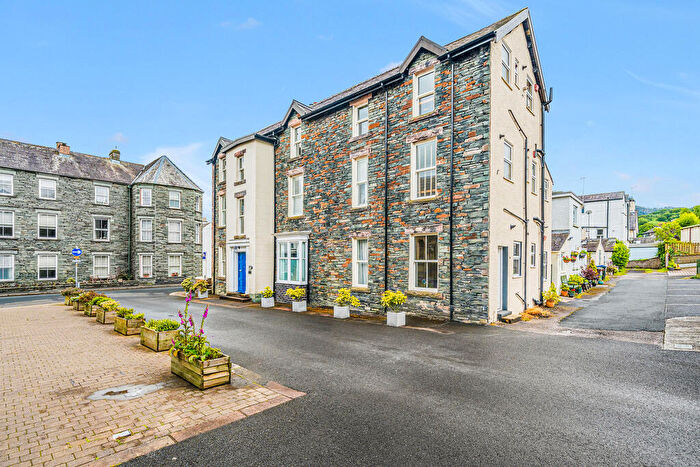
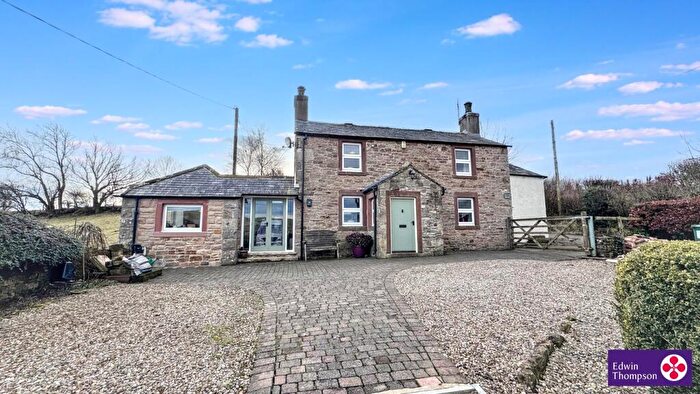
Houses for sale & to rent in Boltons, Keswick
House Prices in Boltons
Properties in Boltons have an average house price of £448,055.00 and had 27 Property Transactions within the last 3 years¹.
Boltons is an area in Keswick, Cumbria with 323 households², where the most expensive property was sold for £840,000.00.
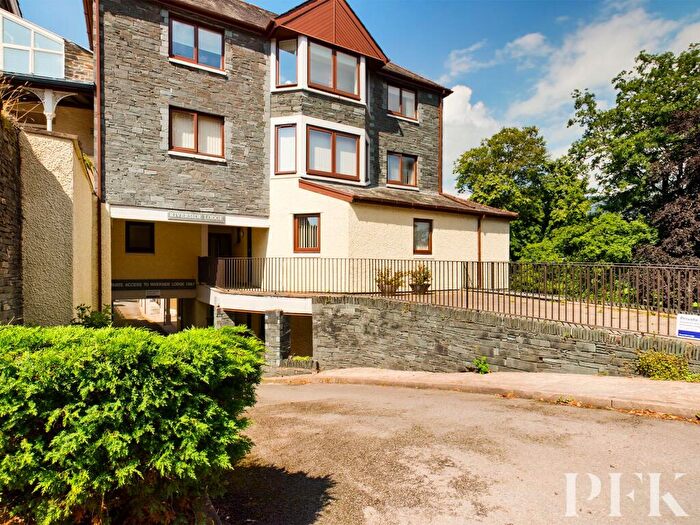
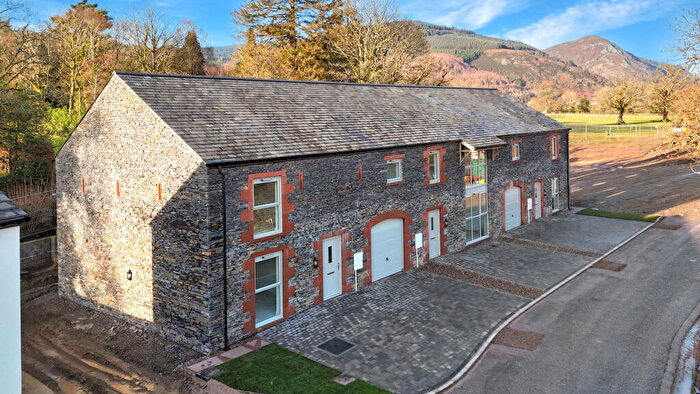
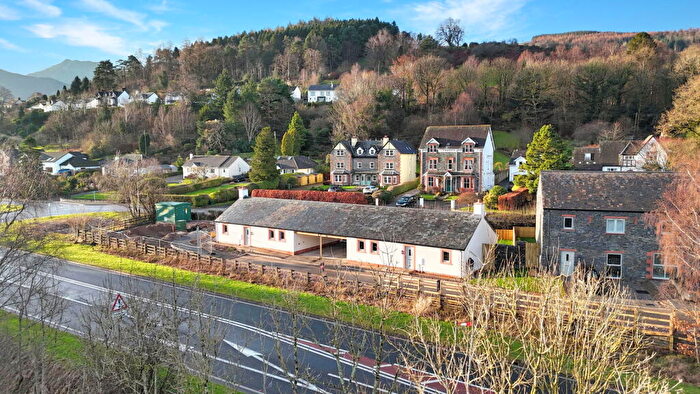
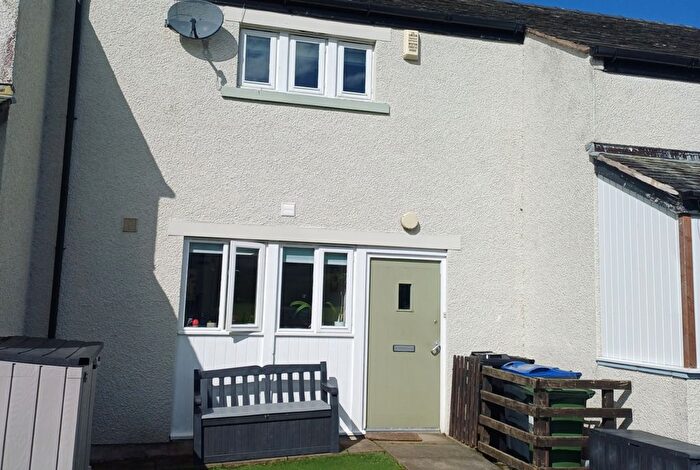
Properties for sale in Boltons
Roads and Postcodes in Boltons
Navigate through our locations to find the location of your next house in Boltons, Keswick for sale or to rent.
| Streets | Postcodes |
|---|---|
| Brundholme Road | CA12 4NL |
| Burnside Park | CA12 4PF |
| Butts Meadow | CA12 4QL |
| Millbeck Cottages | CA12 4PT |
| North Row Cottages | CA12 4RQ |
| Park View | CA12 4QT |
| The Avenue | CA12 4QJ |
| The Green | CA12 4QR |
| The Orchard | CA12 4QS |
| CA12 4PG CA12 4PJ CA12 4PL CA12 4PN CA12 4PP CA12 4PS CA12 4PY CA12 4PZ CA12 4QA CA12 4QD CA12 4QG CA12 4QH CA12 4QP CA12 4QX CA12 4QZ CA12 4RA CA12 4RD CA12 4RG CA12 4RJ CA12 4RL CA12 4QE CA12 4QW CA12 4QY CA12 4RE CA13 9SU CA13 9SX CA13 9SY |
Transport near Boltons
- FAQ
- Price Paid By Year
- Property Type Price
Frequently asked questions about Boltons
What is the average price for a property for sale in Boltons?
The average price for a property for sale in Boltons is £448,055. This amount is 2% higher than the average price in Keswick. There are 465 property listings for sale in Boltons.
Which train stations are available in or near Boltons?
Some of the train stations available in or near Boltons are Aspatria, Wigton and Maryport.
Property Price Paid in Boltons by Year
The average sold property price by year was:
| Year | Average Sold Price | Price Change |
Sold Properties
|
|---|---|---|---|
| 2025 | £377,222 | -26% |
9 Properties |
| 2024 | £476,625 | -3% |
8 Properties |
| 2023 | £488,950 | -15% |
10 Properties |
| 2022 | £564,125 | 30% |
10 Properties |
| 2021 | £397,277 | -24% |
11 Properties |
| 2020 | £493,541 | -47% |
12 Properties |
| 2019 | £726,250 | 31% |
12 Properties |
| 2018 | £500,454 | 19% |
11 Properties |
| 2017 | £403,635 | 47% |
11 Properties |
| 2016 | £215,571 | -61% |
7 Properties |
| 2015 | £347,222 | -10% |
9 Properties |
| 2014 | £381,950 | -50% |
10 Properties |
| 2013 | £572,071 | 36% |
7 Properties |
| 2012 | £368,357 | 35% |
7 Properties |
| 2011 | £239,083 | -93% |
6 Properties |
| 2010 | £462,000 | 33% |
5 Properties |
| 2009 | £308,681 | -20% |
6 Properties |
| 2008 | £371,357 | 13% |
7 Properties |
| 2007 | £322,853 | -21% |
16 Properties |
| 2006 | £389,050 | -2% |
10 Properties |
| 2005 | £398,608 | 29% |
13 Properties |
| 2004 | £282,142 | 23% |
14 Properties |
| 2003 | £217,895 | -6% |
12 Properties |
| 2002 | £232,041 | 18% |
12 Properties |
| 2001 | £191,200 | -8% |
10 Properties |
| 2000 | £206,611 | 20% |
13 Properties |
| 1999 | £166,230 | 12% |
13 Properties |
| 1998 | £146,200 | -0,3% |
10 Properties |
| 1997 | £146,657 | 12% |
19 Properties |
| 1996 | £129,431 | -16% |
8 Properties |
| 1995 | £150,681 | - |
11 Properties |
Property Price per Property Type in Boltons
Here you can find historic sold price data in order to help with your property search.
The average Property Paid Price for specific property types in the last three years are:
| Property Type | Average Sold Price | Sold Properties |
|---|---|---|
| Semi Detached House | £557,500.00 | 2 Semi Detached Houses |
| Terraced House | £372,500.00 | 4 Terraced Houses |
| Detached House | £452,625.00 | 20 Detached Houses |
| Flat | £440,000.00 | 1 Flat |

