
Houses for sale in Keswick, Keswick
House Prices in Keswick
Properties in Keswick have an average house price of £381k and had 257 Property Transactions within the last 3 years¹.
Keswick is an area in Keswick, Cumbria with 2,426 households², where the most expensive property was sold for £1.3M.
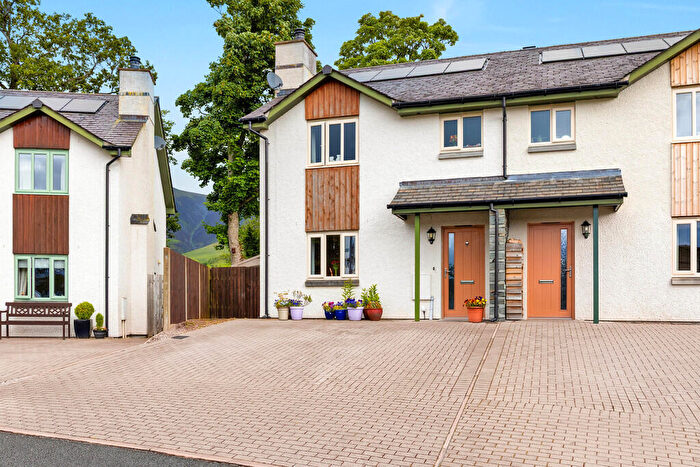
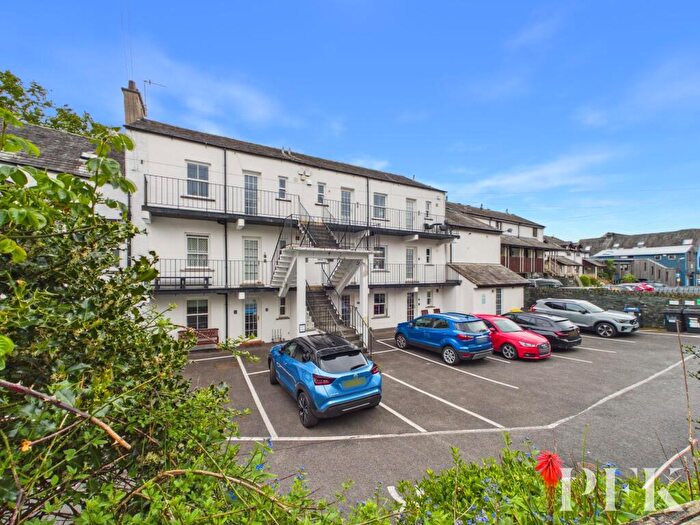
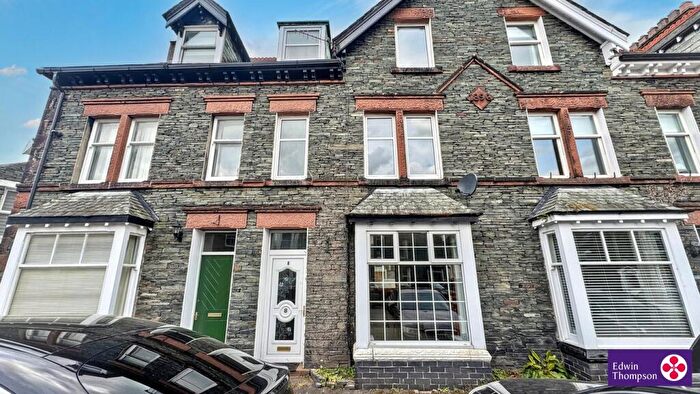
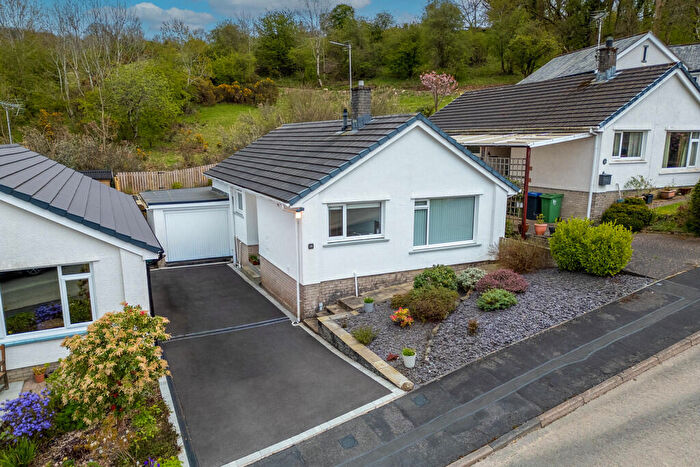
Properties for sale in Keswick
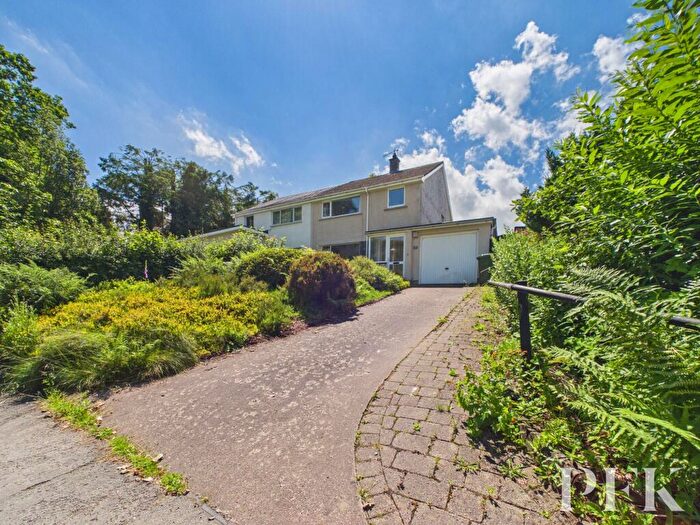
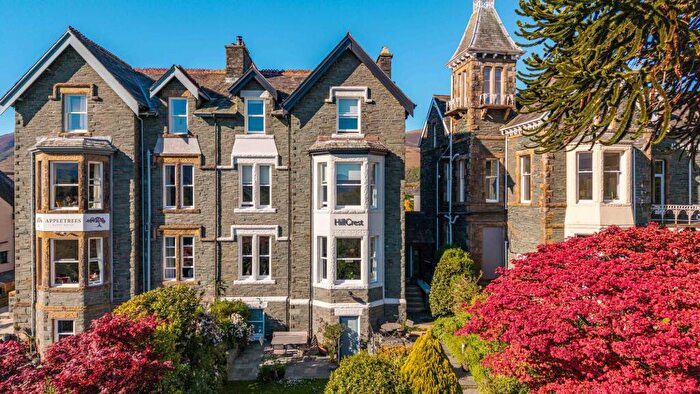
![]()
If you are looking to sell your house, let it out, or receive a property valuation, an expert can help you.
Click the button below to get started.
Roads and Postcodes in Keswick
Navigate through our locations to find the location of your next house in Keswick, Keswick for sale or to rent.
Property price trends in Keswick
According to the latest Land Registry data, the average home in Keswick sold for £232,166 in 2026. That figure comes from 3,717 sales logged over the past 31 years.
Prices have fallen back over the last three years. Compared with 2023, when the typical sale came in around £359,997, that's a fall of roughly 35.5%.
Looking back five years, average prices are down about 35% since 2021, a drop of around £124,986 in cash terms.
Zoom out to the past decade for the fuller picture. Back in 2016, homes here averaged £281,042, so the typical sold price has fallen about 17.4% since then, around 1.9% a year lower. Stretch the view to fifteen years and that annual pace edges up closer to -1.1%.
Frequently asked questions about Keswick
What is the average price for a property for sale in Keswick?
The average price for a property for sale in Keswick is £381,334. This amount is 13% lower than the average price in Keswick. There are 410 property listings for sale in Keswick.
What streets have the most expensive properties for sale in Keswick?
The streets with the most expensive properties for sale in Keswick are Springs Road at an average of £1,050,000, Lonsties at an average of £934,850 and Rogerfield at an average of £815,000.
What streets have the most affordable properties for sale in Keswick?
The streets with the most affordable properties for sale in Keswick are Glebe Close at an average of £52,500, Eskin Street at an average of £126,941 and Forge Lane at an average of £135,000.
Which train stations are available in or near Keswick?
Some of the train stations available in or near Keswick are Aspatria, Penrith and Wigton.
Property Price Paid in Keswick by Year
The average sold property price by year was:
| Year | Average Sold Price | Price Change |
Sold Properties
|
|---|---|---|---|
| 2026 | £232,166 | -55% |
6 Properties |
| 2025 | £359,510 | -19% |
84 Properties |
| 2024 | £429,134 | 16% |
91 Properties |
| 2023 | £359,997 | -14% |
76 Properties |
| 2022 | £411,264 | 13% |
100 Properties |
| 2021 | £357,152 | 3% |
149 Properties |
| 2020 | £344,773 | 7% |
102 Properties |
| 2019 | £319,968 | 6% |
127 Properties |
| 2018 | £299,713 | -1% |
114 Properties |
| 2017 | £302,323 | 7% |
138 Properties |
Property Price per Property Type in Keswick
Here you can find historic sold price data in order to help with your property search.
The average Property Paid Price for specific property types in the last three years are:
| Property Type | Average Sold Price | Sold Properties |
|---|---|---|
| Flat | £218,787.00 | 67 Flats |
| Semi Detached House | £381,992.00 | 53 Semi Detached Houses |
| Detached House | £593,306.00 | 56 Detached Houses |
| Terraced House | £368,806.00 | 81 Terraced Houses |
