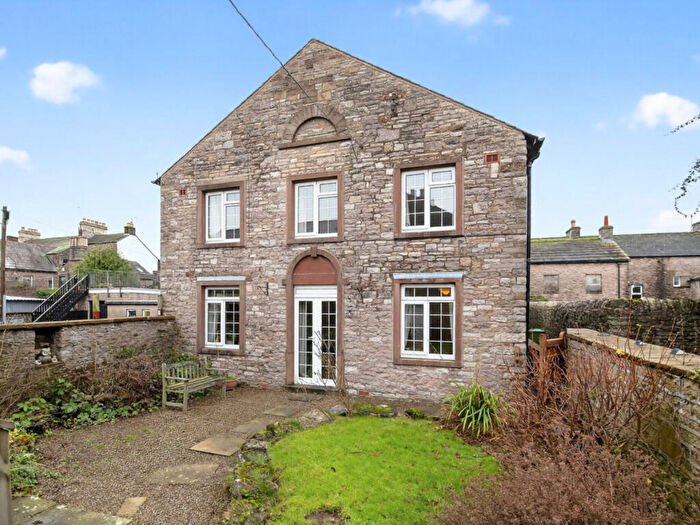
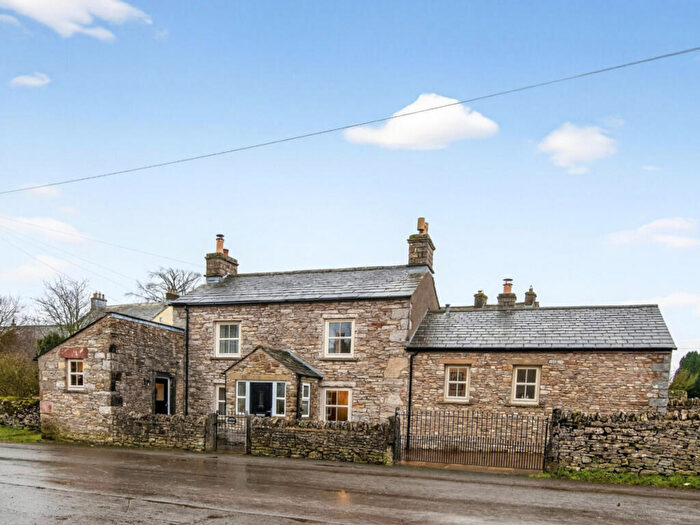
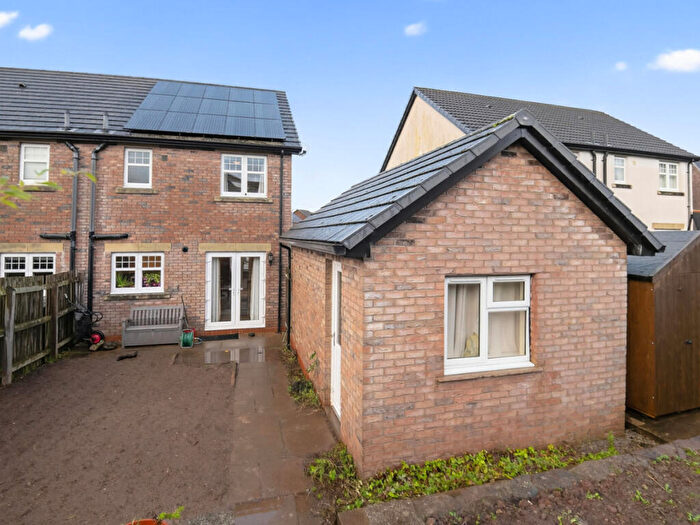
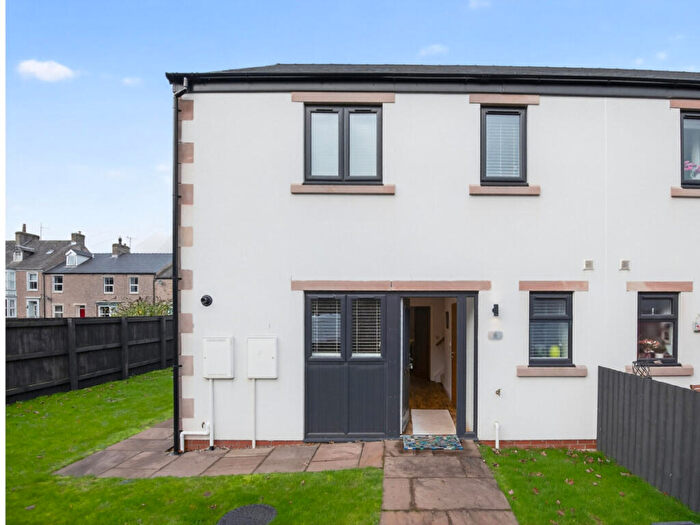
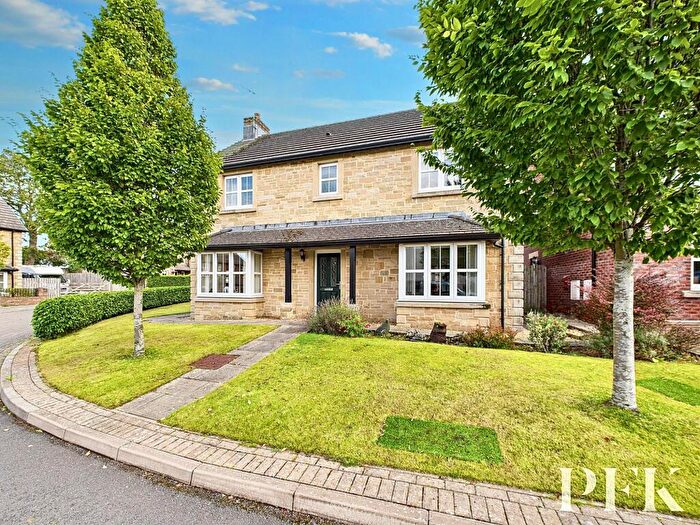
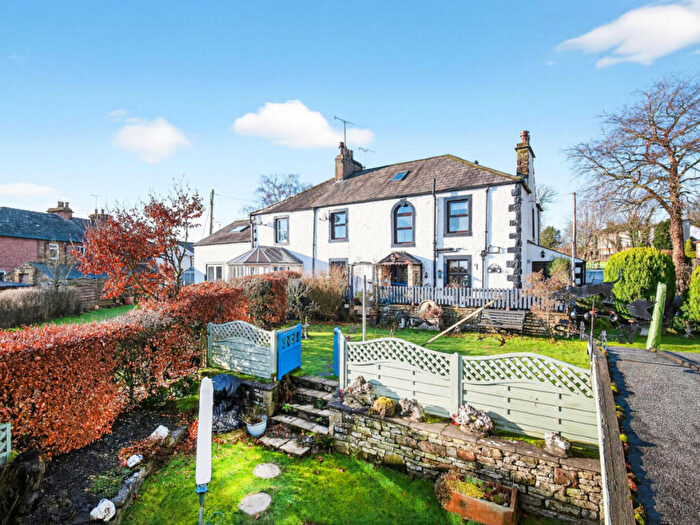
Houses for sale & to rent in Kirkby Stephen, Kirkby Stephen
House Prices in Kirkby Stephen
Properties in Kirkby Stephen have an average house price of £270,775.00 and had 98 Property Transactions within the last 3 years¹.
Kirkby Stephen is an area in Kirkby Stephen, Cumbria with 1,169 households², where the most expensive property was sold for £740,000.00.
Properties for sale in Kirkby Stephen
Roads and Postcodes in Kirkby Stephen
Navigate through our locations to find the location of your next house in Kirkby Stephen, Kirkby Stephen for sale or to rent.
| Streets | Postcodes |
|---|---|
| Aisgill Moor Bungalows | CA17 4JY |
| Appleby Road | CA17 4PD CA17 4PE CA17 4PG |
| Birkbeck Gardens | CA17 4TH |
| Bollam Terrace | CA17 4AL |
| Brockbank Terrace | CA17 4ST |
| Castle Cottages | CA17 4JT |
| Christian Head | CA17 4HA |
| Church Walk | CA17 4RA |
| Crayton Terrace | CA17 4JW |
| Croft Street | CA17 4QJ |
| Croglam Meadows | CA17 4SW |
| Croglam Park | CA17 4SF |
| East View Cottages | CA17 4RJ |
| Eden Terrace | CA17 4RZ |
| Faraday Road | CA17 4AU CA17 4QL CA17 4LH CA17 4RQ CA17 4TL |
| Fell View | CA17 4HW |
| Fletcher Hill | CA17 4QH CA17 4QQ |
| Fletcher Hill Park | CA17 4QZ |
| Gasgarth Mews | CA17 4RY |
| Hartley Road | CA17 4RT CA17 4RX CA17 4RU |
| High Street | CA17 4SG CA17 4SH CA17 4SE |
| Hobson Lane | CA17 4RN |
| Kings Terrace | CA17 4HN |
| Levens Close | CA17 4RR |
| Manor Court | CA17 4SJ |
| Market Square | CA17 4QT |
| Market Street | CA17 4QN CA17 4QS CA17 4QW |
| Mell Wood | CA17 4SD |
| Mellbecks | CA17 4AA CA17 4AB CA17 4AQ |
| Mellbecks Mews | CA17 4AG |
| Nateby Road | CA17 4AE CA17 4AJ CA17 4JN CA17 4QD CA17 4QE |
| New Midland Cottages | CA17 4LG |
| North Road | CA17 4QG CA17 4RE CA17 4RH CA17 4RP CA17 4RW |
| Old Midland Cottages | CA17 4LF |
| Orchard Lane | CA17 4JE |
| Park Terrace | CA17 4SX |
| Primrose Hill | CA17 4SQ |
| Quarry Close | CA17 4SS |
| Redmayne Road | CA17 4RL |
| River Side | CA17 4SA |
| Rowgate | CA17 4SP CA17 4SR |
| Royal Arcade | CA17 4QP |
| Silver Street | CA17 4RB |
| South Road | CA17 4SN CA17 4SY CA17 4SU |
| St Lukes Road | CA17 4HT |
| Station Road | CA17 4SZ |
| Station Yard | CA17 4LA |
| Stonehill Mews | CA17 4QR |
| The Close | CA17 4TE |
| The Crescent | CA17 4AF CA17 4AH |
| The Green | CA17 4RG CA17 4RS |
| Union Square | CA17 4RF |
| Vicarage Lane | CA17 4QX |
| Victoria Corner | CA17 4AD |
| Victoria Square | CA17 4QA |
| Victoria Terrace | CA17 4QF |
| Westbrook Fields | CA17 4SB |
| Westbrook Terrace | CA17 4SL |
| Westgarth Avenue | CA17 4TD |
| Westgarth Court | CA17 4TQ |
| Westgarth Gate | CA17 4TG |
| Westgarth Grove | CA17 4TB |
| Westgarth Road | CA17 4TF |
| Winton Manor Court | CA17 4HR |
| CA17 4AP CA17 4EF CA17 4ER CA17 4HE CA17 4HL CA17 4HP CA17 4HS CA17 4HX CA17 4HZ CA17 4JF CA17 4JH CA17 4JJ CA17 4JP CA17 4JR CA17 4JU CA17 4JX CA17 4LE CA17 4LQ CA17 4QU CA17 4EE CA17 4GH CA17 4HB CA17 4HD CA17 4HU CA17 4HY CA17 4JA CA17 4JB CA17 4LD CA17 4QY CA17 4RD CA17 4TA CA17 4TJ CA17 4YW |
Transport near Kirkby Stephen
- FAQ
- Price Paid By Year
- Property Type Price
Frequently asked questions about Kirkby Stephen
What is the average price for a property for sale in Kirkby Stephen?
The average price for a property for sale in Kirkby Stephen is £270,775. This amount is 10% lower than the average price in Kirkby Stephen. There are 356 property listings for sale in Kirkby Stephen.
What streets have the most expensive properties for sale in Kirkby Stephen?
The streets with the most expensive properties for sale in Kirkby Stephen are Castle Cottages at an average of £523,000, Croglam Park at an average of £422,000 and Hartley Road at an average of £400,000.
What streets have the most affordable properties for sale in Kirkby Stephen?
The streets with the most affordable properties for sale in Kirkby Stephen are Vicarage Lane at an average of £78,000, Faraday Road at an average of £150,666 and Primrose Hill at an average of £152,000.
Which train stations are available in or near Kirkby Stephen?
Some of the train stations available in or near Kirkby Stephen are Kirkby Stephen, Appleby and Garsdale.
Property Price Paid in Kirkby Stephen by Year
The average sold property price by year was:
| Year | Average Sold Price | Price Change |
Sold Properties
|
|---|---|---|---|
| 2025 | £251,250 | -6% |
26 Properties |
| 2024 | £267,062 | -9% |
40 Properties |
| 2023 | £291,281 | -9% |
32 Properties |
| 2022 | £318,270 | 6% |
50 Properties |
| 2021 | £298,198 | 26% |
53 Properties |
| 2020 | £222,058 | 5% |
34 Properties |
| 2019 | £210,652 | 21% |
33 Properties |
| 2018 | £166,036 | -17% |
41 Properties |
| 2017 | £195,002 | 5% |
47 Properties |
| 2016 | £184,525 | -2% |
49 Properties |
| 2015 | £188,023 | -14% |
42 Properties |
| 2014 | £213,538 | 13% |
58 Properties |
| 2013 | £185,763 | 2% |
49 Properties |
| 2012 | £182,407 | 4% |
34 Properties |
| 2011 | £175,301 | -32% |
34 Properties |
| 2010 | £231,098 | 19% |
23 Properties |
| 2009 | £187,125 | -24% |
24 Properties |
| 2008 | £231,685 | 16% |
27 Properties |
| 2007 | £195,511 | 7% |
45 Properties |
| 2006 | £182,652 | 7% |
45 Properties |
| 2005 | £170,750 | 8% |
38 Properties |
| 2004 | £157,828 | 16% |
54 Properties |
| 2003 | £132,374 | 5% |
58 Properties |
| 2002 | £126,014 | 29% |
56 Properties |
| 2001 | £89,597 | 17% |
62 Properties |
| 2000 | £74,333 | 4% |
50 Properties |
| 1999 | £71,340 | 13% |
66 Properties |
| 1998 | £62,384 | -39% |
46 Properties |
| 1997 | £86,829 | 36% |
44 Properties |
| 1996 | £55,289 | -8% |
51 Properties |
| 1995 | £59,815 | - |
27 Properties |
Property Price per Property Type in Kirkby Stephen
Here you can find historic sold price data in order to help with your property search.
The average Property Paid Price for specific property types in the last three years are:
| Property Type | Average Sold Price | Sold Properties |
|---|---|---|
| Semi Detached House | £230,761.00 | 21 Semi Detached Houses |
| Detached House | £379,621.00 | 41 Detached Houses |
| Terraced House | £175,854.00 | 31 Terraced Houses |
| Flat | £134,800.00 | 5 Flats |

