
Houses for sale in Holborn Hill, Millom
House Prices in Holborn Hill
Properties in Holborn Hill have an average house price of £139k and had 115 Property Transactions within the last 3 years¹.
Holborn Hill is an area in Millom, Cumbria with 992 households², where the most expensive property was sold for £380k.
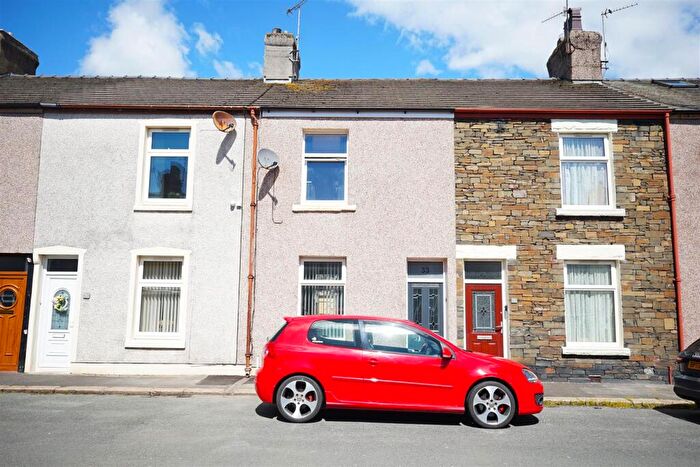
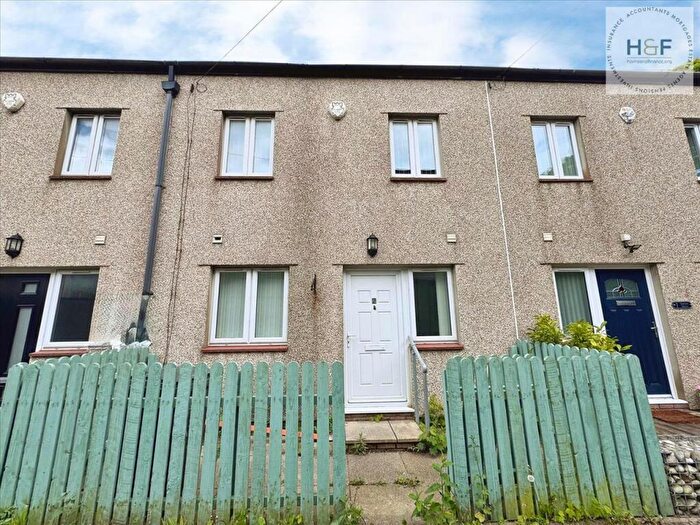
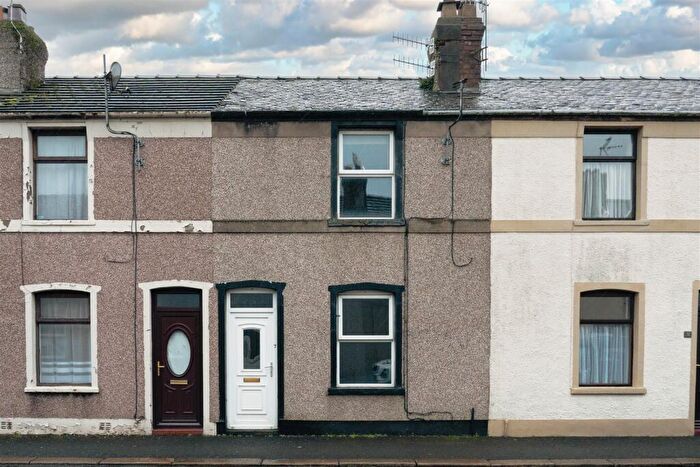
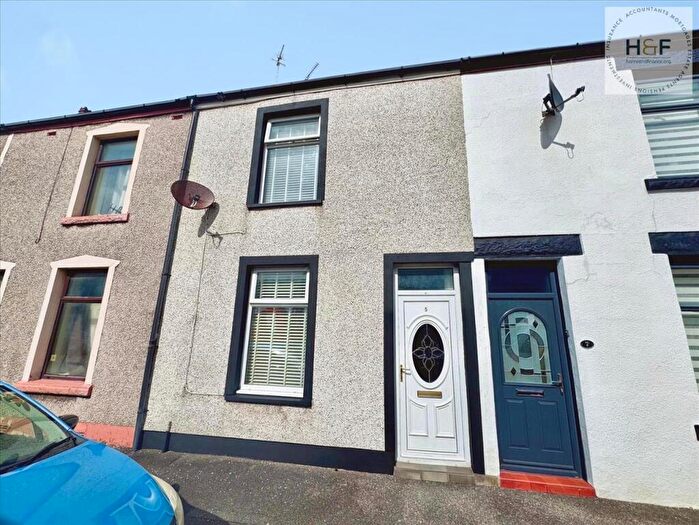
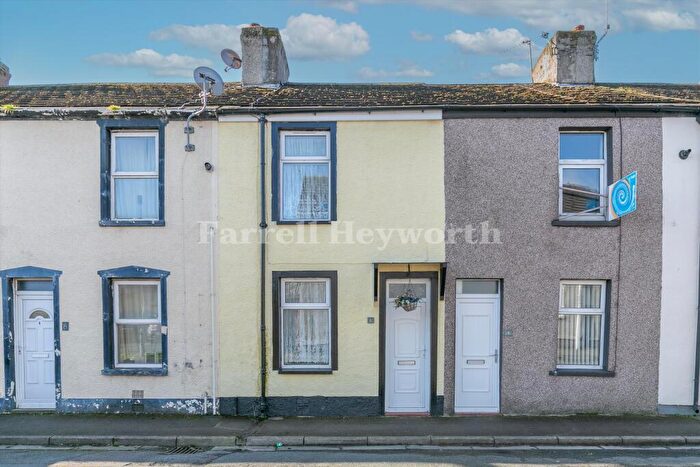
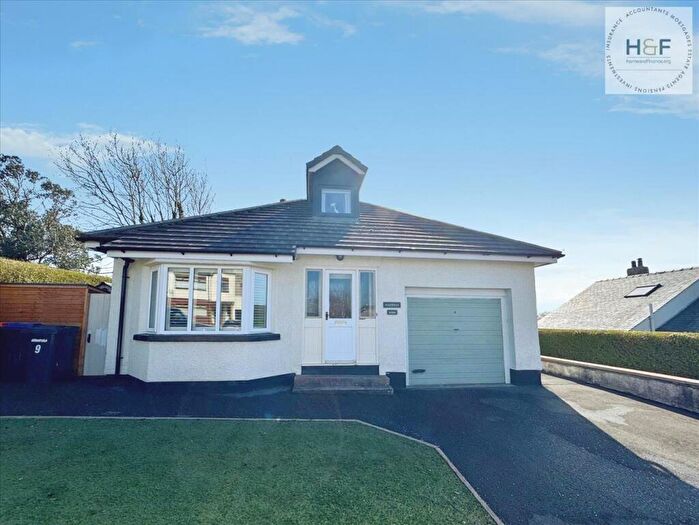
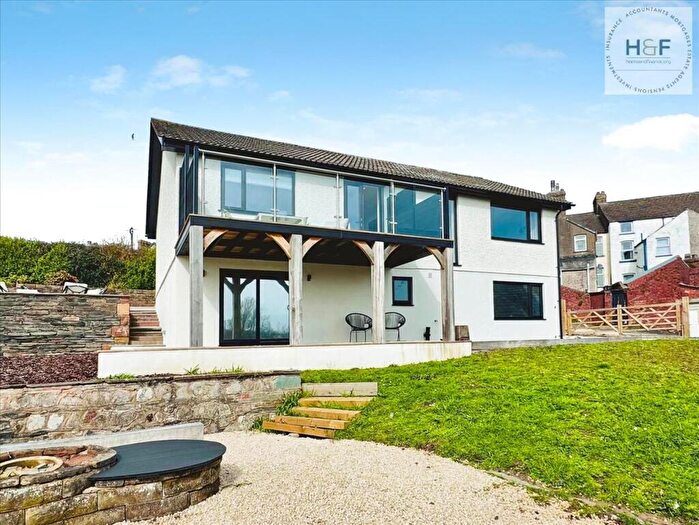
Properties for sale in Holborn Hill
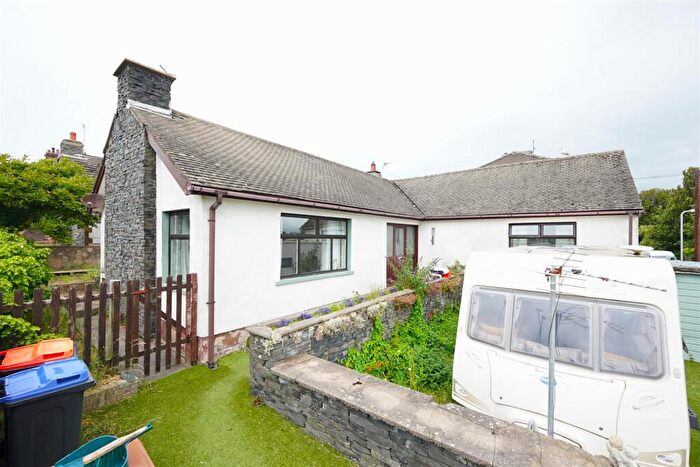
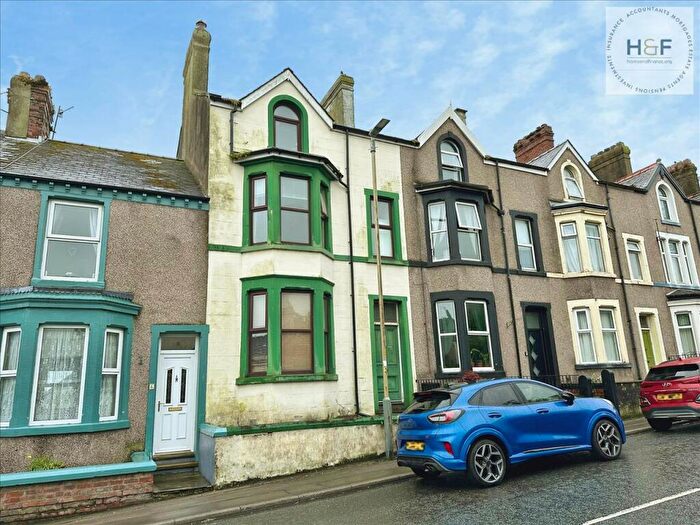
![]()
If you are looking to sell your house, let it out, or receive a property valuation, an expert can help you.
Click the button below to get started.
Roads and Postcodes in Holborn Hill
Navigate through our locations to find the location of your next house in Holborn Hill, Millom for sale or to rent.
| Streets | Postcodes |
|---|---|
| Bay View | LA18 5DF |
| Butler Street | LA18 5DU |
| Cambridge Street | LA18 5BD |
| Castle View | LA18 5AQ |
| Church Walk | LA18 5BZ |
| Churchill Drive | LA18 5DD |
| Cleator Street | LA18 5DA |
| Duke Street | LA18 5BB |
| Fairfield Road | LA18 5AJ |
| Festival Road | LA18 5AN LA18 5AW |
| Finch Street | LA18 5AG |
| Grammerscroft | LA18 5EH LA18 5EJ LA18 5EL LA18 5EQ |
| Hodgson Gardens | LA18 5LE |
| Holborn Hill | LA18 5AT LA18 5BE LA18 5BH LA18 5BJ LA18 5BL LA18 5BN LA18 5BW |
| Holborn Terrace | LA18 5BS |
| Horn Hill | LA18 5DP |
| Huddleston Road | LA18 5AH |
| Kingsland Road | LA18 5BP |
| Leyfield Close | LA18 5AU |
| Moor Park | LA18 5DX |
| Moor Road | LA18 5DR LA18 5DS LA18 5DT |
| Moor Terrace | LA18 5EN |
| Mountbatten Way | LA18 5EP |
| Munroe Avenue | LA18 5AL |
| Newton Terrace | LA18 5BX |
| Old Moor Close | LA18 5LZ |
| Old Moor Gardens | LA18 5ER |
| Palmers Lane | LA18 5ED LA18 5EE LA18 5EF LA18 5EG |
| Pannatt Hill | LA18 5DB LA18 5DH |
| Peters Drive | LA18 5DG |
| Queens Park | LA18 5DY LA18 5DZ LA18 5EA LA18 5EB |
| Red Lion Court | LA18 5BG |
| Robinson Row | LA18 5BT |
| Salthouse Road | LA18 5AD LA18 5AE LA18 5AF LA18 5EX |
| Scales View | LA18 5EW |
| Sea View | LA18 5BU |
| Settle Street | LA18 5AR |
| St Georges Road | LA18 5BA LA18 5DW |
| Station Mews | LA18 5AY |
| Victoria Street | LA18 5AS |
| LA18 5BY |
Property price trends in Holborn Hill
According to the latest Land Registry data, the average home in Holborn Hill sold for £101,333 in 2026. That figure comes from 1,354 sales logged over the past 31 years.
Prices have fallen back over the last three years. Compared with 2023, when the typical sale came in around £144,594, that's a fall of roughly 29.9%.
Looking back five years, average prices are down about 18.1% since 2021, a drop of around £22,381 in cash terms.
Zoom out to the past decade for the fuller picture. Back in 2016, homes here averaged £116,250, so the typical sold price has fallen about 12.8% since then, around 1.4% a year lower. Stretch the view to fifteen years and that annual pace edges up closer to -0.6%.
Frequently asked questions about Holborn Hill
What is the average price for a property for sale in Holborn Hill?
The average price for a property for sale in Holborn Hill is £139,057. This amount is 0.16% higher than the average price in Millom. There are 194 property listings for sale in Holborn Hill.
What streets have the most expensive properties for sale in Holborn Hill?
The streets with the most expensive properties for sale in Holborn Hill are Hodgson Gardens at an average of £380,000, Castle View at an average of £340,000 and Old Moor Close at an average of £280,000.
What streets have the most affordable properties for sale in Holborn Hill?
The streets with the most affordable properties for sale in Holborn Hill are Old Moor Gardens at an average of £60,000, Moor Terrace at an average of £80,000 and Finch Street at an average of £89,500.
Which train stations are available in or near Holborn Hill?
Some of the train stations available in or near Holborn Hill are Millom, Silecroft and Green Road.
Property Price Paid in Holborn Hill by Year
The average sold property price by year was:
| Year | Average Sold Price | Price Change |
Sold Properties
|
|---|---|---|---|
| 2026 | £101,333 | -55% |
6 Properties |
| 2025 | £157,078 | 24% |
38 Properties |
| 2024 | £119,547 | -21% |
34 Properties |
| 2023 | £144,594 | 3% |
37 Properties |
| 2022 | £139,600 | 11% |
40 Properties |
| 2021 | £123,714 | -10% |
46 Properties |
| 2020 | £135,887 | 15% |
29 Properties |
| 2019 | £115,187 | 4% |
44 Properties |
| 2018 | £110,670 | -16% |
44 Properties |
| 2017 | £128,712 | 10% |
36 Properties |
Property Price per Property Type in Holborn Hill
Here you can find historic sold price data in order to help with your property search.
The average Property Paid Price for specific property types in the last three years are:
| Property Type | Average Sold Price | Sold Properties |
|---|---|---|
| Semi Detached House | £148,563.00 | 49 Semi Detached Houses |
| Detached House | £287,500.00 | 8 Detached Houses |
| Terraced House | £110,551.00 | 58 Terraced Houses |
