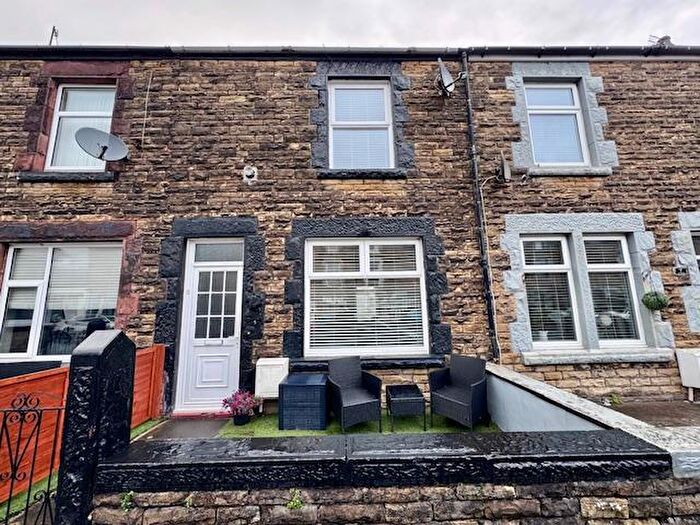
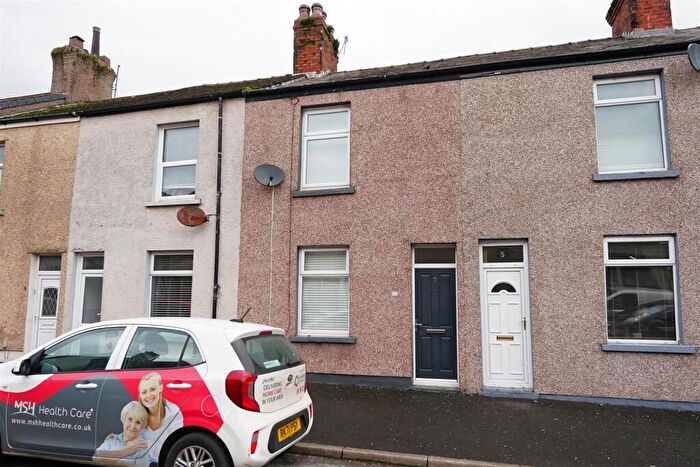
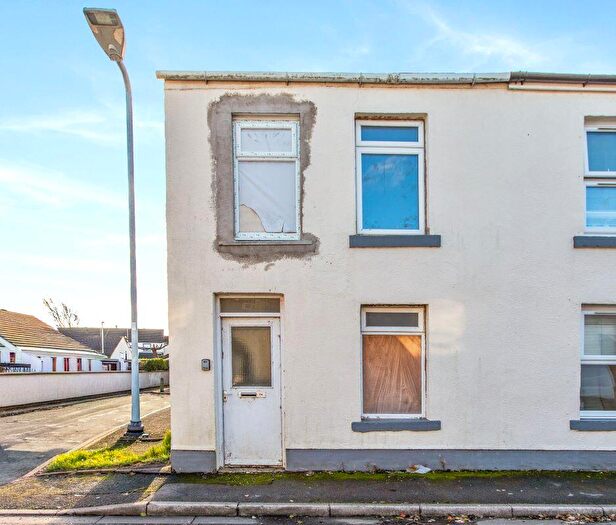
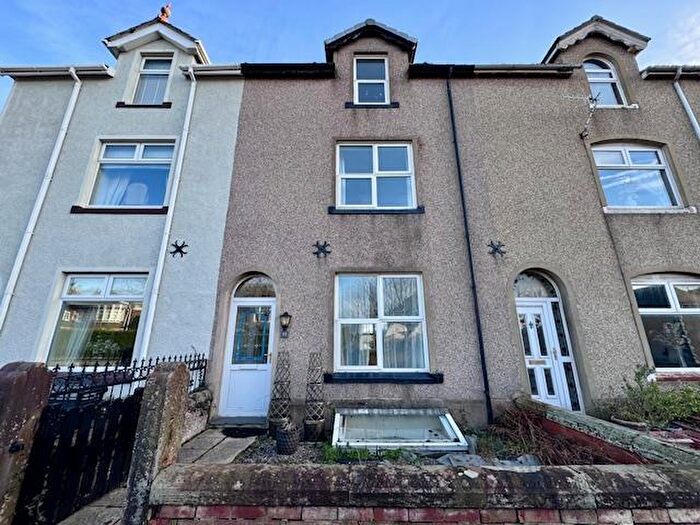
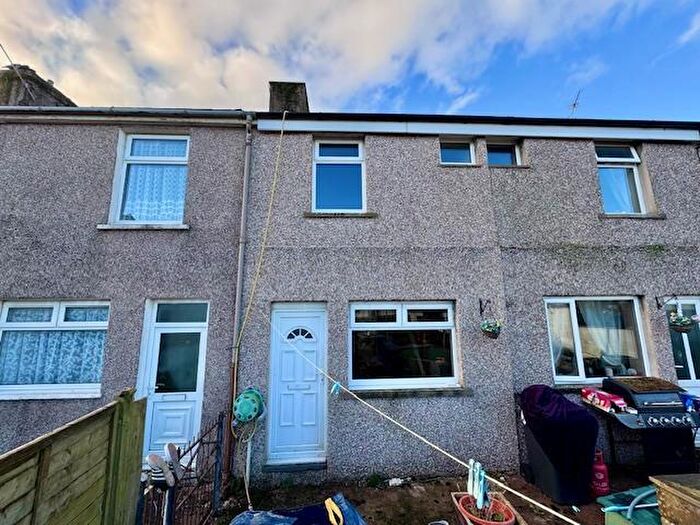
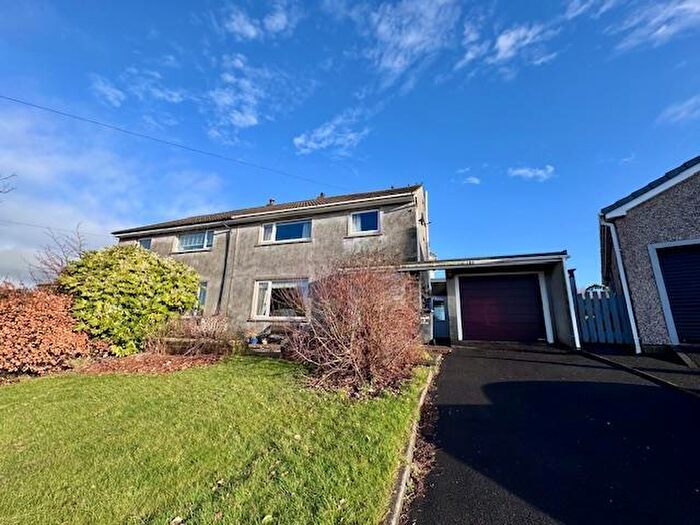
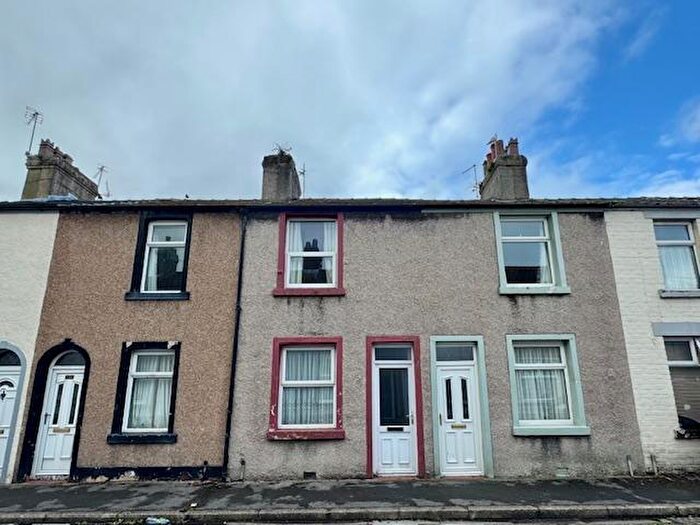
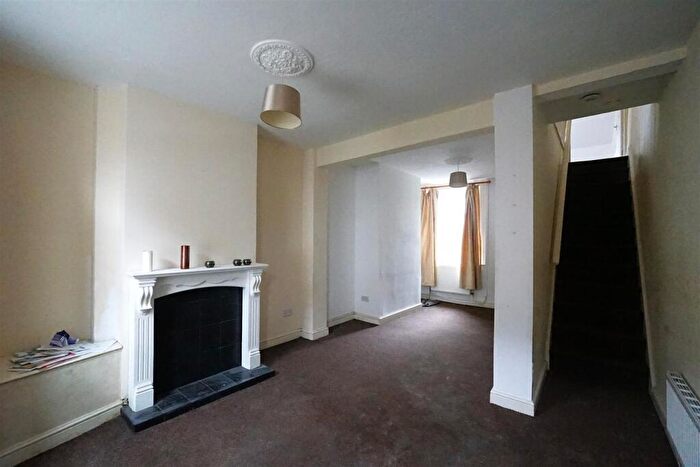
Houses for sale & to rent in Newtown, Millom
House Prices in Newtown
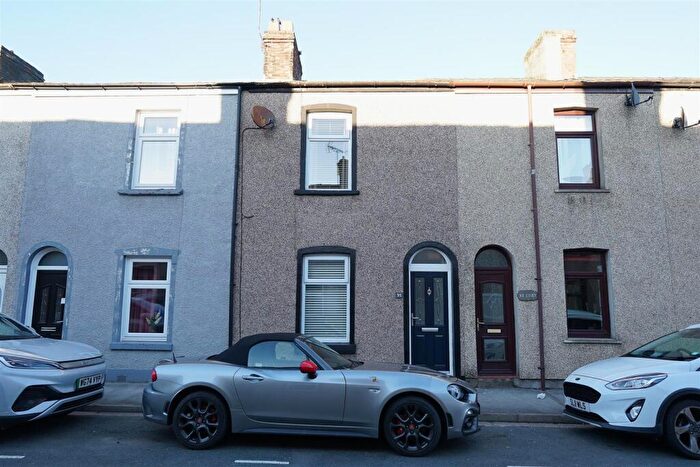
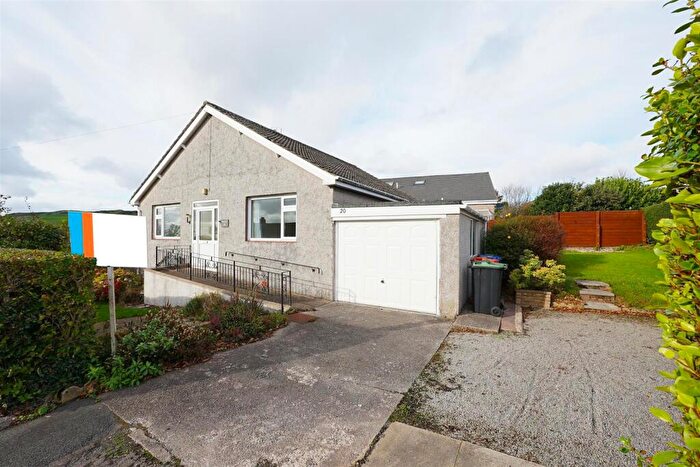
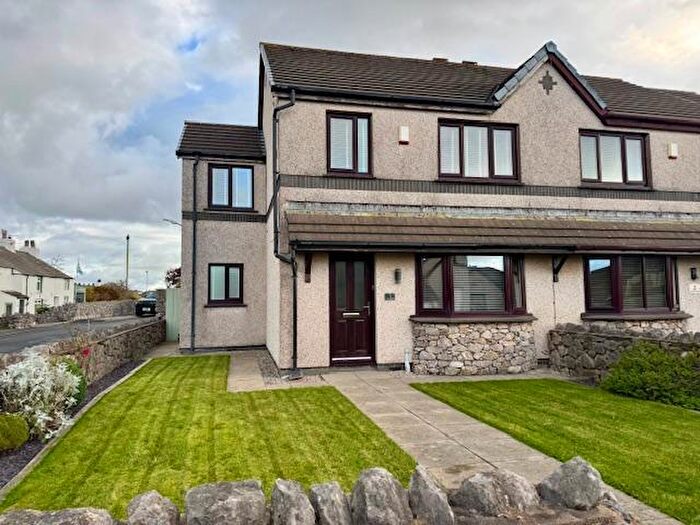
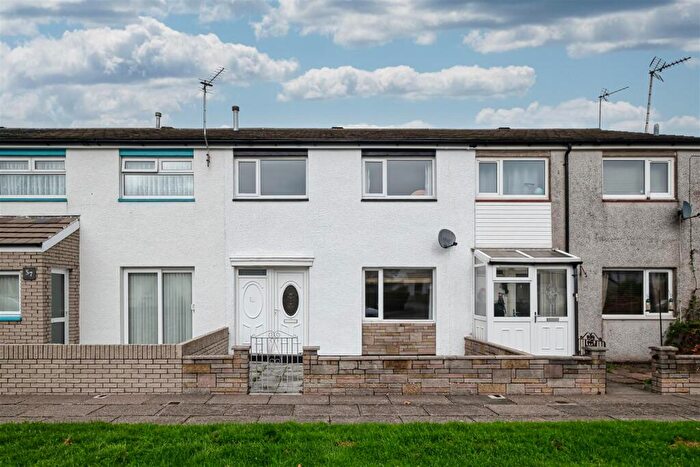
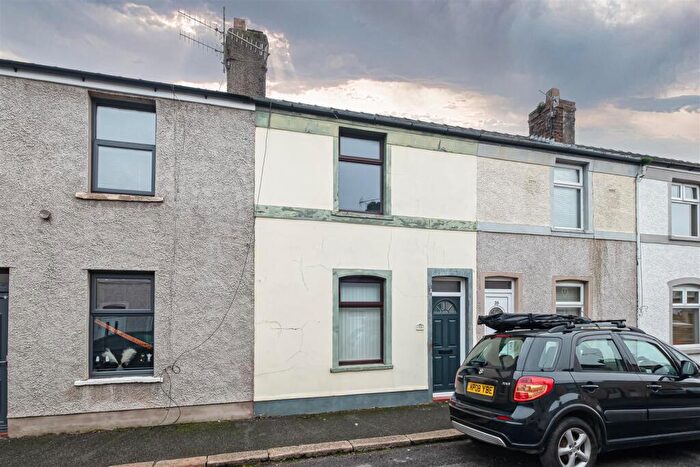
Properties in Newtown have an average house price of £107,500.00 and had 213 Property Transactions within the last 3 years¹.
Newtown is an area in Millom, Cumbria with 1,475 households², where the most expensive property was sold for £400,000.00.
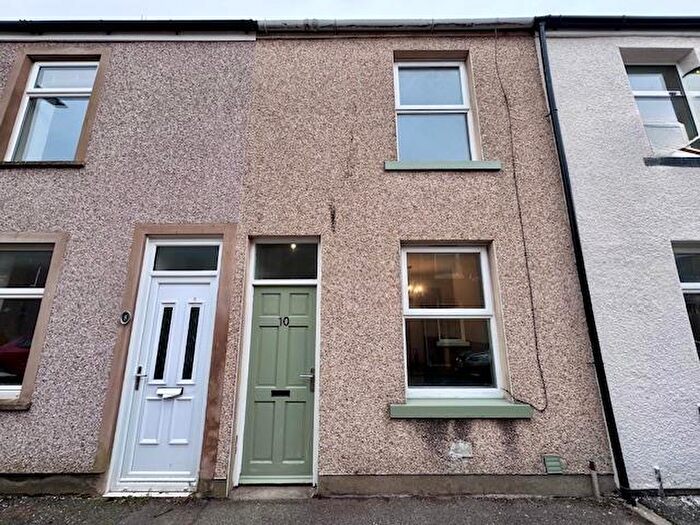
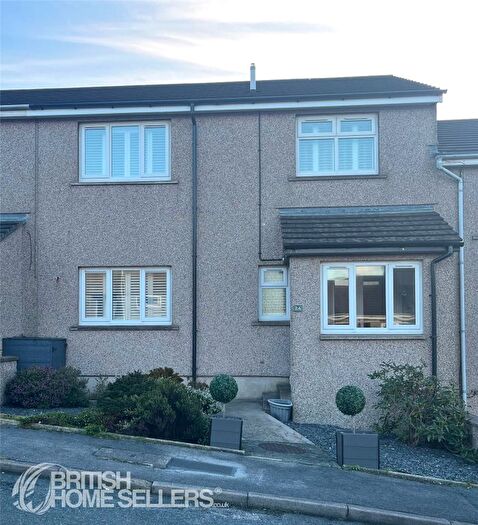
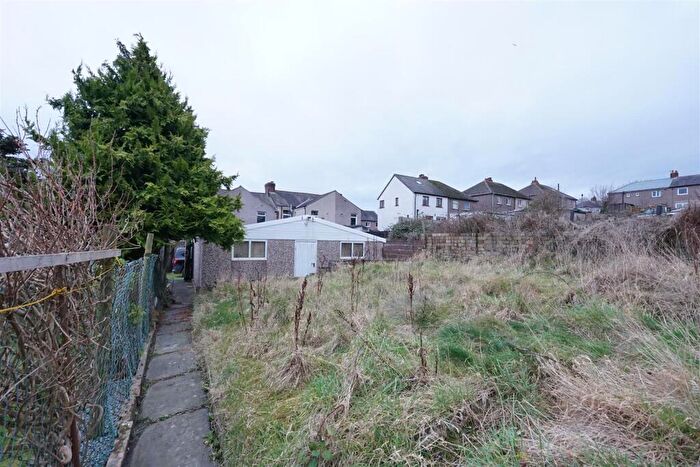
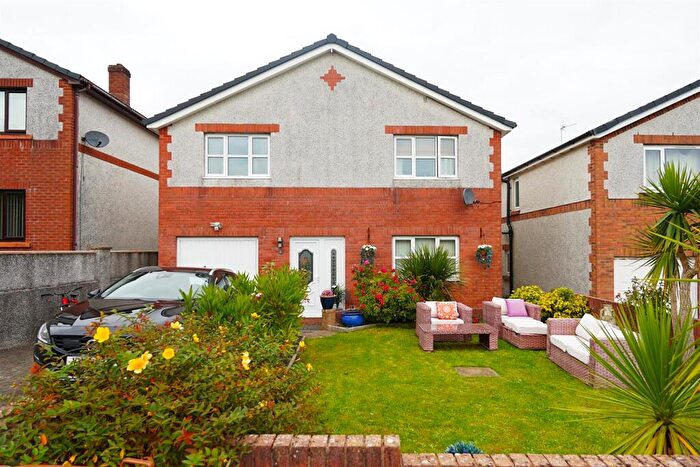
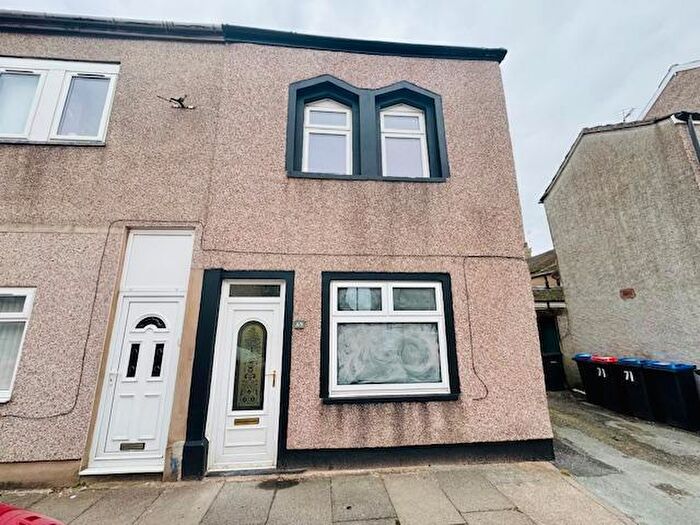
Properties for sale in Newtown
Roads and Postcodes in Newtown
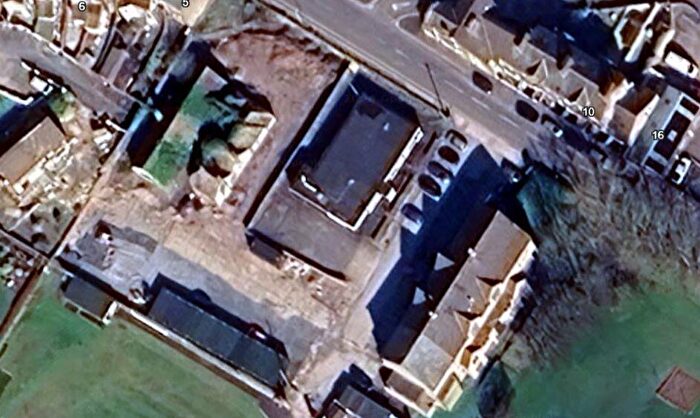
Navigate through our locations to find the location of your next house in Newtown, Millom for sale or to rent.
| Streets | Postcodes |
|---|---|
| Albert Street | LA18 4AB LA18 4AD LA18 4AE LA18 4AF |
| Argyle Street | LA18 4FA |
| Bassenthwaite Close | LA18 4PD |
| Bedford Street | LA18 4JN |
| Borwick Rails | LA18 4JT LA18 4JU |
| Bowness Road | LA18 4LA LA18 4LS |
| Buttermere Drive | LA18 4PL |
| Castle Street | LA18 4DX |
| Cook Road | LA18 4JH |
| Crown Street | LA18 4AG |
| Cumberland Close | LA18 4LR |
| Derwentwater Close | LA18 4PF |
| Devonshire Road | LA18 4JF LA18 4JP LA18 4LW |
| Earl Street | LA18 4AU LA18 4AX |
| Egremont Street | LA18 4EA |
| Ennerdale Close | LA18 4QS |
| Estuary Close | LA18 4FH |
| Hope Street | LA18 4JW |
| Katherine Street | LA18 4AQ |
| King Street | LA18 4BB LA18 4BD LA18 4DL |
| Lancashire Road | LA18 4AN LA18 4AW LA18 4FD |
| Langdale Close | LA18 4PP |
| Lapstone Road | LA18 4BT LA18 4BU LA18 4BZ |
| Lincoln Street | LA18 4EB |
| Lonsdale Road | LA18 4AP LA18 4AR LA18 4AS |
| Lonsdale Terrace | LA18 4AT |
| Lord Street | LA18 4BL LA18 4BN |
| Lowther Road | LA18 4LN LA18 4PE LA18 4PN LA18 4PQ LA18 4PW |
| Mainsgate Road | LA18 4JZ LA18 4LB |
| Market Square | LA18 4HZ |
| Market Street | LA18 4AH LA18 4AJ LA18 4AL |
| Millom Road | LA18 4AZ |
| Moor Cottages | LA18 4JD |
| Nelson Street | LA18 4DP LA18 4DW |
| Newton Street | LA18 4DR LA18 4DS LA18 4DT |
| Nicholson Close | LA18 4QX |
| Oxford Street | LA18 4LJ |
| Park Road | LA18 4JL |
| Queen Street | LA18 4BG LA18 4BH LA18 4BQ LA18 4DN |
| Richmond Street | LA18 4LQ |
| Ruskin Close | LA18 4PX |
| Rydal Close | LA18 4QR |
| School Terrace | LA18 4DZ |
| Seathwaite Close | LA18 4PH |
| St Georges Road | LA18 4JA |
| Steel Green | LA18 4LG |
| Surrey Street | LA18 4LH |
| Thirlmere Close | LA18 4PJ |
| Wasdale Road | LA18 4JJ |
| Wellington Street | LA18 4DE LA18 4DF LA18 4DG LA18 4DH LA18 4DJ LA18 4DQ |
| Whinlatter Close | LA18 4QT |
| Windermere Gardens | LA18 4PB |
| Windsor Street | LA18 4DU |
Transport near Newtown
- FAQ
- Price Paid By Year
- Property Type Price
Frequently asked questions about Newtown
What is the average price for a property for sale in Newtown?
The average price for a property for sale in Newtown is £107,500. This amount is 22% lower than the average price in Millom. There are 185 property listings for sale in Newtown.
What streets have the most expensive properties for sale in Newtown?
The streets with the most expensive properties for sale in Newtown are Bassenthwaite Close at an average of £265,000, Lowther Road at an average of £257,000 and Windermere Gardens at an average of £255,000.
What streets have the most affordable properties for sale in Newtown?
The streets with the most affordable properties for sale in Newtown are Egremont Street at an average of £48,500, Windsor Street at an average of £53,625 and Newton Street at an average of £61,947.
Which train stations are available in or near Newtown?
Some of the train stations available in or near Newtown are Millom, Green Road and Askam.
Property Price Paid in Newtown by Year
The average sold property price by year was:
| Year | Average Sold Price | Price Change |
Sold Properties
|
|---|---|---|---|
| 2025 | £121,425 | 15% |
67 Properties |
| 2024 | £103,462 | 4% |
66 Properties |
| 2023 | £99,171 | 1% |
80 Properties |
| 2022 | £97,877 | 7% |
53 Properties |
| 2021 | £91,020 | -12% |
83 Properties |
| 2020 | £101,603 | 10% |
48 Properties |
| 2019 | £91,021 | -8% |
59 Properties |
| 2018 | £98,215 | -11% |
58 Properties |
| 2017 | £109,118 | 21% |
55 Properties |
| 2016 | £85,914 | -4% |
54 Properties |
| 2015 | £89,651 | -1% |
57 Properties |
| 2014 | £90,575 | 4% |
52 Properties |
| 2013 | £86,857 | -1% |
44 Properties |
| 2012 | £87,885 | 7% |
46 Properties |
| 2011 | £81,600 | -6% |
34 Properties |
| 2010 | £86,879 | 1% |
52 Properties |
| 2009 | £85,897 | -20% |
41 Properties |
| 2008 | £103,290 | 13% |
71 Properties |
| 2007 | £90,026 | 2% |
103 Properties |
| 2006 | £88,011 | 11% |
76 Properties |
| 2005 | £78,141 | 25% |
87 Properties |
| 2004 | £58,907 | 20% |
102 Properties |
| 2003 | £47,312 | 13% |
104 Properties |
| 2002 | £41,102 | 1% |
118 Properties |
| 2001 | £40,520 | 22% |
73 Properties |
| 2000 | £31,705 | -6% |
66 Properties |
| 1999 | £33,524 | 9% |
68 Properties |
| 1998 | £30,585 | -13% |
47 Properties |
| 1997 | £34,578 | 6% |
60 Properties |
| 1996 | £32,416 | -3% |
59 Properties |
| 1995 | £33,392 | - |
49 Properties |
Property Price per Property Type in Newtown
Here you can find historic sold price data in order to help with your property search.
The average Property Paid Price for specific property types in the last three years are:
| Property Type | Average Sold Price | Sold Properties |
|---|---|---|
| Semi Detached House | £165,050.00 | 20 Semi Detached Houses |
| Detached House | £247,519.00 | 26 Detached Houses |
| Terraced House | £80,915.00 | 152 Terraced Houses |
| Flat | £57,466.00 | 15 Flats |

