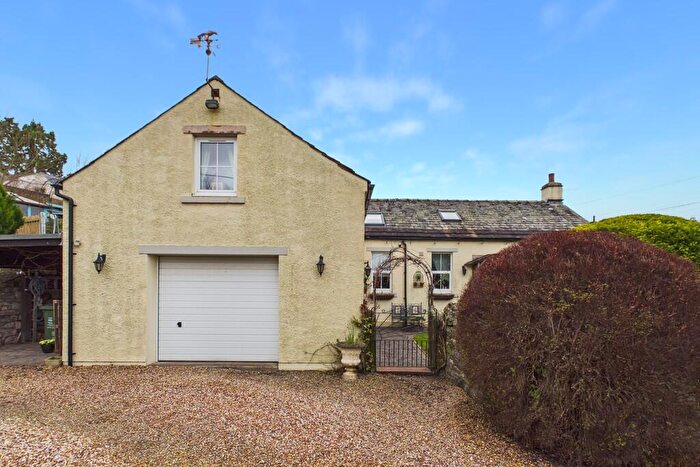
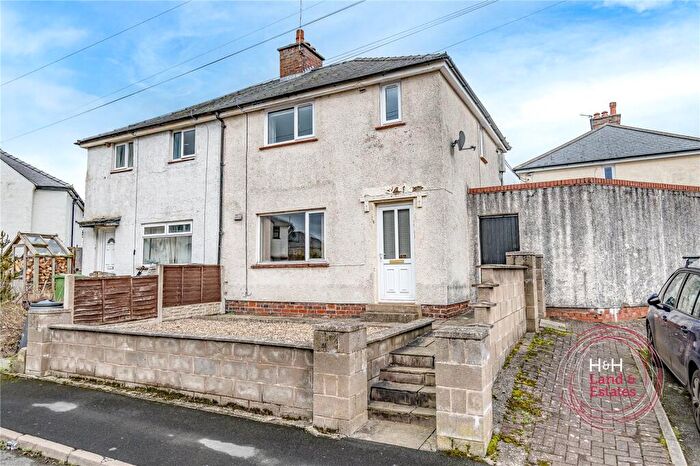
Houses for sale & to rent in Dacre, Penrith
House Prices in Dacre
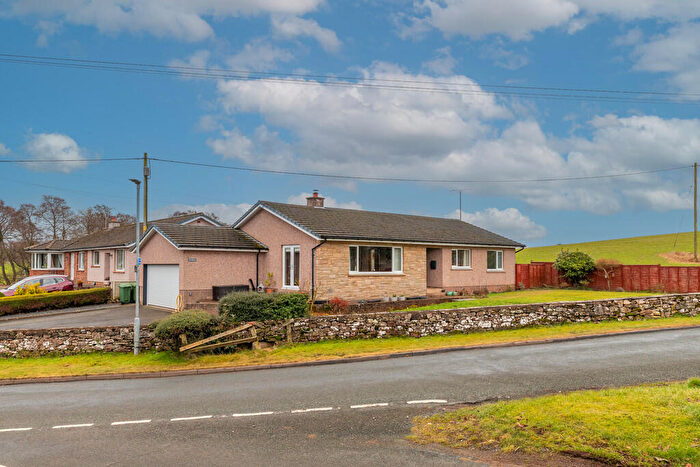
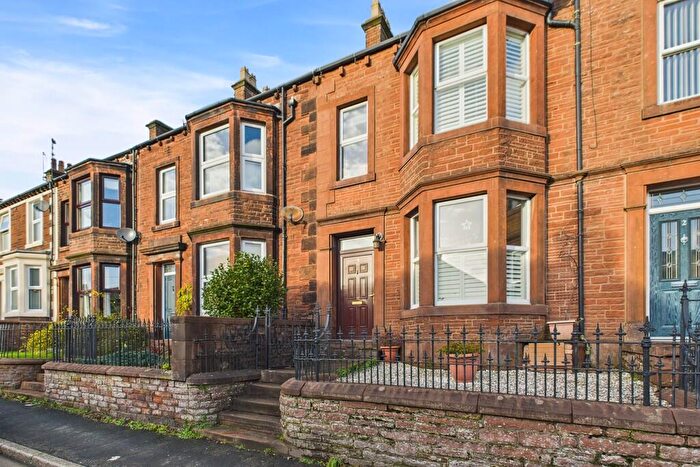
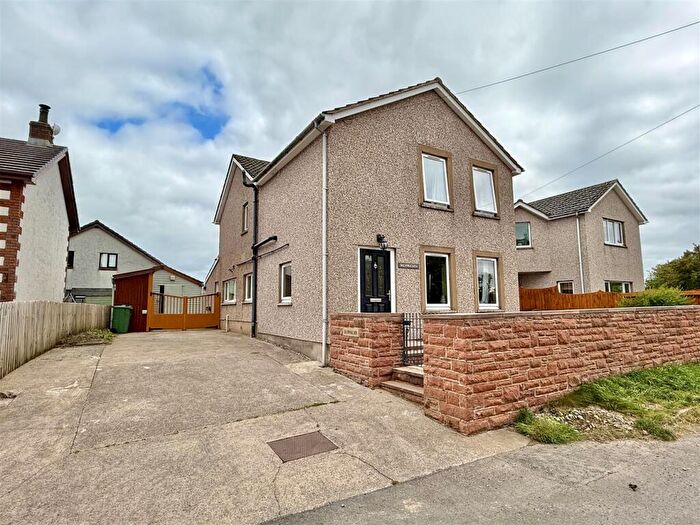
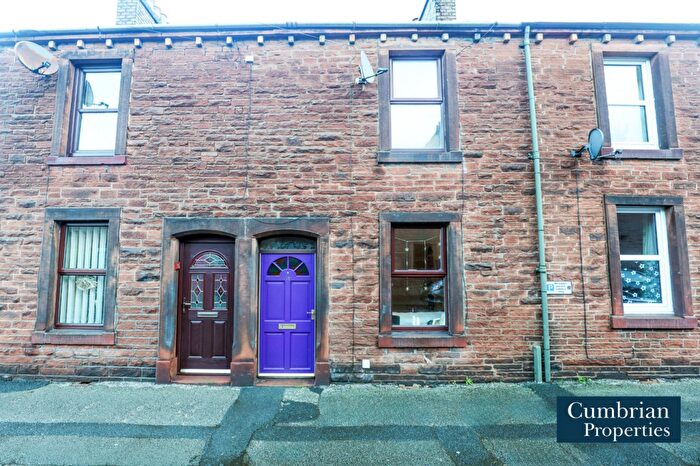
Properties in Dacre have an average house price of £384,131.00 and had 61 Property Transactions within the last 3 years¹.
Dacre is an area in Penrith, Cumbria with 635 households², where the most expensive property was sold for £1,060,000.00.
Properties for sale in Dacre
Roads and Postcodes in Dacre
Navigate through our locations to find the location of your next house in Dacre, Penrith for sale or to rent.
| Streets | Postcodes |
|---|---|
| Apple Garth | CA11 0DD |
| Beech Grove | CA11 0EL |
| Brooklyn | CA11 0DZ |
| Chestnut Court | CA11 0HF |
| Eamont Terrace | CA11 0DS |
| Fairybead Lane | CA11 0DX |
| Fairybead Park | CA11 0DY |
| Green Lane Cottages | CA11 0HN |
| Haw Bank | CA11 0ED |
| Howgate | CA11 0BH |
| Joiners Close | CA11 0HU |
| Keld Close | CA11 0EJ |
| Keld Head | CA11 0EH |
| Kells Spring | CA11 0BZ |
| Kirkside | CA11 0HD |
| Mill Park | CA11 0FG |
| North Lakes Business Park | CA11 0JG |
| Old Keld Head | CA11 0EG |
| Pallet Hill | CA11 0BY |
| Pennine View | CA11 0HR |
| Pooley Bridge | CA11 0LL |
| Princes Court | CA11 0EZ |
| Railway Cottages | CA11 0DE |
| Redhills Lane | CA11 0DT |
| Robson Court | CA11 0HW |
| Rose Cottages | CA11 0HJ |
| Rosebank | CA11 0ER |
| Slapestones | CA11 0FL |
| St Johns Court | CA11 0HE |
| St Johns Crescent | CA11 0EX |
| St Johns Road | CA11 0EY |
| Stony Cove Lane | CA11 0BT |
| Sunny Bank | CA11 0EU |
| The Nook | CA11 0EN |
| The Pavilion | CA11 0EA |
| Tymparon Close | CA11 0HY |
| CA11 0DA CA11 0DB CA11 0EB CA11 0EE CA11 0EP CA11 0EQ CA11 0ES CA11 0ET CA11 0EW CA11 0HH CA11 0HL CA11 0HQ CA11 0HS CA11 0HT CA11 0JF CA11 0UP CA11 0BP CA11 0DH CA11 0DQ CA11 0DU CA11 0EF CA11 0FN CA11 0GN CA11 0HA CA11 0HB CA11 0HG CA11 0HP CA11 0JA CA11 0JB CA11 0JE CA11 0LU CA11 0UH |
Transport near Dacre
- FAQ
- Price Paid By Year
- Property Type Price
Frequently asked questions about Dacre
What is the average price for a property for sale in Dacre?
The average price for a property for sale in Dacre is £384,131. This amount is 39% higher than the average price in Penrith. There are 736 property listings for sale in Dacre.
What streets have the most expensive properties for sale in Dacre?
The streets with the most expensive properties for sale in Dacre are Pooley Bridge at an average of £900,000, Apple Garth at an average of £480,000 and Rosebank at an average of £410,000.
What streets have the most affordable properties for sale in Dacre?
The streets with the most affordable properties for sale in Dacre are Tymparon Close at an average of £102,000, Chestnut Court at an average of £106,666 and Princes Court at an average of £175,000.
Which train stations are available in or near Dacre?
Some of the train stations available in or near Dacre are Penrith, Langwathby and Lazonby and Kirkoswald.
Property Price Paid in Dacre by Year
The average sold property price by year was:
| Year | Average Sold Price | Price Change |
Sold Properties
|
|---|---|---|---|
| 2025 | £419,605 | 11% |
19 Properties |
| 2024 | £375,413 | 4% |
23 Properties |
| 2023 | £359,210 | -6% |
19 Properties |
| 2022 | £379,718 | 20% |
16 Properties |
| 2021 | £304,902 | -14% |
36 Properties |
| 2020 | £348,823 | 25% |
17 Properties |
| 2019 | £262,136 | -2% |
11 Properties |
| 2018 | £268,087 | 4% |
24 Properties |
| 2017 | £257,506 | -3% |
25 Properties |
| 2016 | £265,913 | -7% |
23 Properties |
| 2015 | £285,731 | 16% |
16 Properties |
| 2014 | £240,551 | -25% |
27 Properties |
| 2013 | £300,416 | 29% |
18 Properties |
| 2012 | £214,568 | -14% |
22 Properties |
| 2011 | £244,305 | 2% |
18 Properties |
| 2010 | £239,588 | -1% |
17 Properties |
| 2009 | £241,076 | -6% |
19 Properties |
| 2008 | £254,367 | -15% |
15 Properties |
| 2007 | £293,290 | 21% |
30 Properties |
| 2006 | £231,931 | - |
24 Properties |
| 2005 | £232,000 | 1% |
19 Properties |
| 2004 | £229,188 | 19% |
30 Properties |
| 2003 | £184,822 | 2% |
24 Properties |
| 2002 | £180,233 | 10% |
34 Properties |
| 2001 | £162,931 | 32% |
30 Properties |
| 2000 | £110,122 | -1% |
33 Properties |
| 1999 | £111,441 | 7% |
41 Properties |
| 1998 | £103,794 | 14% |
36 Properties |
| 1997 | £89,468 | 2% |
42 Properties |
| 1996 | £87,781 | 17% |
24 Properties |
| 1995 | £73,214 | - |
18 Properties |
Property Price per Property Type in Dacre
Here you can find historic sold price data in order to help with your property search.
The average Property Paid Price for specific property types in the last three years are:
| Property Type | Average Sold Price | Sold Properties |
|---|---|---|
| Semi Detached House | £257,272.00 | 11 Semi Detached Houses |
| Detached House | £453,625.00 | 40 Detached Houses |
| Terraced House | £305,285.00 | 7 Terraced Houses |
| Flat | £106,666.00 | 3 Flats |

