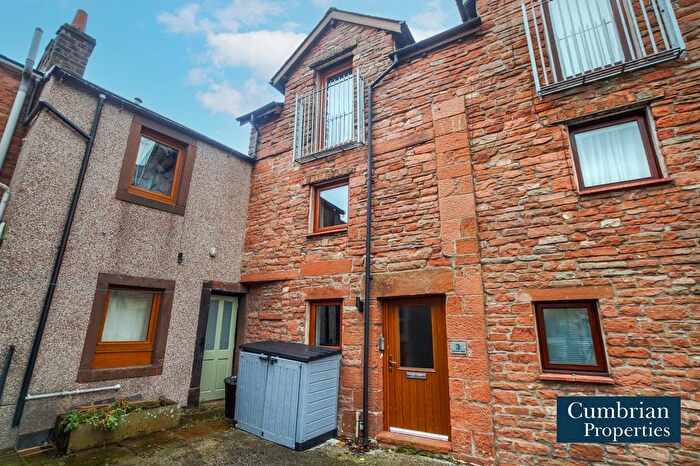
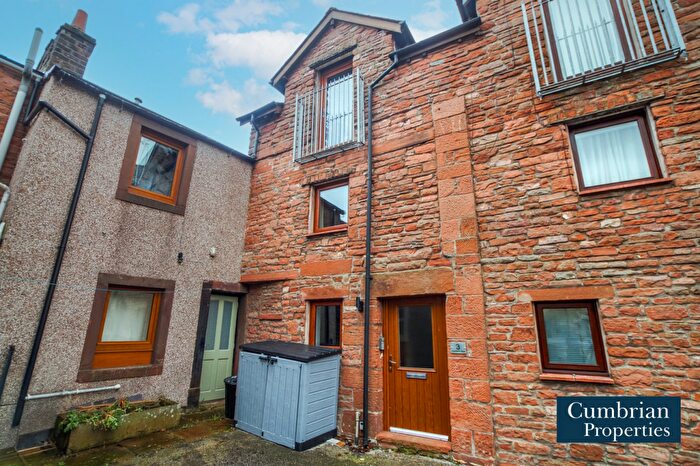
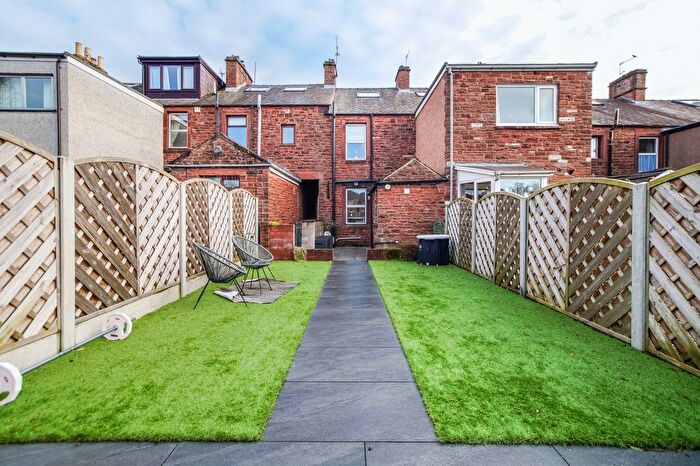
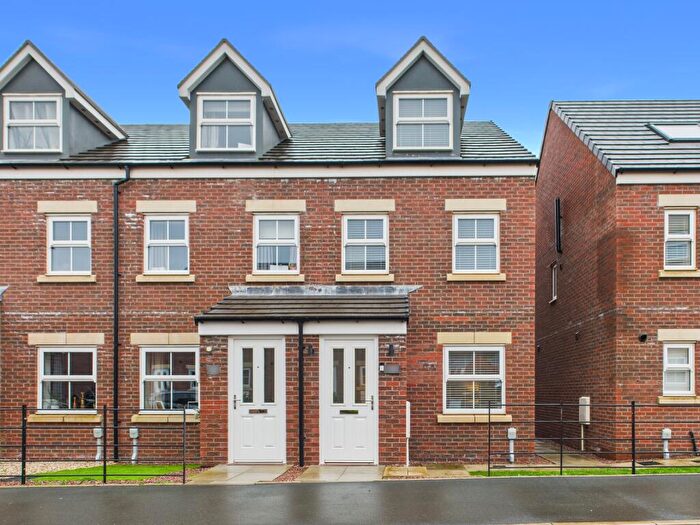
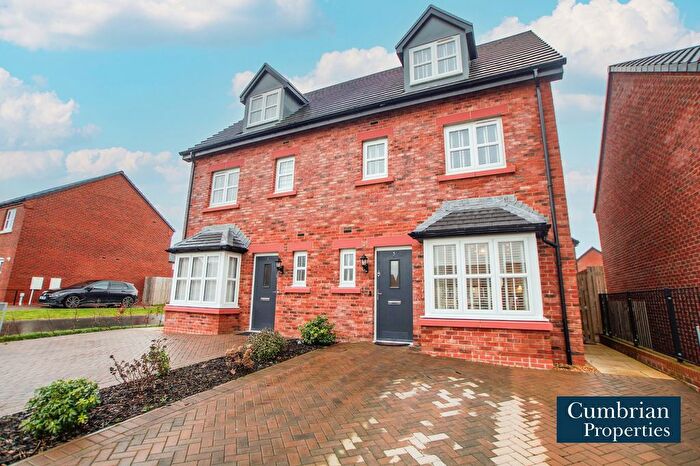
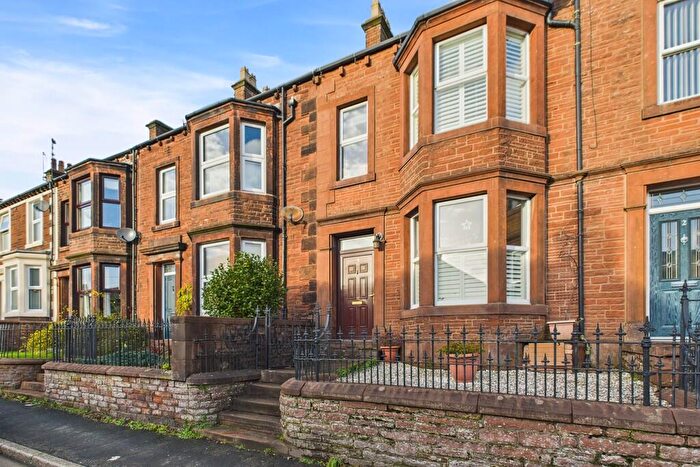
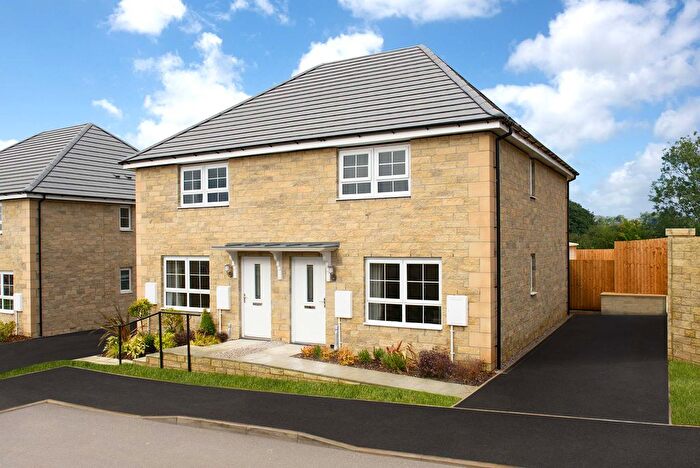
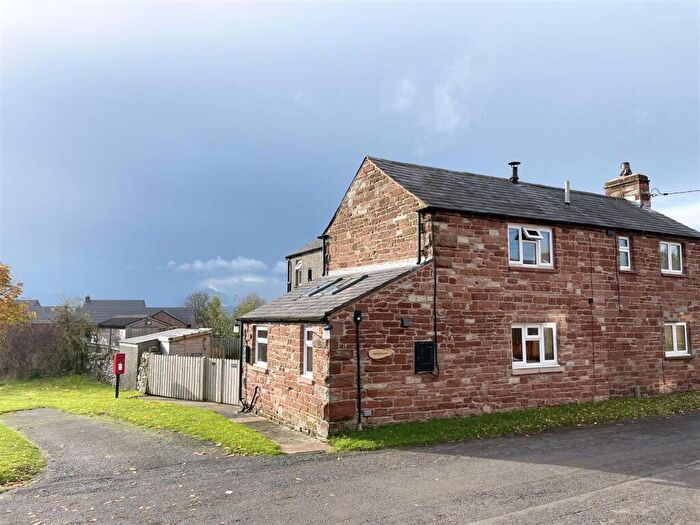
Houses for sale & to rent in Penrith, Cumbria
House Prices in Penrith
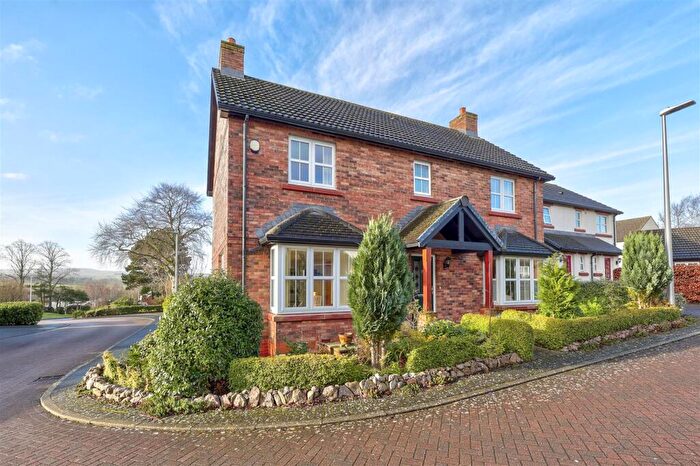
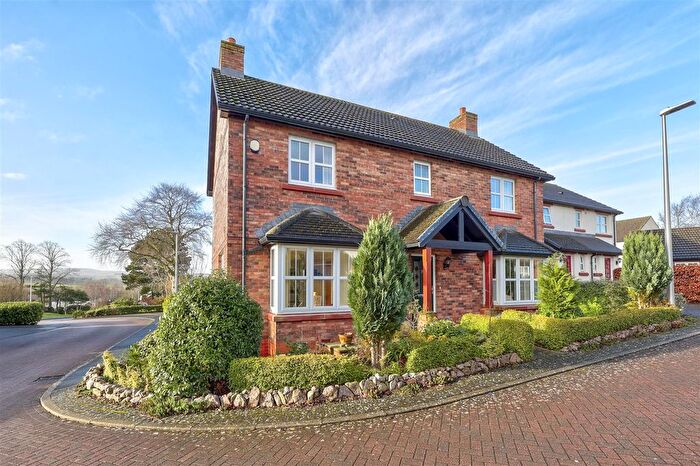
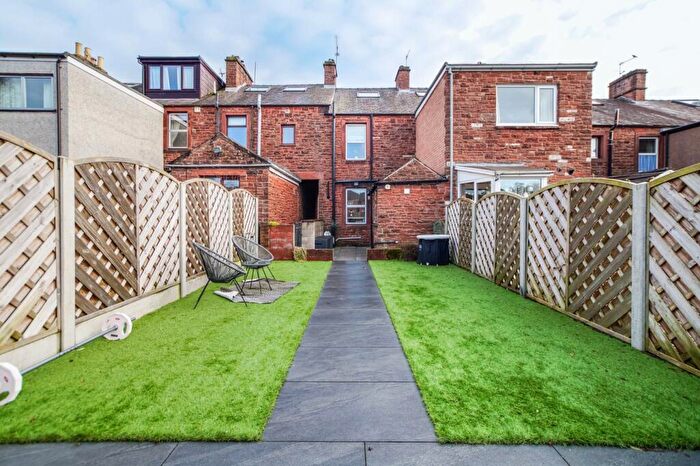
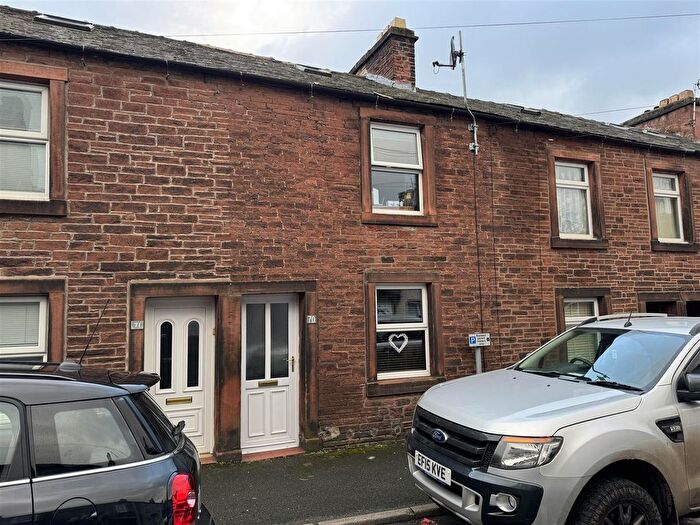
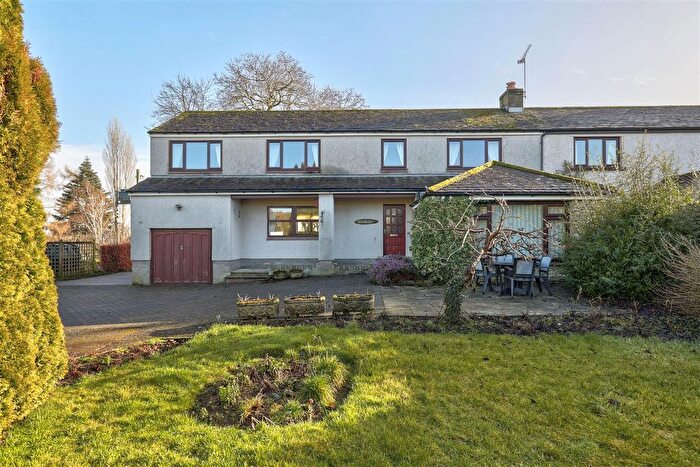
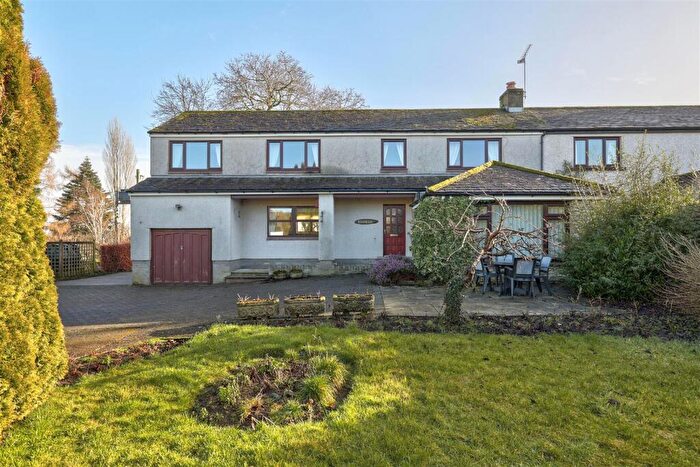
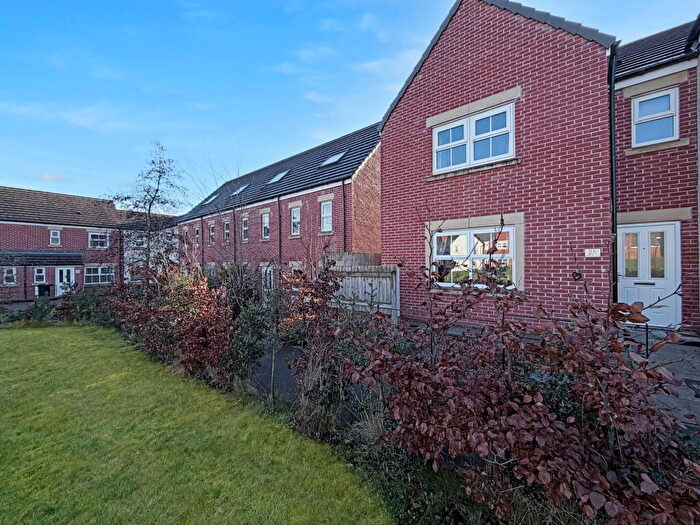
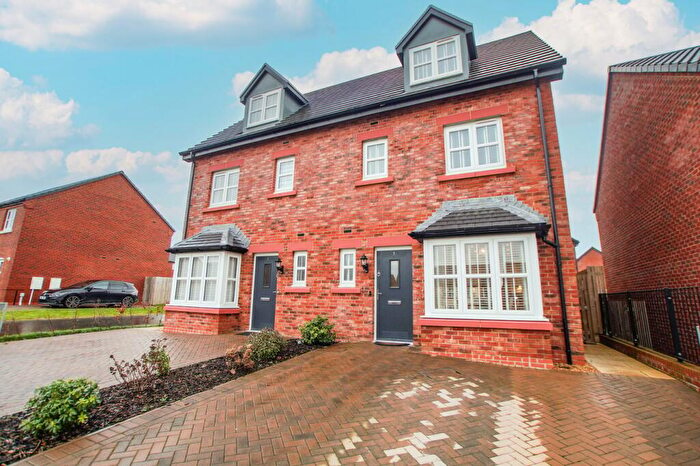
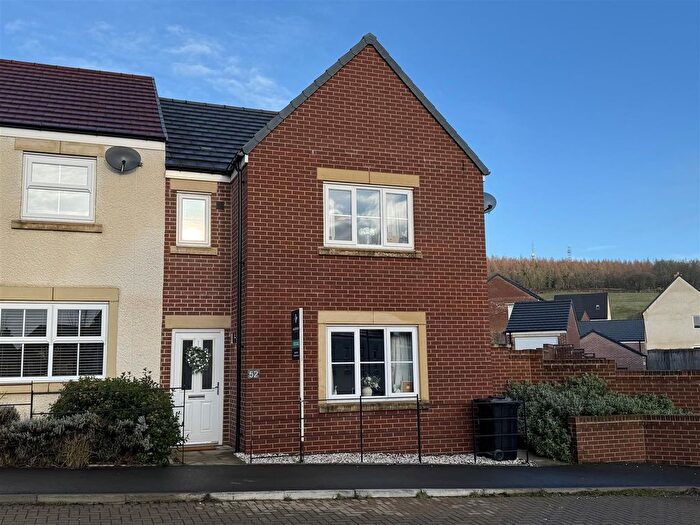
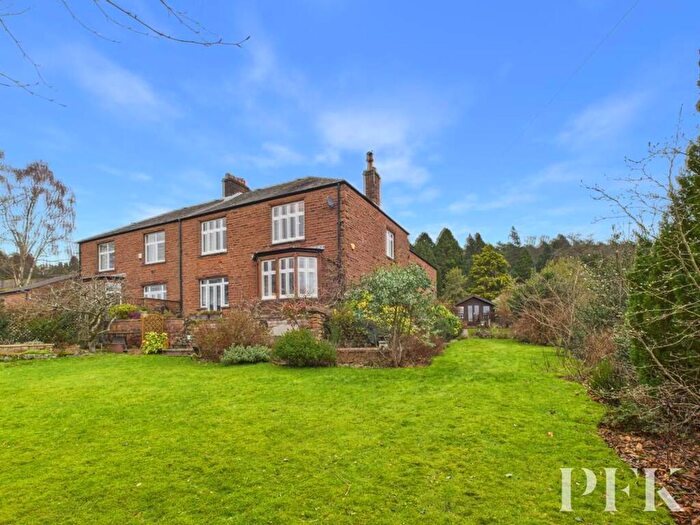
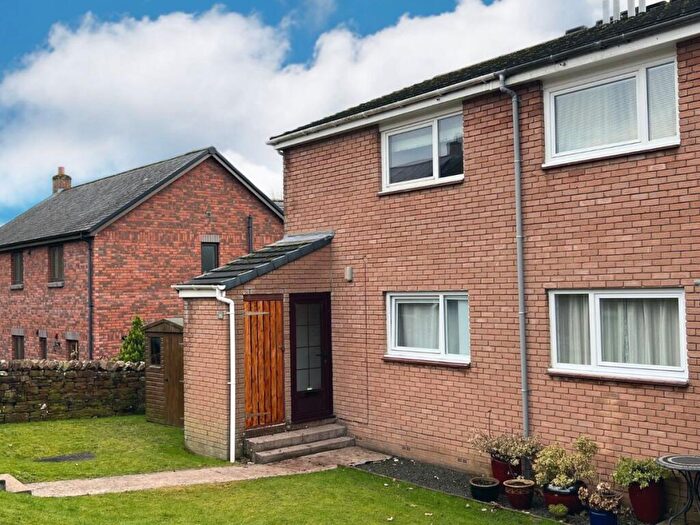
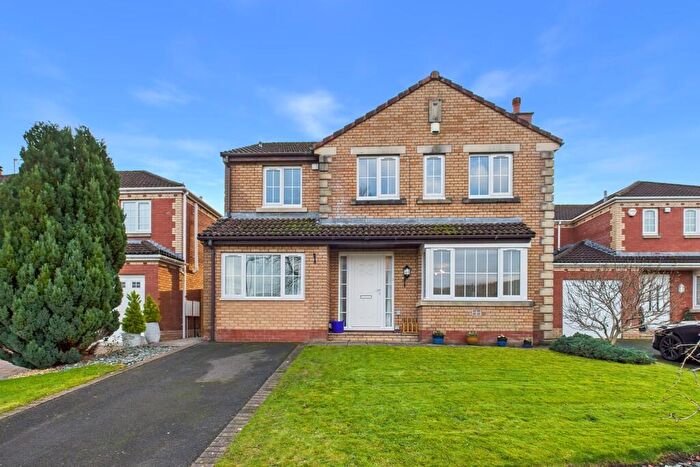
Properties in Penrith have an average house price of £277,215.00 and had 1,670 Property Transactions within the last 3 years.¹
Penrith is an area in Cumbria with 15,702 households², where the most expensive property was sold for £1,520,000.00.
Properties for sale in Penrith
Neighbourhoods in Penrith
Navigate through our locations to find the location of your next house in Penrith, Cumbria for sale or to rent.
- Askham
- Crosby Ravensworth
- Dacre
- Eamont
- Greystoke
- Hartside
- Hesket
- Kirkby Thore
- Kirkoswald
- Langwathby
- Lazonby
- Long Marton
- Morland
- Orton With Tebay
- Penrith Carleton
- Penrith East
- Penrith North
- Penrith Pategill
- Penrith South
- Penrith West
- Shap
- Skelton
- Ullswater
- Hesket And Lazonby
- Alston And Fellside
- Eden And Lyvennet Vale
- Eamont And Shap
- Kirkby Stephen And Tebay
- Greystoke And Ullswater
Transport in Penrith
Please see below transportation links in this area:
- FAQ
- Price Paid By Year
- Property Type Price
Frequently asked questions about Penrith
What is the average price for a property for sale in Penrith?
The average price for a property for sale in Penrith is £277,215. This amount is 24% higher than the average price in Cumbria. There are more than 10,000 property listings for sale in Penrith.
What locations have the most expensive properties for sale in Penrith?
The locations with the most expensive properties for sale in Penrith are Ullswater at an average of £499,154, Crosby Ravensworth at an average of £405,842 and Askham at an average of £400,339.
What locations have the most affordable properties for sale in Penrith?
The locations with the most affordable properties for sale in Penrith are Penrith Pategill at an average of £164,971, Penrith West at an average of £176,819 and Penrith South at an average of £198,208.
Which train stations are available in or near Penrith?
Some of the train stations available in or near Penrith are Penrith, Langwathby and Lazonby and Kirkoswald.
Property Price Paid in Penrith by Year
The average sold property price by year was:
| Year | Average Sold Price | Price Change |
Sold Properties
|
|---|---|---|---|
| 2025 | £274,507 | 1% |
495 Properties |
| 2024 | £272,755 | -4% |
554 Properties |
| 2023 | £283,352 | 4% |
621 Properties |
| 2022 | £271,463 | 6% |
723 Properties |
| 2021 | £255,859 | 6% |
813 Properties |
| 2020 | £241,468 | 3% |
665 Properties |
| 2019 | £233,696 | 0,4% |
734 Properties |
| 2018 | £232,764 | 4% |
780 Properties |
| 2017 | £222,599 | 8% |
678 Properties |
| 2016 | £204,908 | -2% |
612 Properties |
| 2015 | £209,096 | 1% |
653 Properties |
| 2014 | £206,916 | 4% |
547 Properties |
| 2013 | £197,875 | 5% |
489 Properties |
| 2012 | £188,222 | -9% |
386 Properties |
| 2011 | £205,213 | -4% |
408 Properties |
| 2010 | £213,002 | 4% |
430 Properties |
| 2009 | £204,370 | -9% |
402 Properties |
| 2008 | £223,369 | 6% |
417 Properties |
| 2007 | £209,692 | 0,4% |
757 Properties |
| 2006 | £208,761 | 7% |
676 Properties |
| 2005 | £194,509 | 7% |
638 Properties |
| 2004 | £180,832 | 22% |
729 Properties |
| 2003 | £141,364 | 18% |
762 Properties |
| 2002 | £116,362 | 18% |
775 Properties |
| 2001 | £95,054 | 9% |
826 Properties |
| 2000 | £86,870 | 9% |
821 Properties |
| 1999 | £78,980 | 4% |
773 Properties |
| 1998 | £76,152 | 13% |
684 Properties |
| 1997 | £66,282 | 1% |
764 Properties |
| 1996 | £65,392 | 3% |
648 Properties |
| 1995 | £63,552 | - |
544 Properties |
Property Price per Property Type in Penrith
Here you can find historic sold price data in order to help with your property search.
The average Property Paid Price for specific property types in the last three years are:
| Property Type | Average Sold Price | Sold Properties |
|---|---|---|
| Semi Detached House | £244,829.00 | 475 Semi Detached Houses |
| Terraced House | £198,867.00 | 434 Terraced Houses |
| Detached House | £408,744.00 | 569 Detached Houses |
| Flat | £144,641.00 | 192 Flats |

