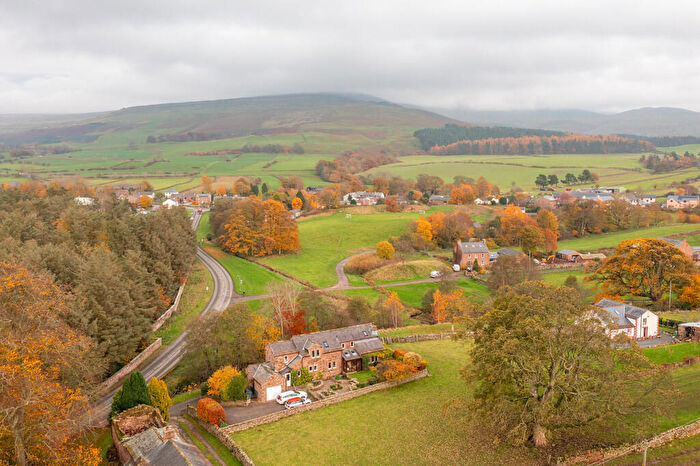
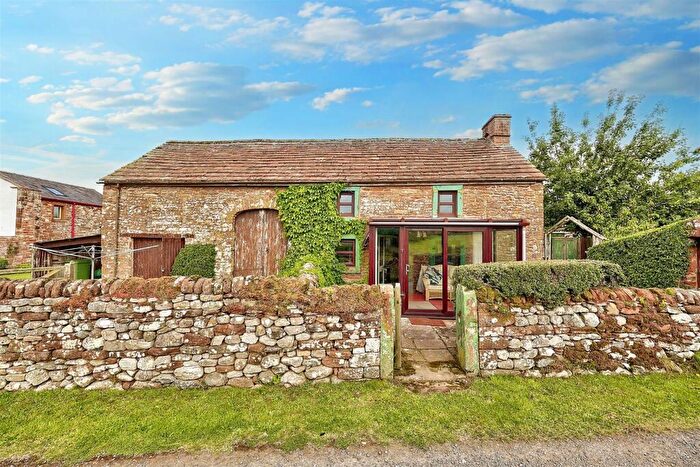
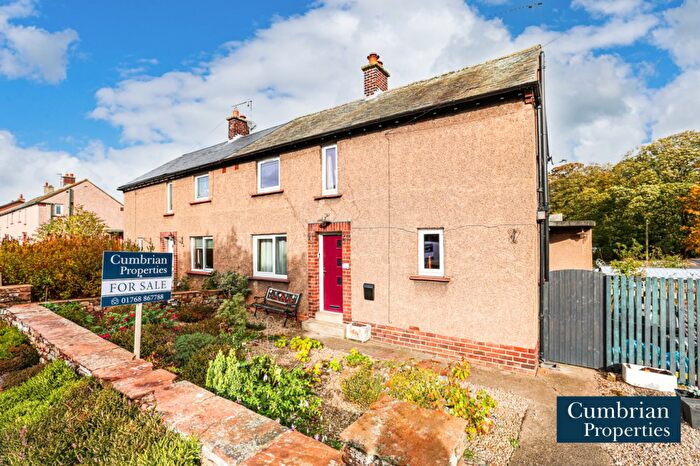
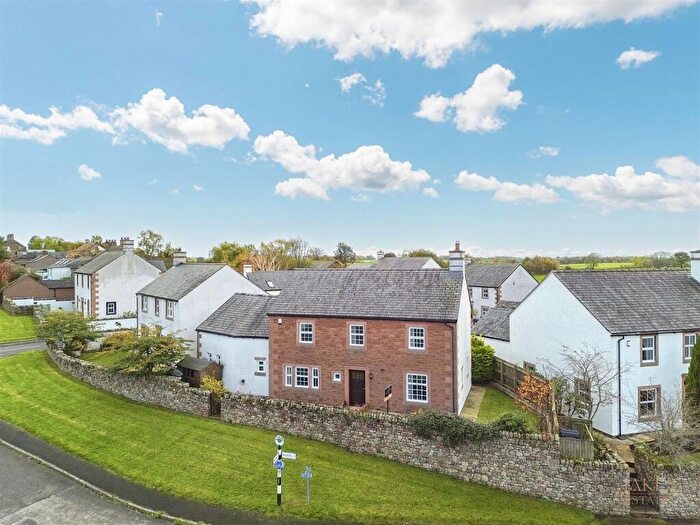
Houses for sale & to rent in Hartside, Penrith
House Prices in Hartside
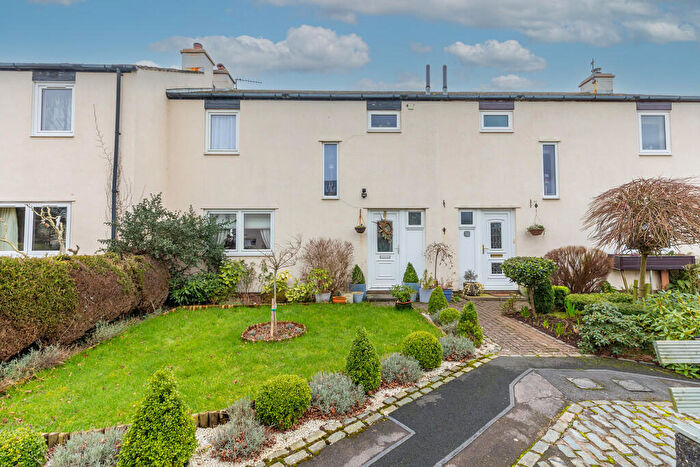
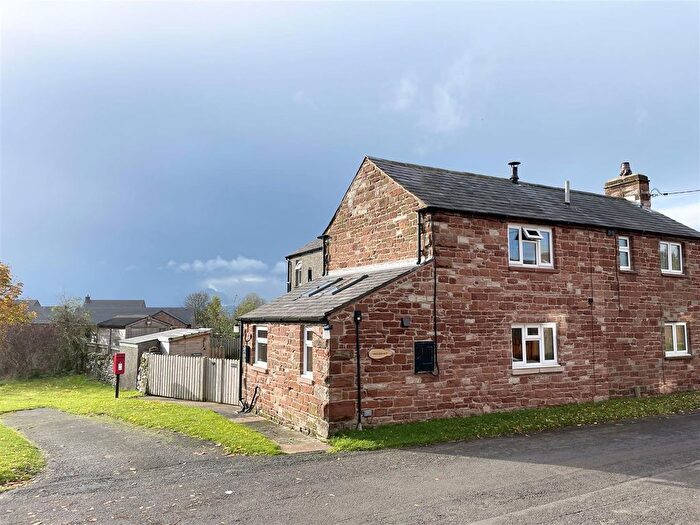
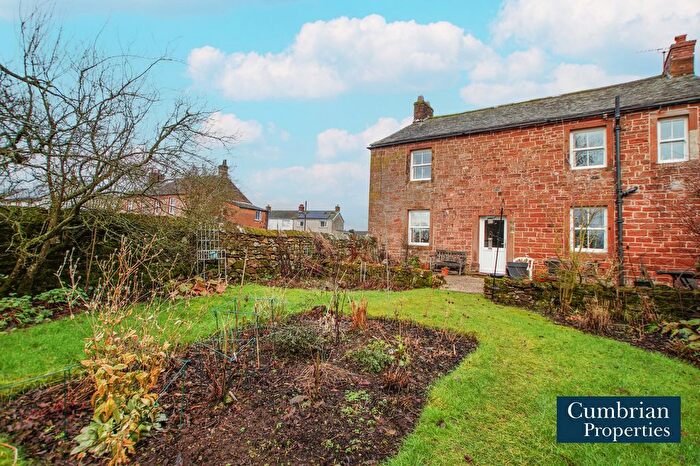
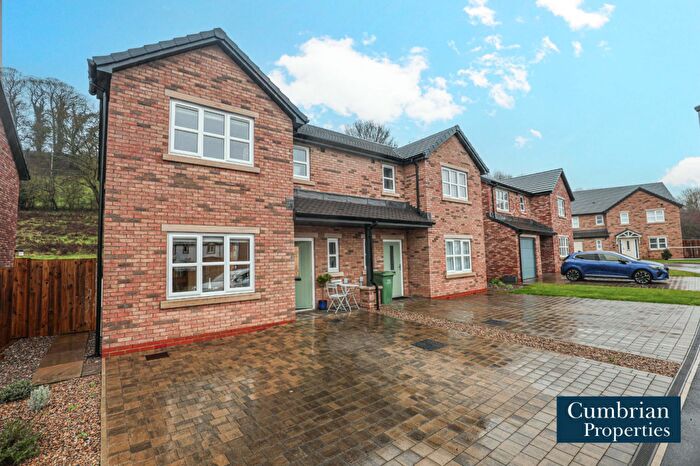
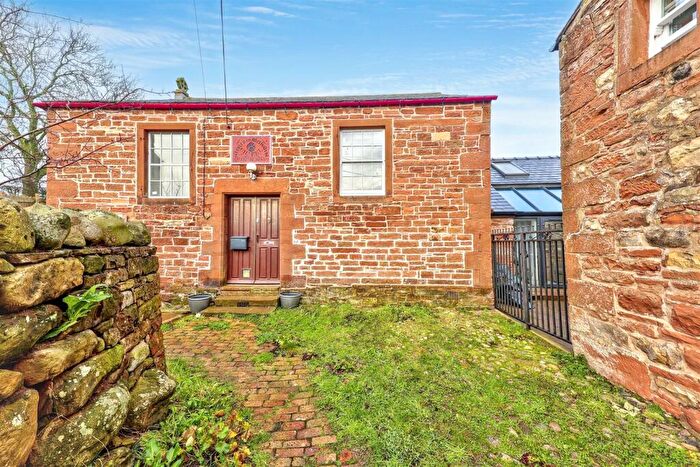
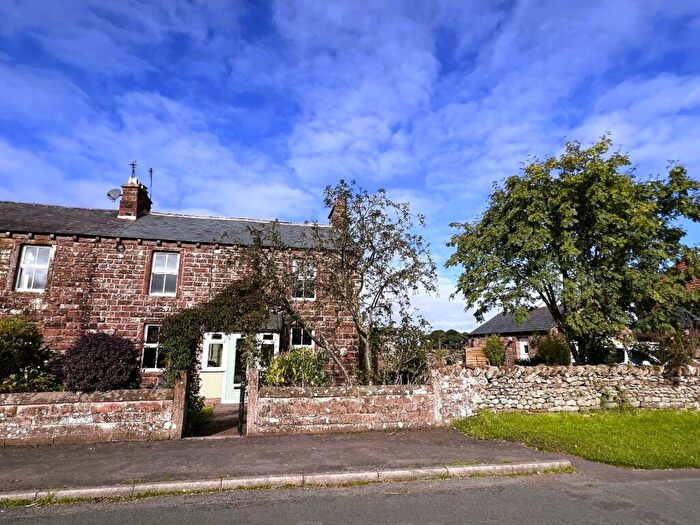
Properties in Hartside have an average house price of £348,505.00 and had 59 Property Transactions within the last 3 years¹.
Hartside is an area in Penrith, Cumbria with 531 households², where the most expensive property was sold for £750,000.00.
Properties for sale in Hartside
Roads and Postcodes in Hartside
Navigate through our locations to find the location of your next house in Hartside, Penrith for sale or to rent.
| Streets | Postcodes |
|---|---|
| Bridge Terrace | CA10 1HL |
| Chestnut Close | CA10 1QX |
| Church Road | CA10 1HD |
| Church Street | CA10 1RG |
| Crossfell View | CA10 1QJ |
| Currah Close | CA10 1AP |
| Elseghyll Court | CA10 1HJ |
| Green Houses | CA10 1QS |
| Hillcrest | CA10 1PZ |
| Kirkhill | CA10 1TZ |
| Kirkland | CA10 1RN |
| Kirkland Road | CA10 1RL |
| Loaning Head Courtyard | CA10 1QZ |
| Maiden Way Close | CA10 1DW |
| Meadow Close | CA10 1FA |
| Newbiggin | CA10 1TD |
| Newtown | CA10 1RJ |
| Otters Holt | CA10 1SG |
| Primrose Hill | CA10 1DN |
| Rectory Dell | CA10 1HH |
| South Esk | CA10 1QR |
| Station Road | CA10 1QG |
| Tarnside | CA10 1QH |
| The Brook | CA10 1SJ |
| Tortree Gardens | CA10 1DD |
| Townhead Court | CA10 1HG |
| Ullesby Gardens | CA10 1BP |
| Webster Place | CA10 1RF |
| Whinfell View | CA10 1QQ |
| Woodland Way | CA10 1SH |
| CA10 1HB CA10 1HE CA10 1HF CA10 1HN CA10 1PT CA10 1QA CA10 1QB CA10 1QE CA10 1QF CA10 1QL CA10 1QP CA10 1QT CA10 1QW CA10 1RH CA10 1RQ CA10 1SL CA10 1TX CA10 1HA CA10 1HP CA10 1HW CA10 1NZ CA10 1QD CA10 1QN CA10 1QU CA10 1RB CA10 1RE CA10 1TY |
Transport near Hartside
- FAQ
- Price Paid By Year
- Property Type Price
Frequently asked questions about Hartside
What is the average price for a property for sale in Hartside?
The average price for a property for sale in Hartside is £348,505. This amount is 26% higher than the average price in Penrith. There are 346 property listings for sale in Hartside.
What streets have the most expensive properties for sale in Hartside?
The streets with the most expensive properties for sale in Hartside are Kirkland Road at an average of £370,000, Otters Holt at an average of £360,833 and Elseghyll Court at an average of £346,000.
What streets have the most affordable properties for sale in Hartside?
The streets with the most affordable properties for sale in Hartside are Church Road at an average of £160,000, Whinfell View at an average of £240,000 and Woodland Way at an average of £335,000.
Which train stations are available in or near Hartside?
Some of the train stations available in or near Hartside are Langwathby, Lazonby and Kirkoswald and Penrith.
Property Price Paid in Hartside by Year
The average sold property price by year was:
| Year | Average Sold Price | Price Change |
Sold Properties
|
|---|---|---|---|
| 2025 | £273,411 | -43% |
13 Properties |
| 2024 | £390,333 | 7% |
12 Properties |
| 2023 | £362,455 | 9% |
34 Properties |
| 2022 | £330,240 | -2% |
41 Properties |
| 2021 | £336,862 | 10% |
20 Properties |
| 2020 | £301,834 | 5% |
23 Properties |
| 2019 | £287,858 | 7% |
23 Properties |
| 2018 | £267,249 | 4% |
34 Properties |
| 2017 | £257,319 | 6% |
18 Properties |
| 2016 | £242,916 | 3% |
18 Properties |
| 2015 | £236,307 | -1% |
14 Properties |
| 2014 | £238,239 | 17% |
23 Properties |
| 2013 | £197,735 | -28% |
17 Properties |
| 2012 | £252,441 | -2% |
13 Properties |
| 2011 | £258,491 | -15% |
12 Properties |
| 2010 | £298,350 | 12% |
10 Properties |
| 2009 | £262,657 | -7% |
19 Properties |
| 2008 | £281,702 | 11% |
22 Properties |
| 2007 | £251,091 | 10% |
30 Properties |
| 2006 | £227,158 | -5% |
12 Properties |
| 2005 | £238,913 | 16% |
23 Properties |
| 2004 | £200,275 | 12% |
25 Properties |
| 2003 | £177,025 | 20% |
29 Properties |
| 2002 | £141,789 | 22% |
17 Properties |
| 2001 | £110,205 | 14% |
17 Properties |
| 2000 | £94,633 | -3% |
21 Properties |
| 1999 | £97,702 | 25% |
21 Properties |
| 1998 | £73,200 | -29% |
11 Properties |
| 1997 | £94,783 | 0,1% |
15 Properties |
| 1996 | £94,715 | 39% |
13 Properties |
| 1995 | £57,346 | - |
13 Properties |
Property Price per Property Type in Hartside
Here you can find historic sold price data in order to help with your property search.
The average Property Paid Price for specific property types in the last three years are:
| Property Type | Average Sold Price | Sold Properties |
|---|---|---|
| Semi Detached House | £264,571.00 | 14 Semi Detached Houses |
| Detached House | £388,450.00 | 38 Detached Houses |
| Terraced House | £299,535.00 | 7 Terraced Houses |

