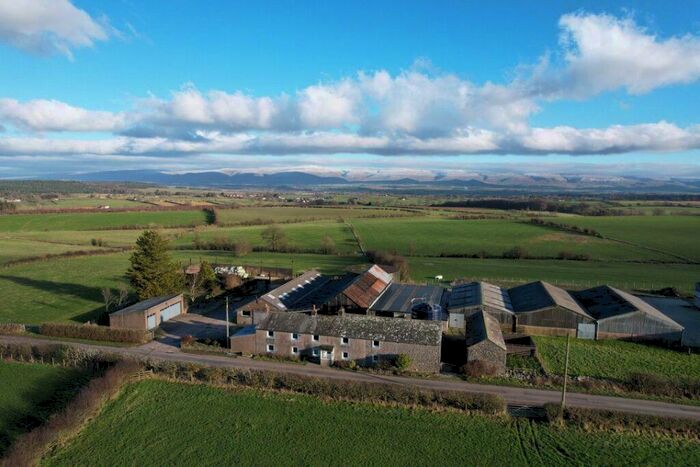
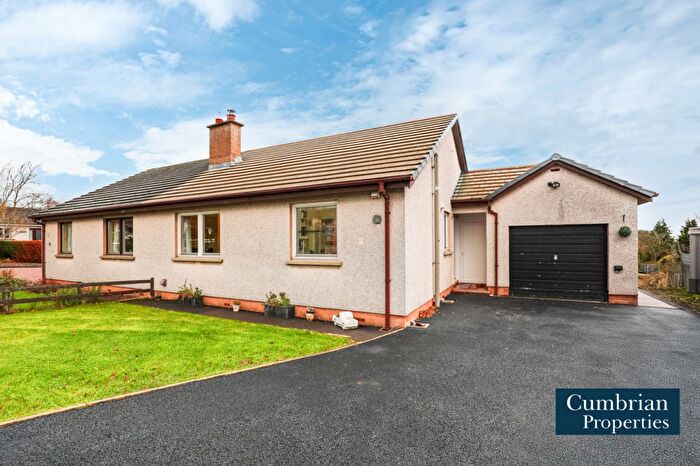
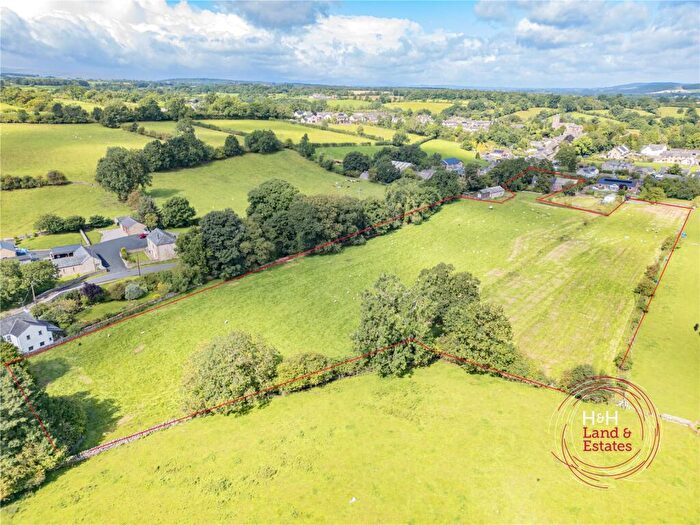
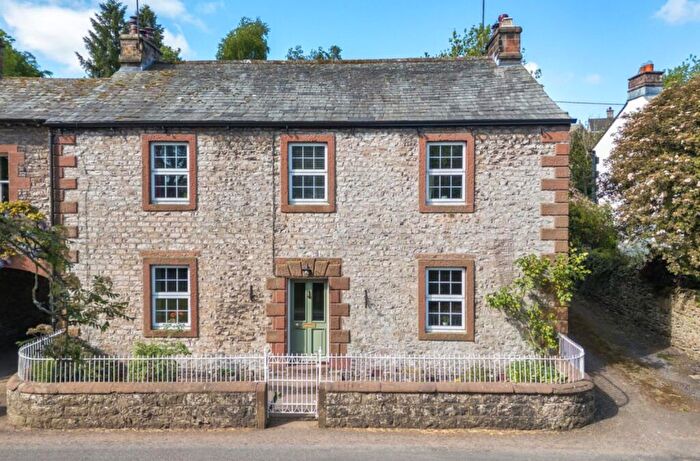
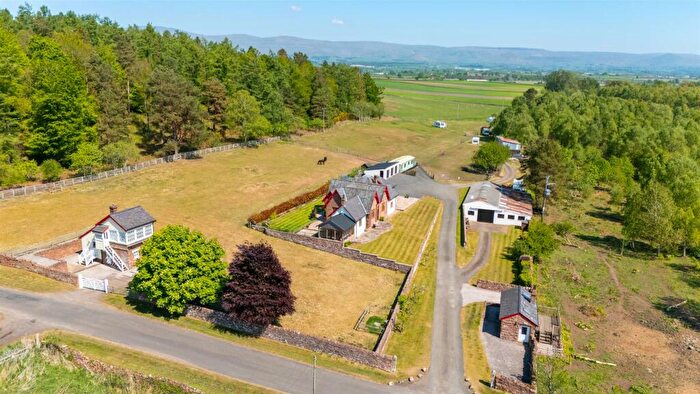
Houses for sale & to rent in Morland, Penrith
House Prices in Morland
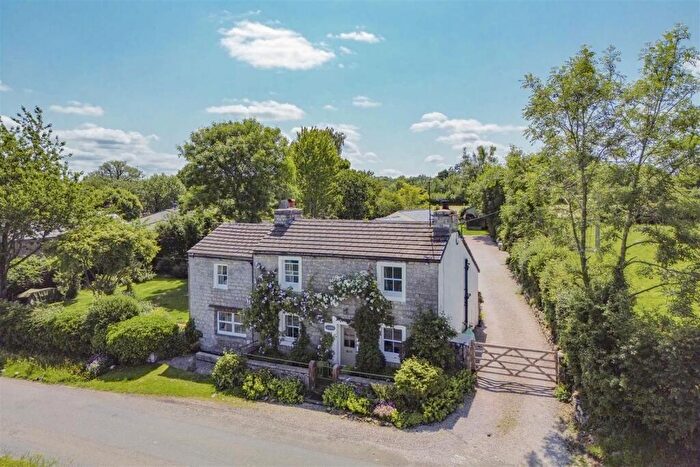
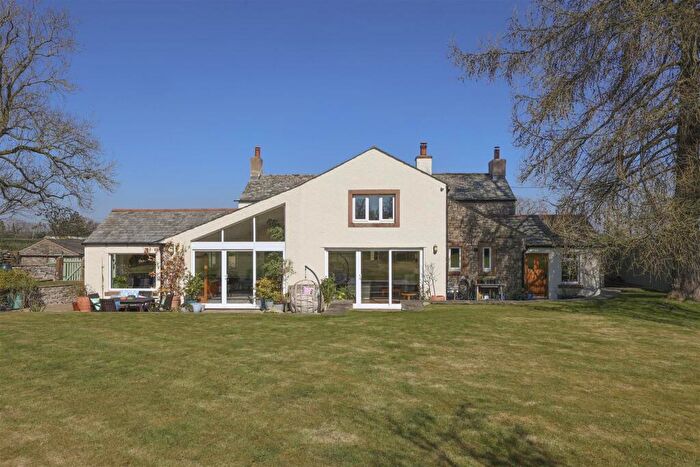
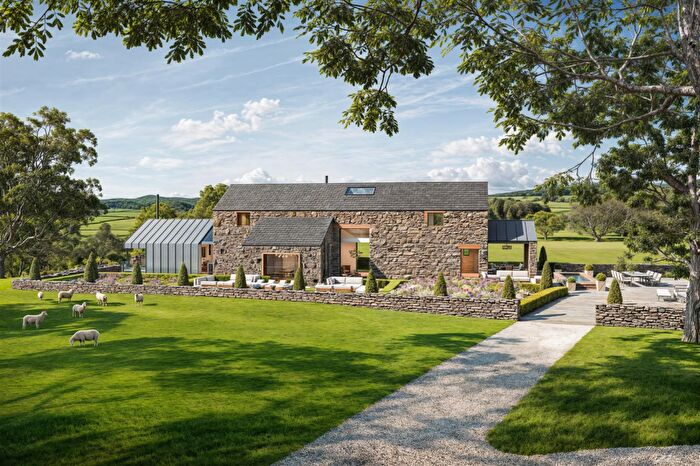
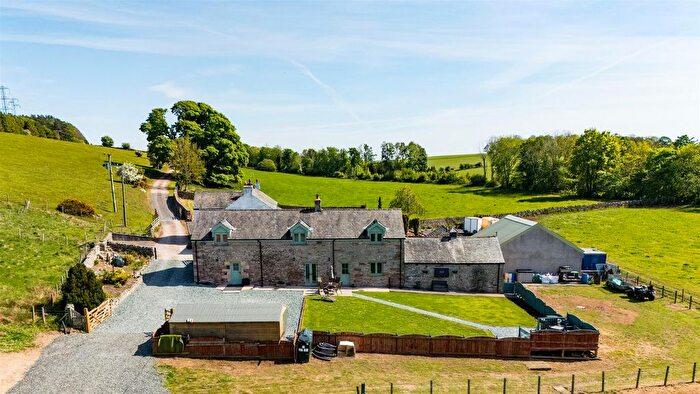
Properties in Morland have an average house price of £353,563.00 and had 47 Property Transactions within the last 3 years¹.
Morland is an area in Penrith, Cumbria with 534 households², where the most expensive property was sold for £680,000.00.
Properties for sale in Morland
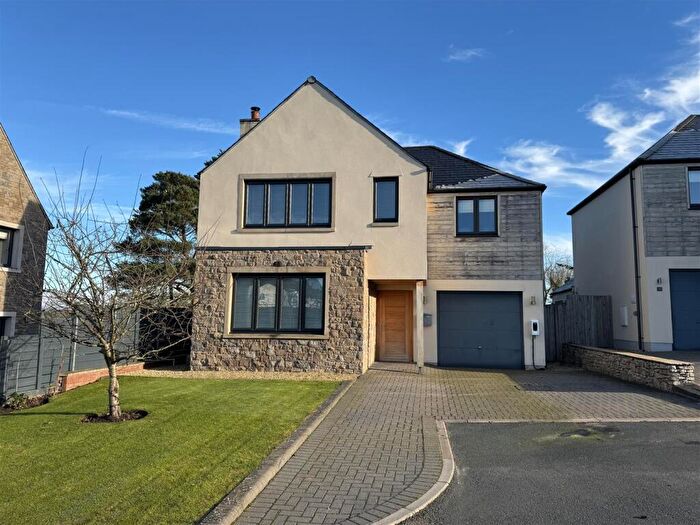
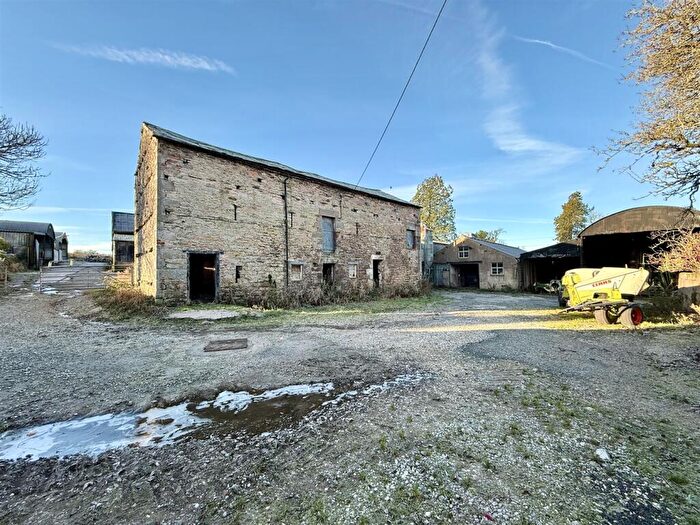
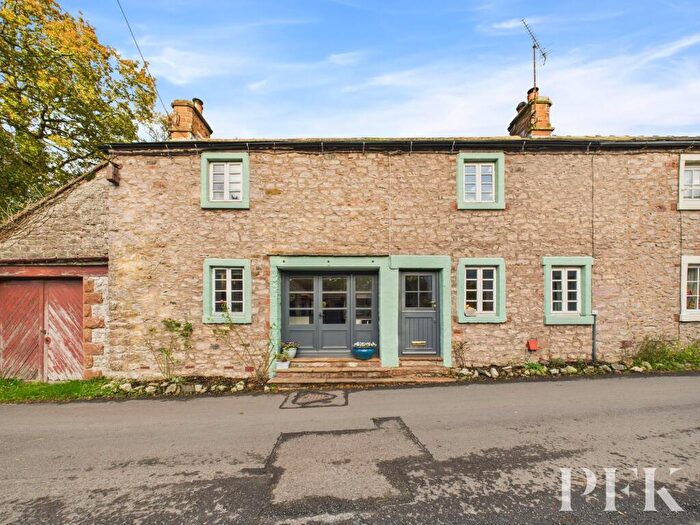
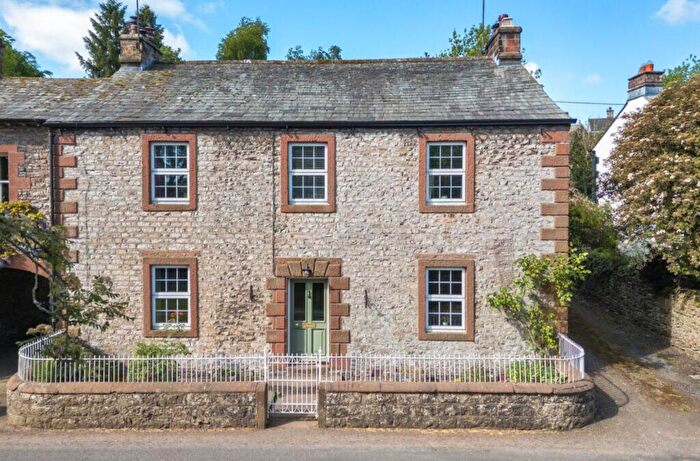
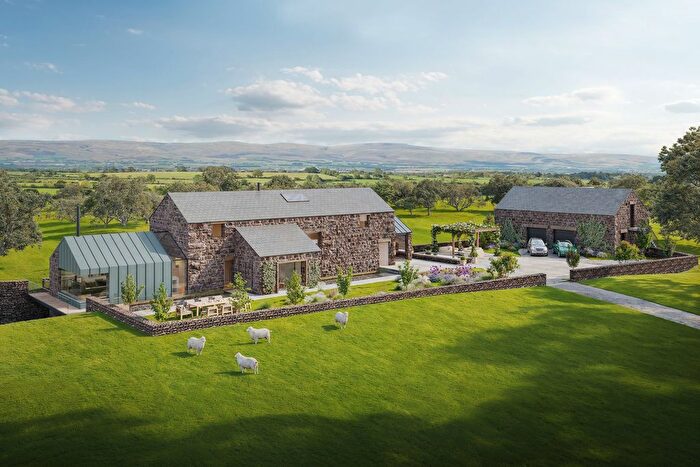
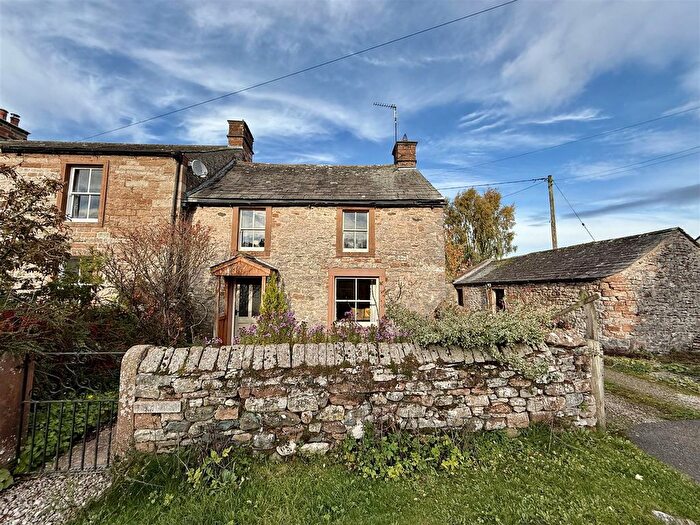
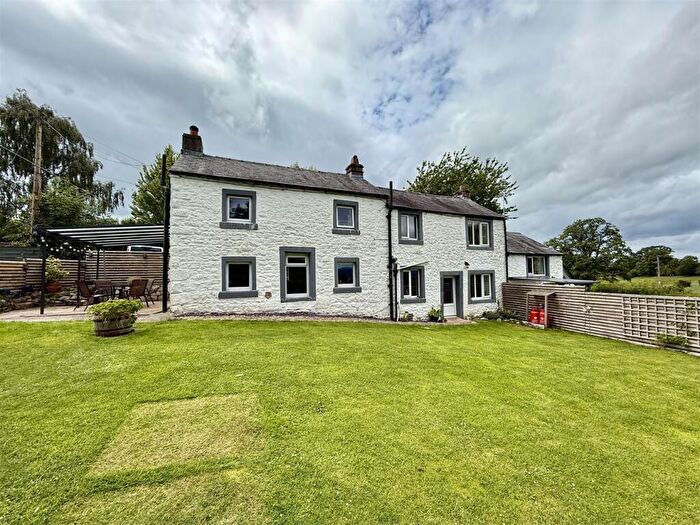
Previously listed properties in Morland
Roads and Postcodes in Morland
Navigate through our locations to find the location of your next house in Morland, Penrith for sale or to rent.
| Streets | Postcodes |
|---|---|
| Brookside | CA10 3BP |
| Chapel View | CA10 3DZ |
| Church Lane | CA10 3BD |
| Church View | CA10 3AB |
| Coach Croft | CA10 3BF |
| Cobblestone Corner | CA10 3BG |
| Cottage Row | CA10 3DR |
| Crown Inn Fields | CA10 3EB |
| Curwen Bank | CA10 3BW |
| Cuthbert Close | CA10 3AG |
| Damson Bank | CA10 3EH |
| Fallowfield | CA10 3AQ |
| Great Strickland | CA10 3DF CA10 3DH CA10 3DJ CA10 3DS CA10 3DU CA10 3DX |
| High Street | CA10 3AS |
| Inmoor Road | CA10 3DT |
| Jackson Croft | CA10 3AU |
| Leith Close | CA10 3AJ |
| Little Strickland | CA10 3EG |
| Mother Croft | CA10 3BE |
| Musgrave Terrace | CA10 3AA |
| Newby Head | CA10 3EU |
| Park Croft | CA10 3AF |
| Rectory Cottages | CA10 3AD |
| Station Road | CA10 3AE |
| The Croft | CA10 3DG |
| The Meadows | CA10 3AH |
| Townhead Close | CA10 3DL |
| Water Street | CA10 3AY |
| CA10 3AL CA10 3AT CA10 3AX CA10 3AZ CA10 3BA CA10 3BJ CA10 3DY CA10 3EA CA10 3EQ CA10 3EX CA10 3HB CA10 3HD CA10 3HQ CA10 2JA CA10 3BB CA10 3BH CA10 3ED CA10 3EF CA10 3EN CA10 3HG CA10 3QH |
Transport near Morland
- FAQ
- Price Paid By Year
- Property Type Price
Frequently asked questions about Morland
What is the average price for a property for sale in Morland?
The average price for a property for sale in Morland is £353,563. This amount is 28% higher than the average price in Penrith. There are 166 property listings for sale in Morland.
What streets have the most expensive properties for sale in Morland?
The streets with the most expensive properties for sale in Morland are Brookside at an average of £433,333, Little Strickland at an average of £383,666 and Great Strickland at an average of £374,100.
What streets have the most affordable properties for sale in Morland?
The streets with the most affordable properties for sale in Morland are Cobblestone Corner at an average of £84,000, Musgrave Terrace at an average of £120,000 and Mother Croft at an average of £150,000.
Which train stations are available in or near Morland?
Some of the train stations available in or near Morland are Penrith, Appleby and Langwathby.
Property Price Paid in Morland by Year
The average sold property price by year was:
| Year | Average Sold Price | Price Change |
Sold Properties
|
|---|---|---|---|
| 2025 | £329,571 | 2% |
14 Properties |
| 2024 | £323,175 | -32% |
20 Properties |
| 2023 | £426,153 | -3% |
13 Properties |
| 2022 | £438,291 | 25% |
24 Properties |
| 2021 | £330,357 | 19% |
28 Properties |
| 2020 | £268,739 | -0,1% |
25 Properties |
| 2019 | £268,892 | -4% |
14 Properties |
| 2018 | £279,352 | 12% |
17 Properties |
| 2017 | £245,784 | -10% |
16 Properties |
| 2016 | £271,090 | 26% |
11 Properties |
| 2015 | £201,875 | -13% |
16 Properties |
| 2014 | £228,710 | -4% |
14 Properties |
| 2013 | £237,033 | -23% |
15 Properties |
| 2012 | £290,636 | 12% |
11 Properties |
| 2011 | £255,916 | -21% |
6 Properties |
| 2010 | £309,675 | 7% |
14 Properties |
| 2009 | £288,722 | -13% |
9 Properties |
| 2008 | £325,389 | 23% |
14 Properties |
| 2007 | £251,798 | 4% |
31 Properties |
| 2006 | £242,394 | 2% |
19 Properties |
| 2005 | £238,234 | 3% |
22 Properties |
| 2004 | £230,404 | 14% |
21 Properties |
| 2003 | £198,881 | 19% |
24 Properties |
| 2002 | £161,250 | 24% |
20 Properties |
| 2001 | £123,306 | 14% |
30 Properties |
| 2000 | £106,197 | 4% |
18 Properties |
| 1999 | £102,272 | 15% |
31 Properties |
| 1998 | £87,292 | 9% |
25 Properties |
| 1997 | £79,303 | 24% |
25 Properties |
| 1996 | £60,158 | -37% |
15 Properties |
| 1995 | £82,143 | - |
13 Properties |
Property Price per Property Type in Morland
Here you can find historic sold price data in order to help with your property search.
The average Property Paid Price for specific property types in the last three years are:
| Property Type | Average Sold Price | Sold Properties |
|---|---|---|
| Semi Detached House | £303,363.00 | 11 Semi Detached Houses |
| Detached House | £421,653.00 | 26 Detached Houses |
| Terraced House | £244,166.00 | 9 Terraced Houses |
| Flat | £120,000.00 | 1 Flat |

