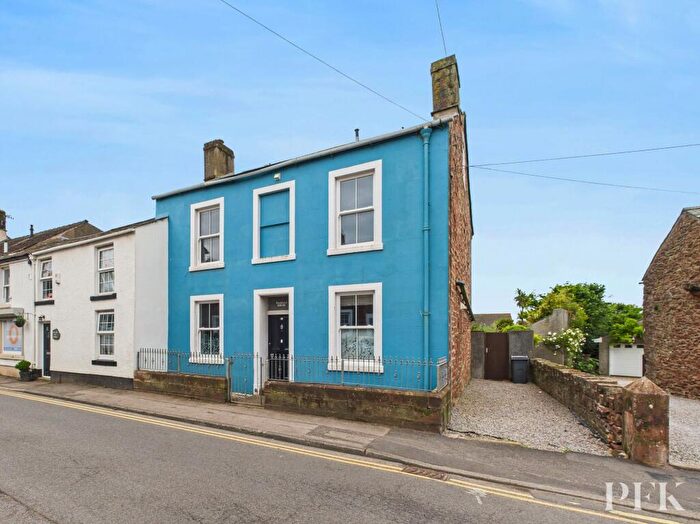
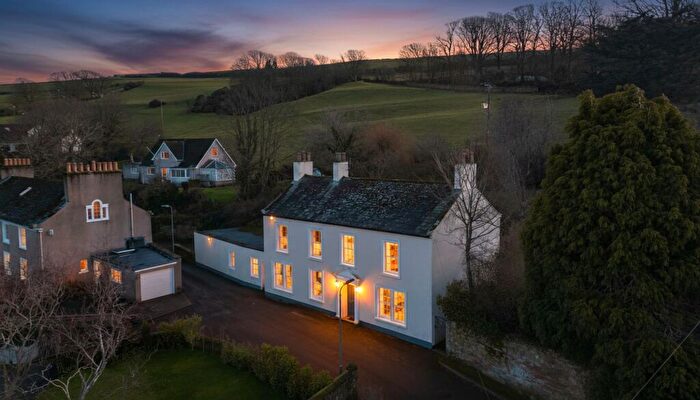
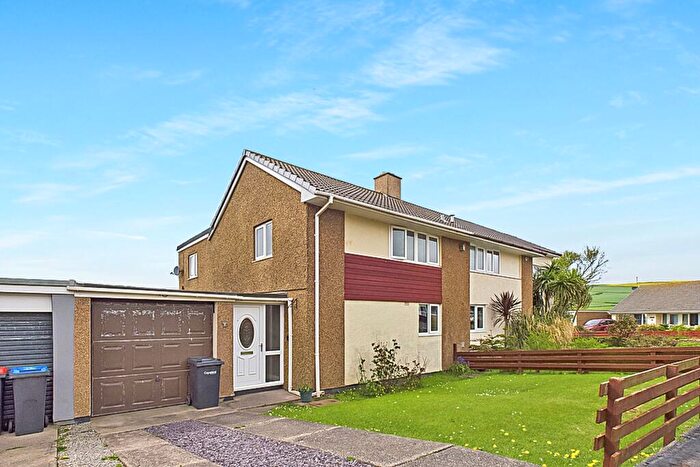
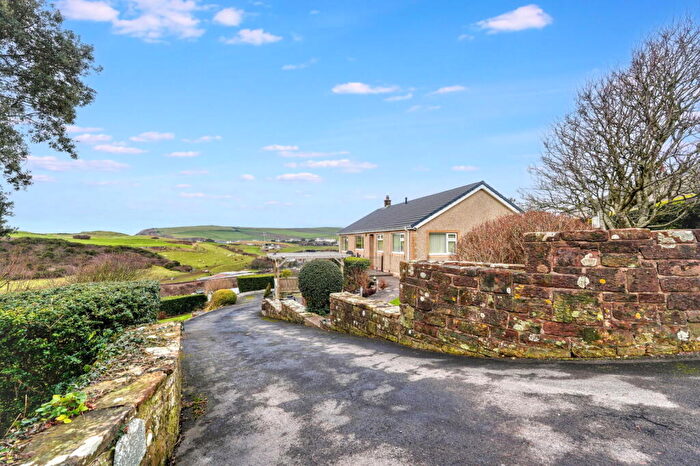
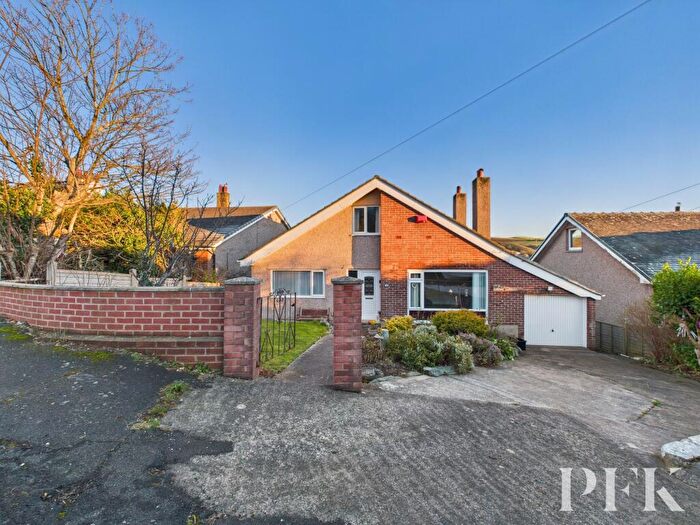
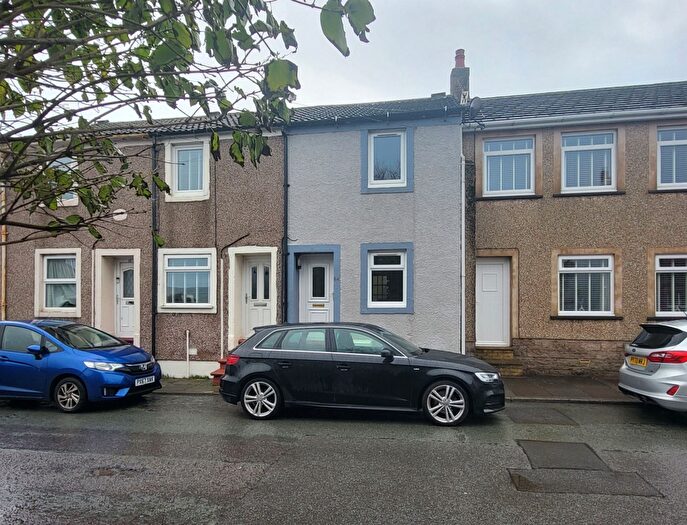
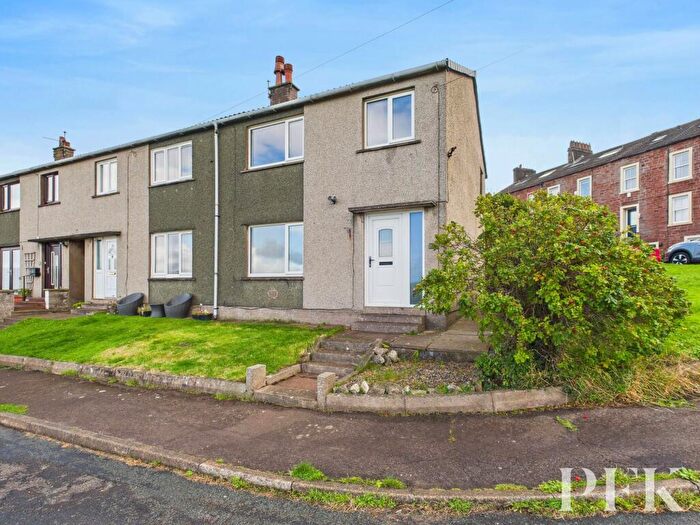
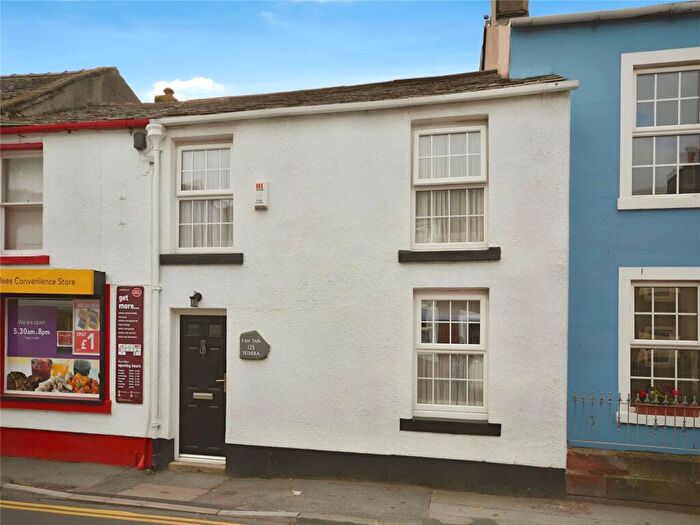
Houses for sale & to rent in St Bees, St Bees
House Prices in St Bees
Properties in St Bees have an average house price of £252,792.00 and had 87 Property Transactions within the last 3 years¹.
St Bees is an area in St Bees, Cumbria with 679 households², where the most expensive property was sold for £705,000.00.
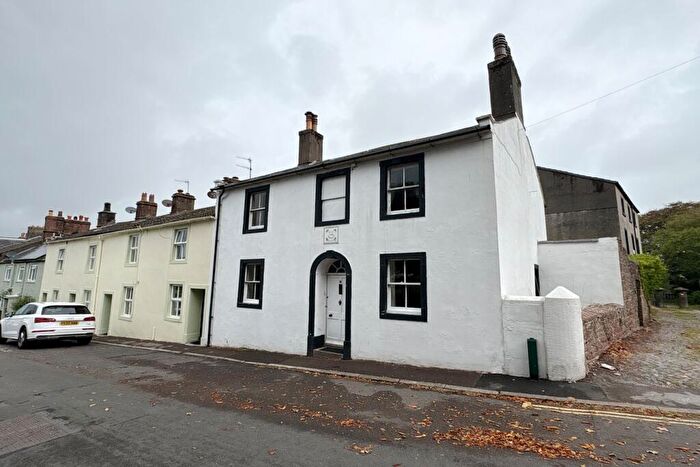
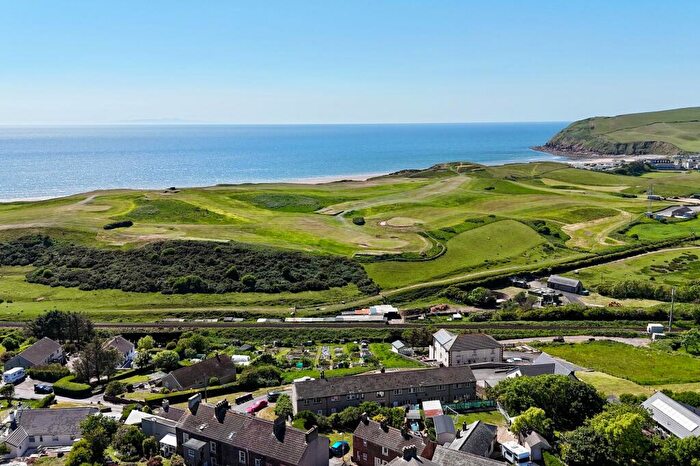
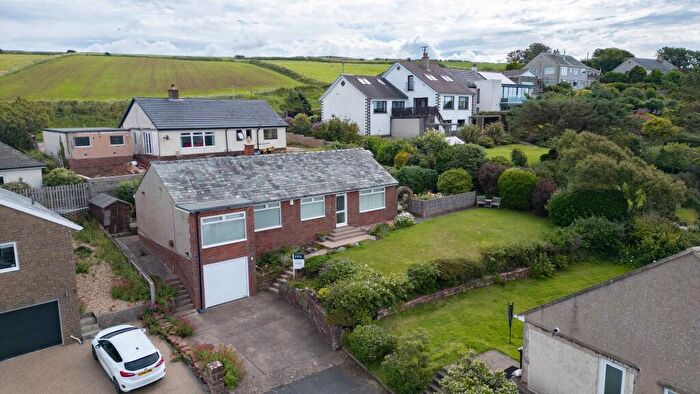
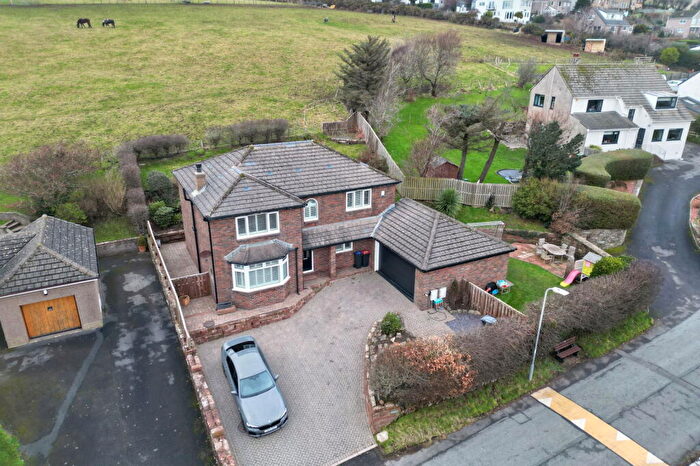
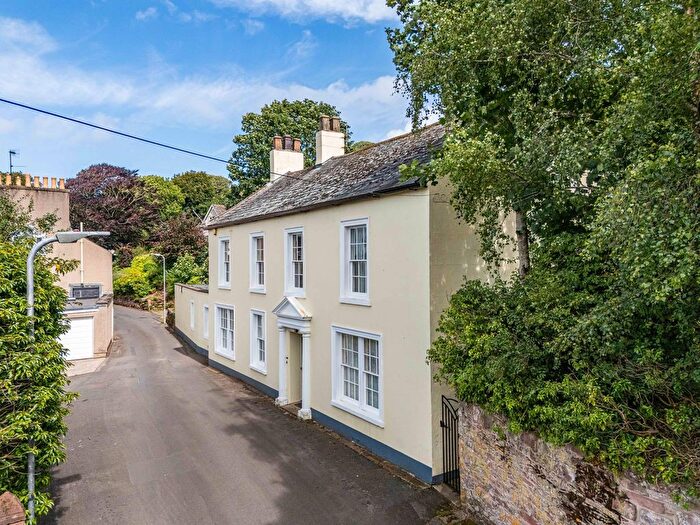
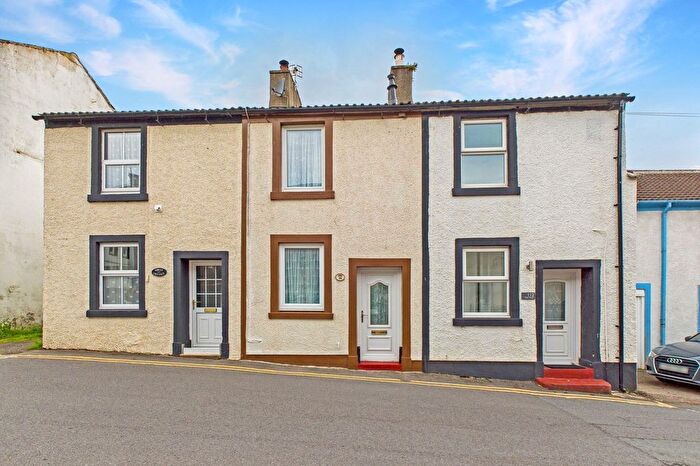
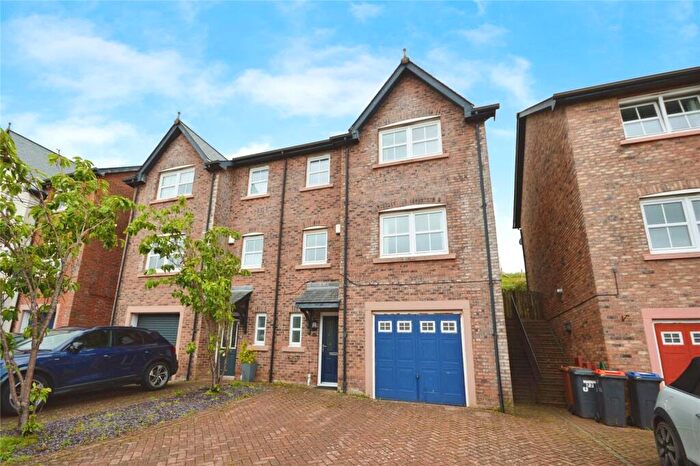
Properties for sale in St Bees
Previously listed properties in St Bees
Roads and Postcodes in St Bees
Navigate through our locations to find the location of your next house in St Bees, St Bees for sale or to rent.
| Streets | Postcodes |
|---|---|
| Abbey Road | CA27 0DY CA27 0ED CA27 0EG CA27 0EA |
| Abbey Vale | CA27 0EF |
| Abbotts Way | CA27 0HD |
| Bay View | CA27 0EU |
| Beach Road | CA27 0EN CA27 0EW CA27 0ES |
| Blythe Place | CA27 0BE |
| Cross Hill | CA27 0BL |
| Dawson Place | CA27 0AE |
| Egremont Road | CA27 0AS |
| Fairladies | CA27 0AQ CA27 0AR |
| Finkle Street | CA27 0BN |
| Firth Drive | CA27 0EY |
| Fleatham Gardens | CA27 0BX |
| Grindal Place | CA27 0BS |
| High House Road | CA27 0BY CA27 0BZ |
| Hillside | CA27 0AP |
| Lonsdale Terrace | CA27 0BW |
| Main Street | CA27 0AA CA27 0AD CA27 0AL CA27 0DE CA27 0AB CA27 0DG |
| Monks Hill | CA27 0EQ |
| Nethertown Road | CA27 0AY |
| Outrigg | CA27 0AN |
| Outrigg Close | CA27 0AH |
| Peck Mill | CA27 0EJ |
| Priory Road | CA27 0HB |
| Richmond Crescent | CA27 0EP |
| Rowan Terrace | CA27 0DH |
| Scalebarrow Road | CA27 0EE |
| Sea Mill Lane | CA27 0BG |
| Sea View | CA27 0BB |
| Seacote Gardens | CA27 0AT |
| Seacroft Drive | CA27 0AF |
| Seamill Lane | CA27 0BD |
| Solway Rise | CA27 0EZ |
| Station Road | CA27 0DN |
| The Crofts | CA27 0BH |
| Vale View | CA27 0BP |
| Victoria Terrace | CA27 0EL |
| CA27 0BJ CA27 0HA CA27 0DR CA27 0DS CA27 0DU CA27 0ET |
Transport near St Bees
- FAQ
- Price Paid By Year
- Property Type Price
Frequently asked questions about St Bees
What is the average price for a property for sale in St Bees?
The average price for a property for sale in St Bees is £252,792. There are 160 property listings for sale in St Bees.
What streets have the most expensive properties for sale in St Bees?
The streets with the most expensive properties for sale in St Bees are Fleatham Gardens at an average of £705,000, Egremont Road at an average of £500,000 and Vale View at an average of £405,000.
What streets have the most affordable properties for sale in St Bees?
The streets with the most affordable properties for sale in St Bees are Rowan Terrace at an average of £167,500, Cross Hill at an average of £171,250 and Finkle Street at an average of £182,500.
Which train stations are available in or near St Bees?
Some of the train stations available in or near St Bees are St.Bees, Nethertown and Corkickle.
Property Price Paid in St Bees by Year
The average sold property price by year was:
| Year | Average Sold Price | Price Change |
Sold Properties
|
|---|---|---|---|
| 2025 | £239,653 | -14% |
30 Properties |
| 2024 | £274,340 | 12% |
32 Properties |
| 2023 | £240,977 | -10% |
25 Properties |
| 2022 | £264,370 | 18% |
31 Properties |
| 2021 | £217,733 | 3% |
48 Properties |
| 2020 | £211,771 | -2% |
30 Properties |
| 2019 | £216,422 | 6% |
27 Properties |
| 2018 | £203,850 | -2% |
33 Properties |
| 2017 | £207,235 | -7% |
34 Properties |
| 2016 | £221,900 | -1% |
25 Properties |
| 2015 | £225,032 | 9% |
41 Properties |
| 2014 | £204,043 | 5% |
43 Properties |
| 2013 | £193,420 | 12% |
32 Properties |
| 2012 | £169,650 | -14% |
20 Properties |
| 2011 | £193,962 | 24% |
24 Properties |
| 2010 | £147,781 | -18% |
24 Properties |
| 2009 | £173,668 | -12% |
29 Properties |
| 2008 | £194,900 | -2% |
25 Properties |
| 2007 | £198,769 | 10% |
76 Properties |
| 2006 | £178,264 | -11% |
61 Properties |
| 2005 | £197,737 | 14% |
47 Properties |
| 2004 | £170,613 | 28% |
65 Properties |
| 2003 | £122,631 | 27% |
40 Properties |
| 2002 | £89,408 | 9% |
40 Properties |
| 2001 | £81,372 | 13% |
27 Properties |
| 2000 | £70,730 | 2% |
30 Properties |
| 1999 | £69,457 | 6% |
26 Properties |
| 1998 | £64,972 | 23% |
30 Properties |
| 1997 | £50,084 | -24% |
33 Properties |
| 1996 | £62,137 | 4% |
32 Properties |
| 1995 | £59,417 | - |
27 Properties |
Property Price per Property Type in St Bees
Here you can find historic sold price data in order to help with your property search.
The average Property Paid Price for specific property types in the last three years are:
| Property Type | Average Sold Price | Sold Properties |
|---|---|---|
| Semi Detached House | £229,470.00 | 19 Semi Detached Houses |
| Detached House | £342,501.00 | 33 Detached Houses |
| Terraced House | £188,403.00 | 26 Terraced Houses |
| Flat | £159,105.00 | 9 Flats |

