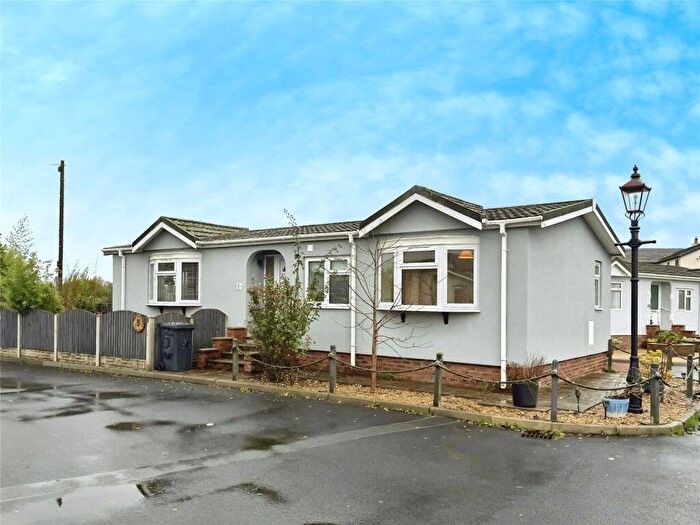
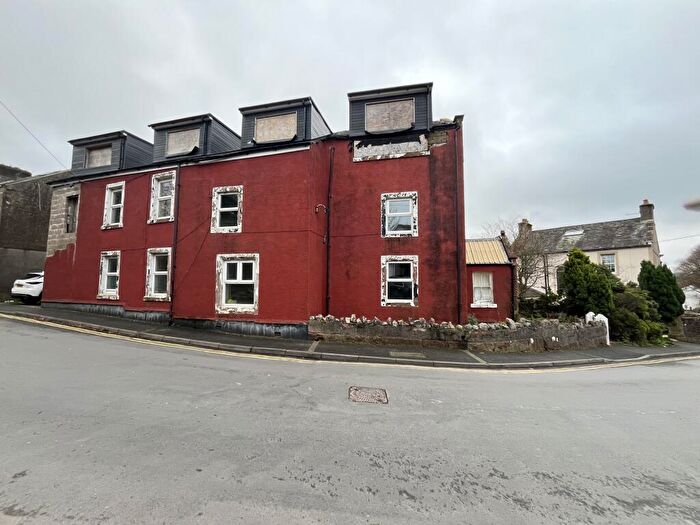
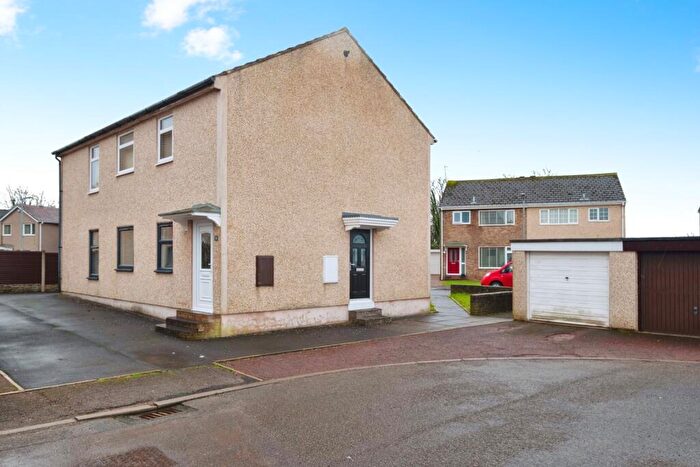
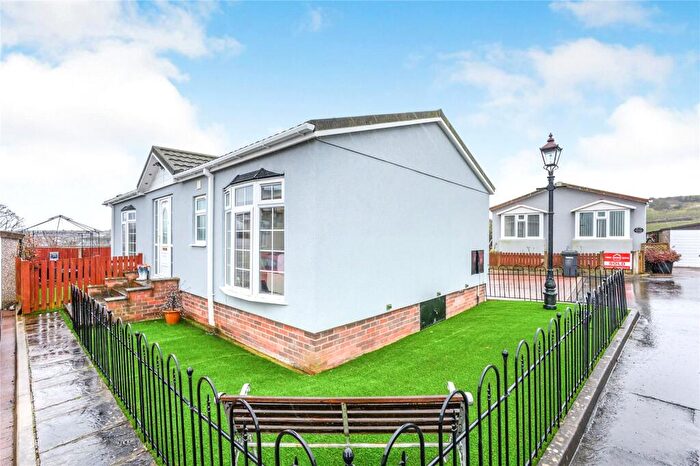
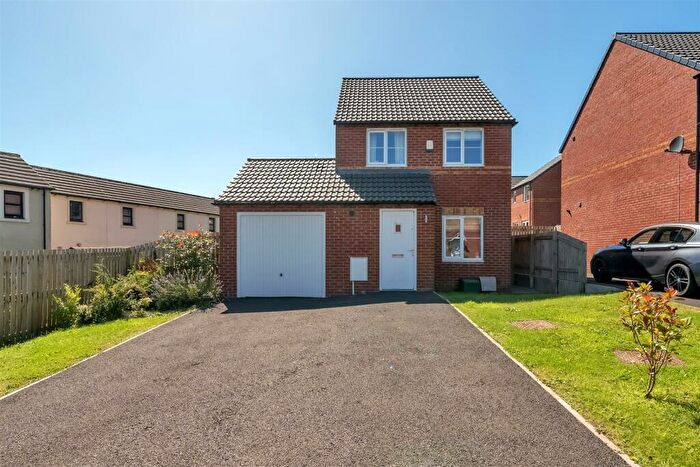
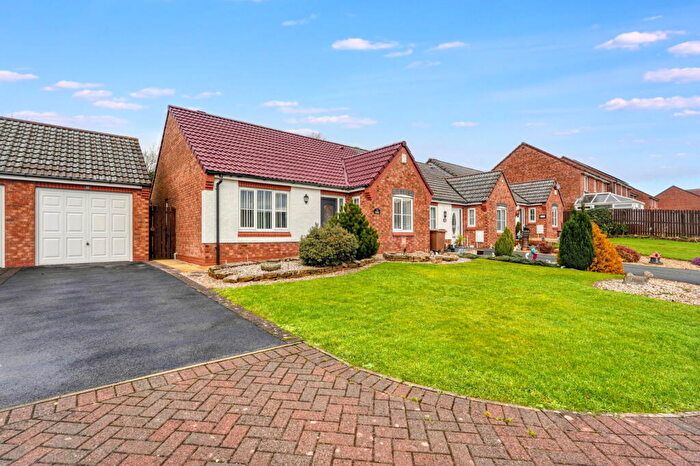
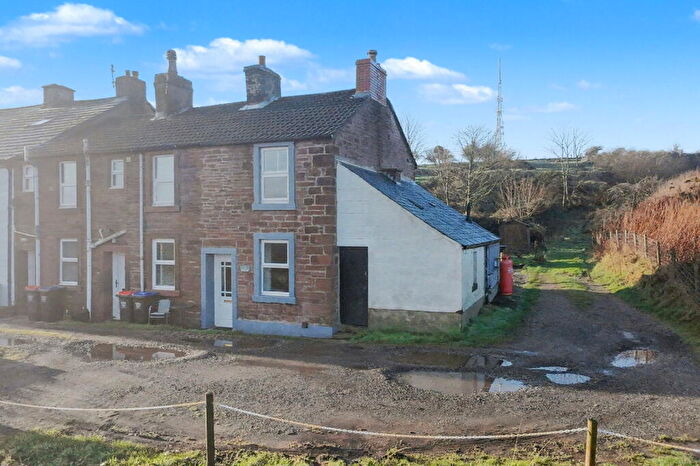
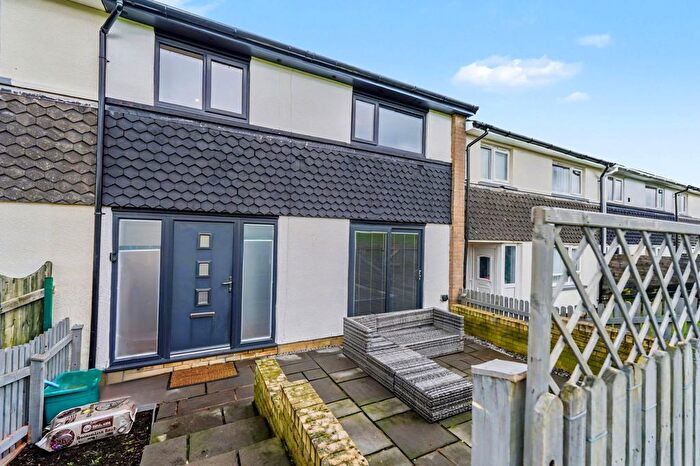
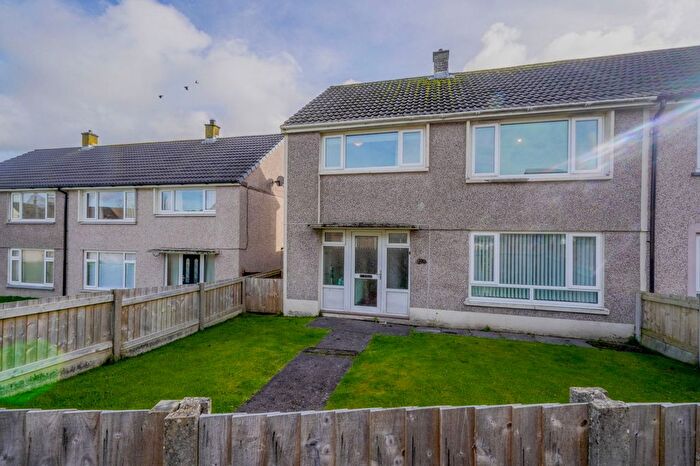
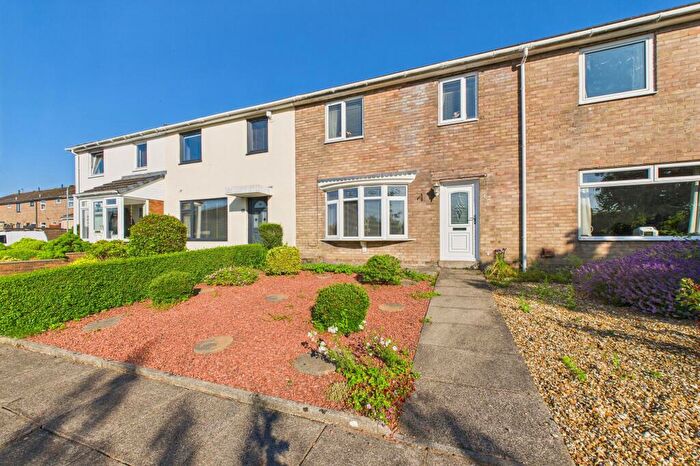
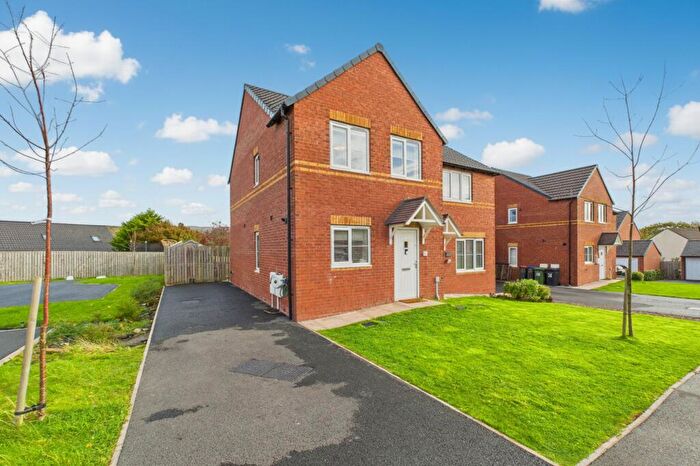
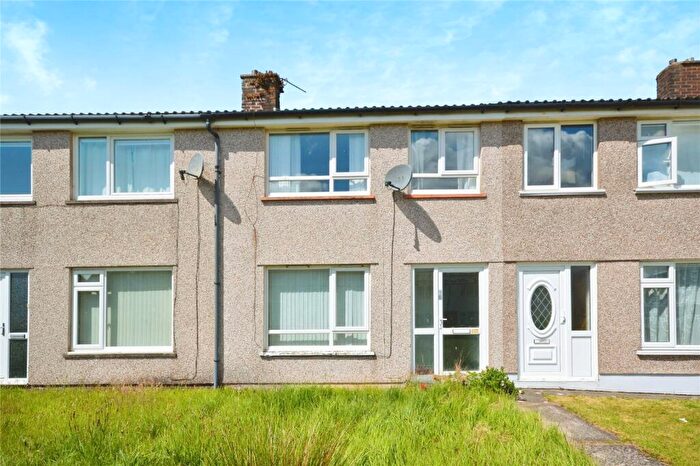
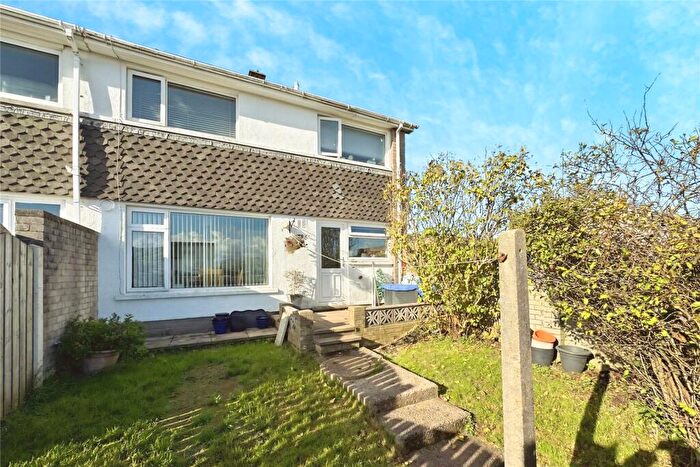
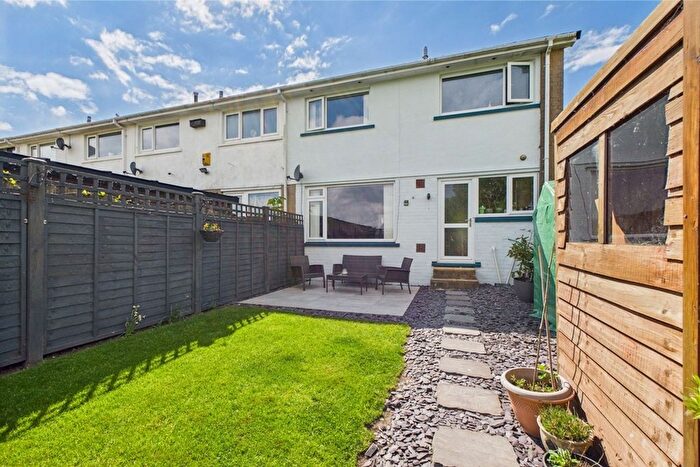
Houses for sale & to rent in Egremont North, Egremont
House Prices in Egremont North
Properties in Egremont North have an average house price of £130,502.00 and had 117 Property Transactions within the last 3 years¹.
Egremont North is an area in Egremont, Cumbria with 1,383 households², where the most expensive property was sold for £440,000.00.
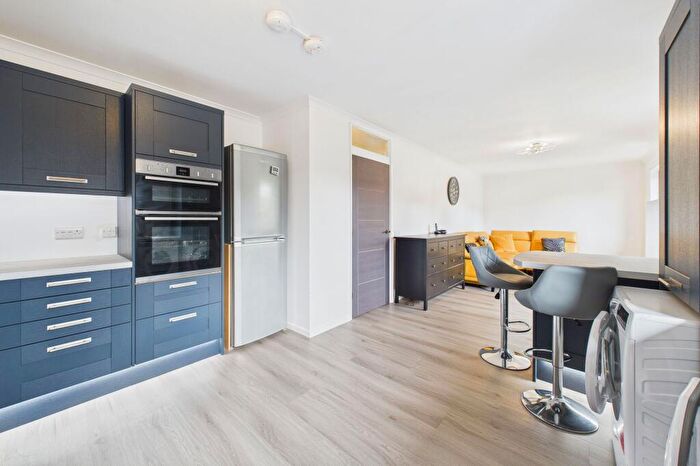
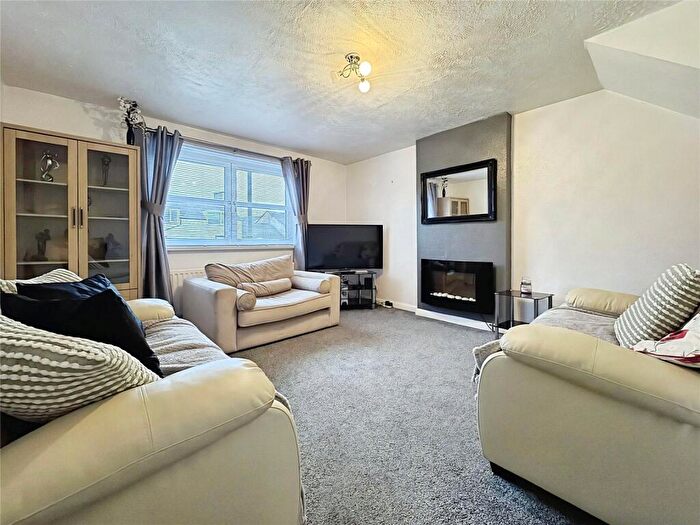
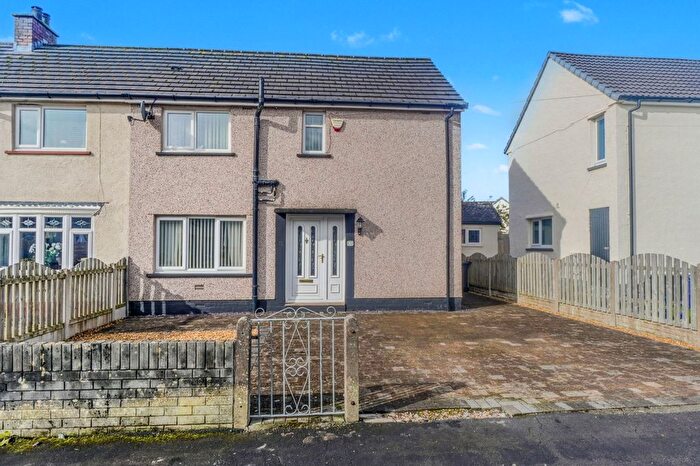
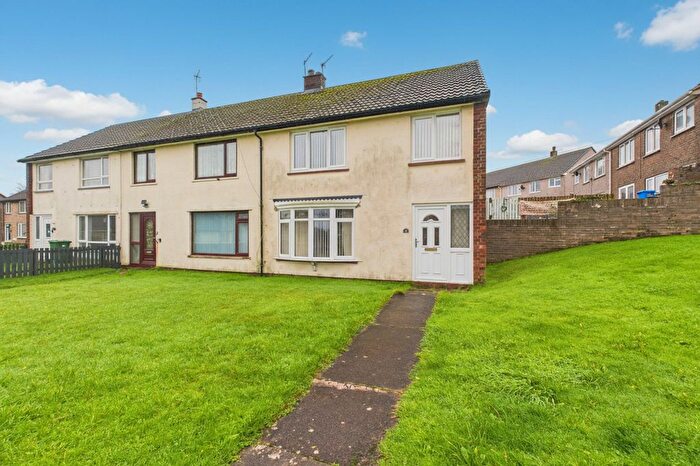
Properties for sale in Egremont North
Previously listed properties in Egremont North
Roads and Postcodes in Egremont North
Navigate through our locations to find the location of your next house in Egremont North, Egremont for sale or to rent.
| Streets | Postcodes |
|---|---|
| Ashlea Road | CA22 2HS |
| Bankend View | CA22 2TH |
| Beech Avenue | CA22 2QA |
| Cain Street | CA22 2TP |
| Chapel Street | CA22 2UU |
| Chaucer Avenue | CA22 2HB |
| Clintz Road | CA22 2QU |
| Coleridge Drive | CA22 2EU CA22 2EX |
| Croadalla Avenue | CA22 2EZ CA22 2QL |
| Croftlands | CA22 2UX |
| Downfield Lane | CA22 2UY |
| Dryden Way | CA22 2HA |
| Far Moor | CA22 2UZ |
| Gillfoot | CA22 2QH |
| Gillfoot Avenue | CA22 2QE |
| Gillfoot Road | CA22 2QD |
| Goldsmith Road | CA22 2HL |
| Greenmoor Road | CA22 2PZ CA22 2QR CA22 2QS |
| High Street | CA22 2TR |
| How Bank | CA22 2QJ |
| Howbank Road | CA22 2PX CA22 2QB |
| Jubilee Gardens | CA22 2RA |
| Keats Drive | CA22 2EY |
| Langhorn Court | CA22 2QZ |
| Longlands Close | CA22 2QX |
| Mansion Gardens | CA22 2QY |
| Milton Road | CA22 2HD |
| New Street | CA22 2TW |
| Office Cottages | CA22 2TF |
| Old Smithfield | CA22 2QP CA22 2QW |
| Orepit Cottages | CA22 2TE |
| Park View | CA22 2TT |
| Peel Gardens | CA22 2XA |
| Shakespeare Avenue | CA22 2HF |
| Smithfield Road | CA22 2PY CA22 2QF |
| Southey Avenue | CA22 2HH |
| Southey Walk | CA22 2HJ |
| Springfield | CA22 2UT |
| Springfield Gardens | CA22 2TS |
| Springfield Road | CA22 2SX CA22 2TJ CA22 2TL CA22 2TN CA22 2TQ |
| St Johns Terrace | CA22 2TU |
| Tennyson Drive | CA22 2HQ |
| The Crescent | CA22 2QG |
| The Elms | CA22 2HZ |
| The Ferns | CA22 2JB |
| The Hollies | CA22 2JD |
| The Larches | CA22 2JE |
| The Laurels | CA22 2HY |
| The Lilacs | CA22 2HU |
| The Limes | CA22 2JA |
| The Oaks | CA22 2HX |
| The Rowans | CA22 2HP CA22 2HW |
| The Willows | CA22 2HT |
| Treetops | CA22 2WB |
| Whitegate | CA22 2BQ |
| Woodend | CA22 2SZ CA22 2TA CA22 2TB CA22 2TD |
| Wordsworth Close | CA22 2HG |
| CA22 2TX |
Transport near Egremont North
- FAQ
- Price Paid By Year
- Property Type Price
Frequently asked questions about Egremont North
What is the average price for a property for sale in Egremont North?
The average price for a property for sale in Egremont North is £130,502. This amount is 13% lower than the average price in Egremont. There are 352 property listings for sale in Egremont North.
What streets have the most expensive properties for sale in Egremont North?
The streets with the most expensive properties for sale in Egremont North are Orepit Cottages at an average of £440,000, Chapel Street at an average of £305,000 and Longlands Close at an average of £275,500.
What streets have the most affordable properties for sale in Egremont North?
The streets with the most affordable properties for sale in Egremont North are Old Smithfield at an average of £75,290, Milton Road at an average of £89,100 and Springfield Road at an average of £89,500.
Which train stations are available in or near Egremont North?
Some of the train stations available in or near Egremont North are St.Bees, Nethertown and Braystones.
Property Price Paid in Egremont North by Year
The average sold property price by year was:
| Year | Average Sold Price | Price Change |
Sold Properties
|
|---|---|---|---|
| 2025 | £136,535 | -1% |
30 Properties |
| 2024 | £138,261 | 16% |
49 Properties |
| 2023 | £115,736 | -22% |
38 Properties |
| 2022 | £141,629 | 13% |
40 Properties |
| 2021 | £123,508 | 19% |
49 Properties |
| 2020 | £100,203 | -16% |
29 Properties |
| 2019 | £116,710 | -4% |
32 Properties |
| 2018 | £121,064 | 10% |
46 Properties |
| 2017 | £108,531 | 5% |
33 Properties |
| 2016 | £102,639 | -27% |
38 Properties |
| 2015 | £130,435 | 11% |
51 Properties |
| 2014 | £116,692 | -2% |
52 Properties |
| 2013 | £119,101 | -6% |
26 Properties |
| 2012 | £125,937 | 16% |
32 Properties |
| 2011 | £105,287 | -3% |
32 Properties |
| 2010 | £108,841 | -15% |
24 Properties |
| 2009 | £124,970 | 13% |
33 Properties |
| 2008 | £109,117 | -14% |
37 Properties |
| 2007 | £123,993 | 5% |
96 Properties |
| 2006 | £117,420 | -2% |
70 Properties |
| 2005 | £119,734 | 13% |
61 Properties |
| 2004 | £104,272 | 37% |
103 Properties |
| 2003 | £65,604 | 39% |
50 Properties |
| 2002 | £39,836 | -4% |
46 Properties |
| 2001 | £41,483 | 0,5% |
33 Properties |
| 2000 | £41,293 | -13% |
37 Properties |
| 1999 | £46,831 | 17% |
40 Properties |
| 1998 | £38,772 | 3% |
36 Properties |
| 1997 | £37,562 | 28% |
27 Properties |
| 1996 | £27,065 | -38% |
22 Properties |
| 1995 | £37,454 | - |
37 Properties |
Property Price per Property Type in Egremont North
Here you can find historic sold price data in order to help with your property search.
The average Property Paid Price for specific property types in the last three years are:
| Property Type | Average Sold Price | Sold Properties |
|---|---|---|
| Semi Detached House | £128,330.00 | 35 Semi Detached Houses |
| Detached House | £243,585.00 | 17 Detached Houses |
| Terraced House | £102,097.00 | 65 Terraced Houses |

