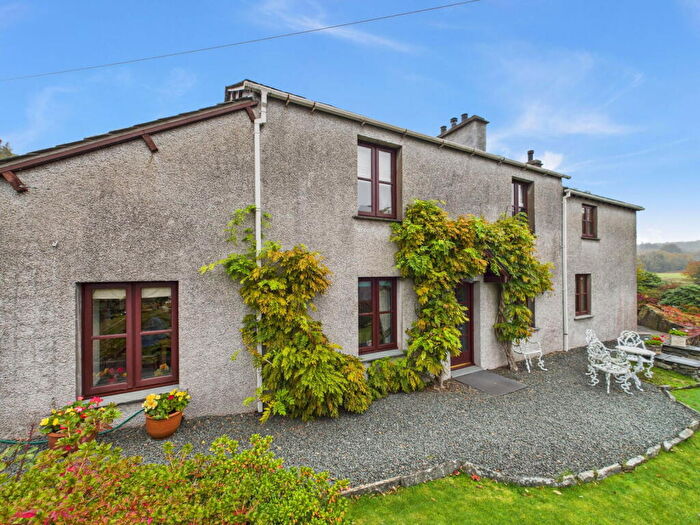
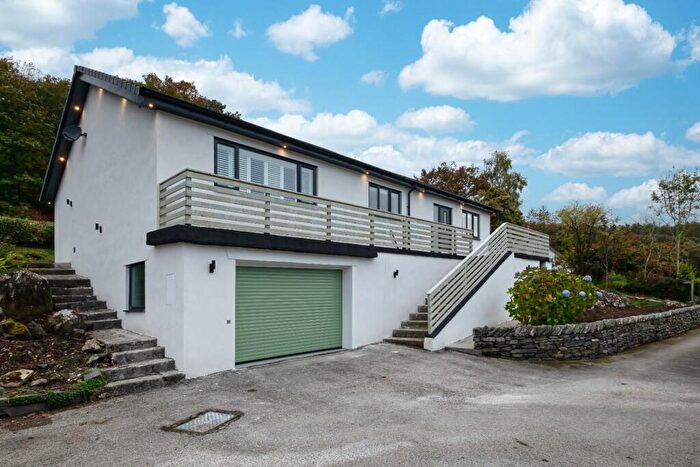
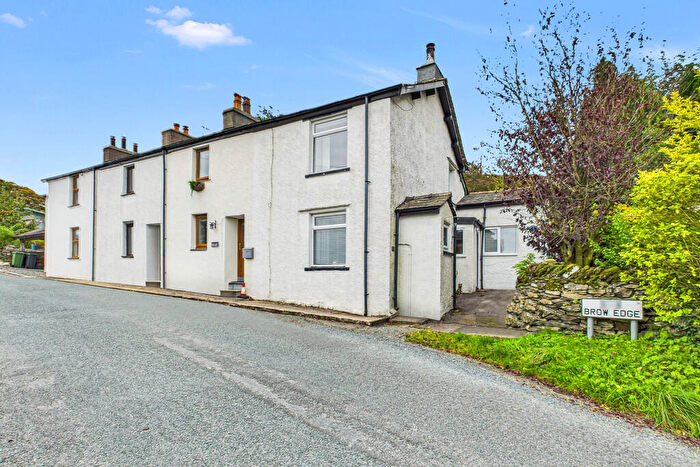
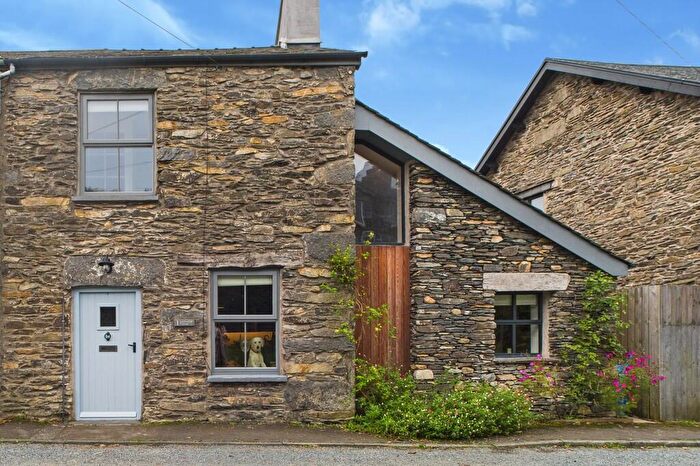
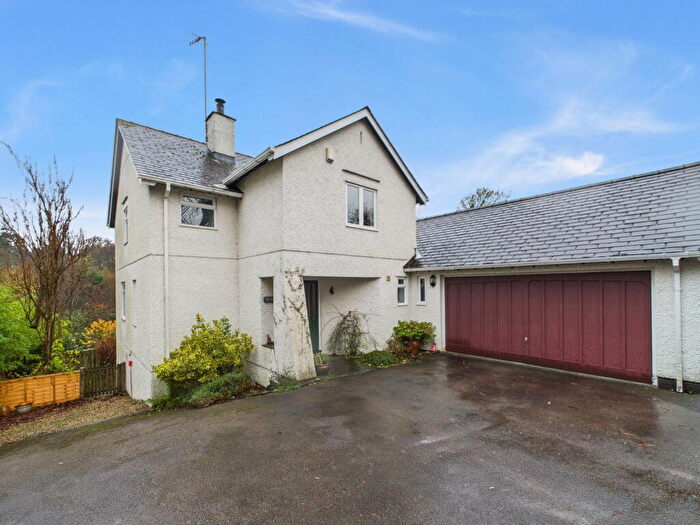
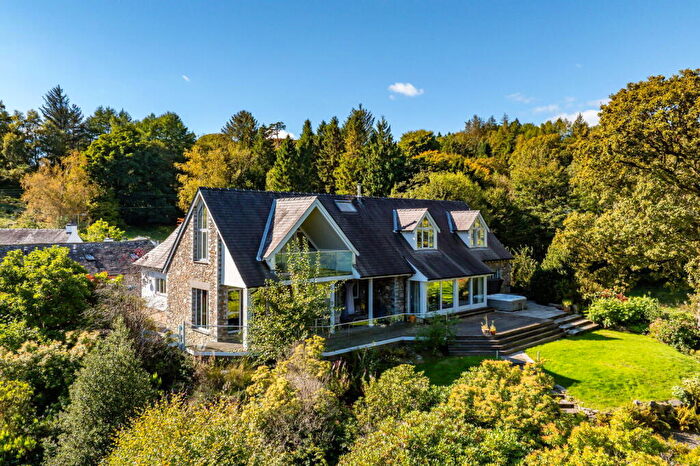
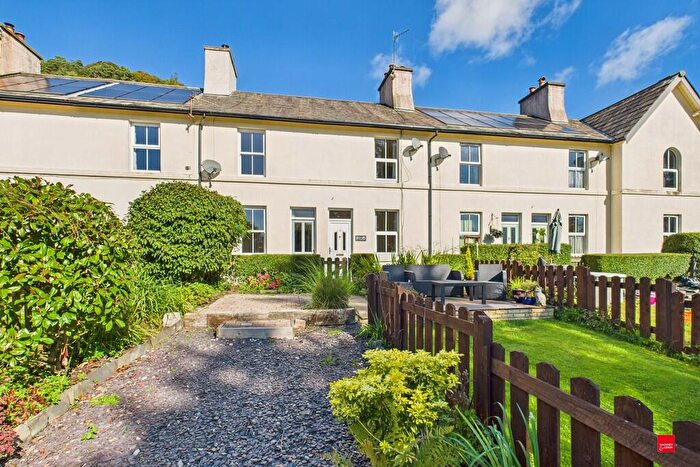
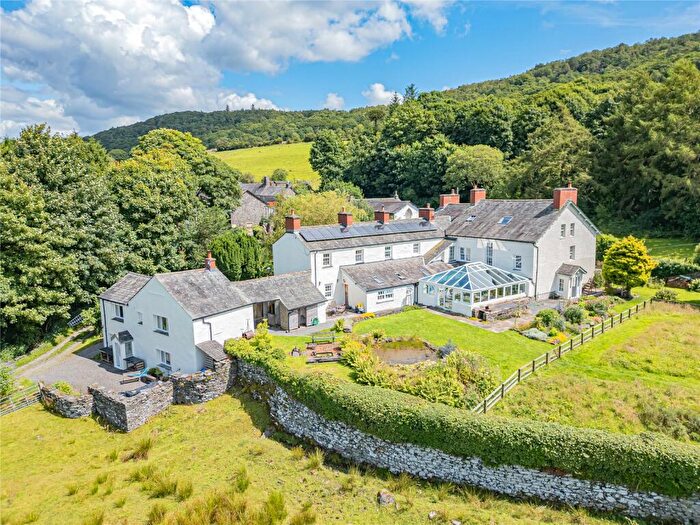
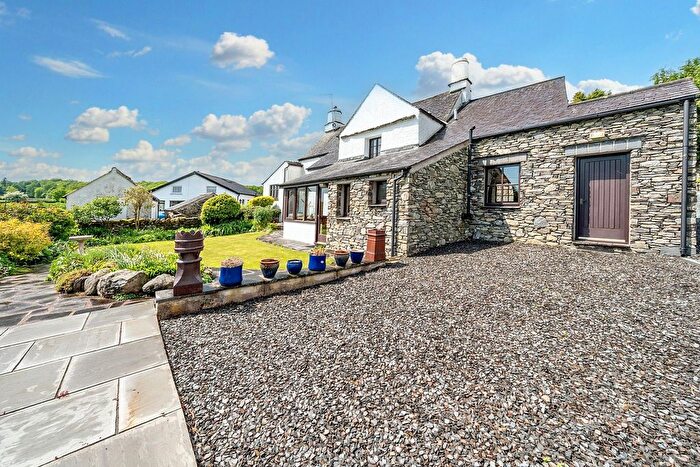
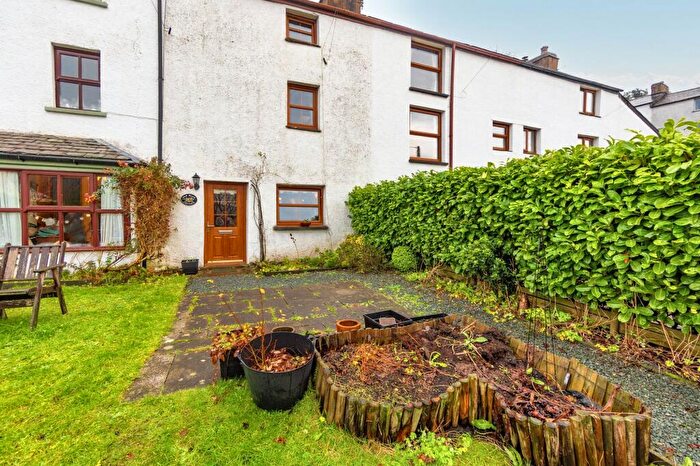
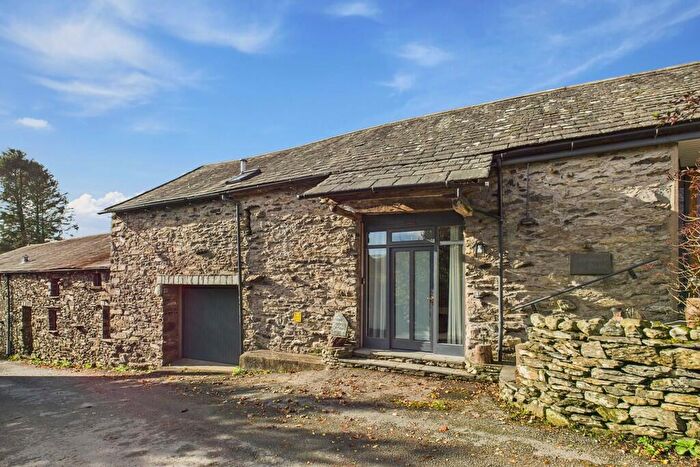
Houses for sale & to rent in Staveley-in-cartmel, Ulverston
House Prices in Staveley-in-cartmel
Properties in Staveley-in-cartmel have an average house price of £533,263.00 and had 60 Property Transactions within the last 3 years¹.
Staveley-in-cartmel is an area in Ulverston, Cumbria with 426 households², where the most expensive property was sold for £8,100,000.00.
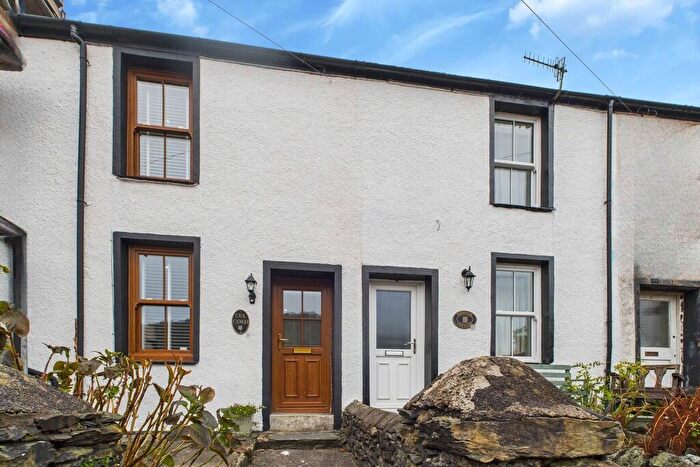
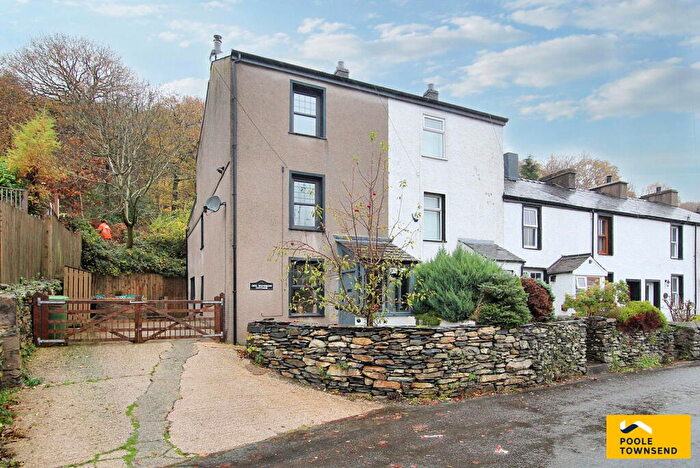
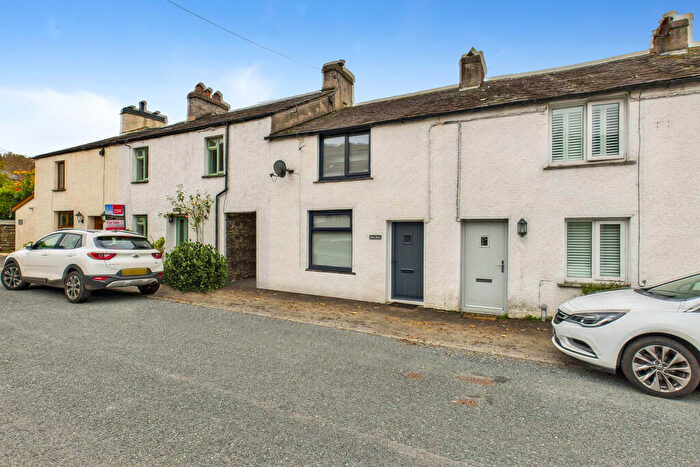
Properties for sale in Staveley-in-cartmel
Roads and Postcodes in Staveley-in-cartmel
Navigate through our locations to find the location of your next house in Staveley-in-cartmel, Ulverston for sale or to rent.
| Streets | Postcodes |
|---|---|
| Abbots Vue | LA12 8RA |
| Backbarrow | LA12 8PA LA12 8PB LA12 8PX LA12 8PZ LA12 8QD LA12 8QF |
| Bens Row | LA12 8QL |
| Brow Edge | LA12 8QX |
| Brow Edge Road | LA12 8PP LA12 8PS LA12 8PU LA12 8PW LA12 8QH LA12 8QP LA12 8QT |
| Brow Side | LA12 8QR |
| Canny Hill | LA12 8NT LA12 8NU |
| Cleminson Row | LA12 8QS |
| Fell Side | LA12 8QW |
| Finsthwaite Lane | LA12 8PY |
| Forresters Walk | LA12 8RD |
| Fox Howe | LA12 8PT |
| Hazelrigg Lane | LA12 8NY LA12 8NZ |
| High Brow Edge | LA12 8QY |
| High Row | LA12 8QN |
| Leven Court | LA12 8RB |
| Levensgarth | LA12 8AG |
| Linsty Green | LA12 8QE |
| Low Wood | LA12 8LY |
| Newby Bridge | LA12 8LZ LA12 8ND LA12 8NE LA12 8NG LA12 8NL LA12 8NN LA12 8NP LA12 8NQ LA12 8NR LA12 8NS LA12 8NX |
| The Cottages | LA12 8QA |
| The Fold | LA12 8PN |
| The Glen | LA12 8QG |
| The Orchard | LA12 8BF |
| Water Close | LA12 8QZ |
| Wilkinson View | LA12 8RE |
| Woodside Cottages | LA12 8AL LA12 8QB |
| LA12 8AD LA12 8AE LA12 8AF LA12 8AJ LA12 8JP LA12 8JW LA12 8NH LA12 8PE |
Transport near Staveley-in-cartmel
-
Grange-Over-Sands Station
-
Cark and Cartmel Station
-
Kents Bank Station
-
Ulverston Station
-
Arnside Station
-
Kirkby-In-Furness Station
-
Windermere Station
-
Foxfield Station
-
Silverdale Station
- FAQ
- Price Paid By Year
- Property Type Price
Frequently asked questions about Staveley-in-cartmel
What is the average price for a property for sale in Staveley-in-cartmel?
The average price for a property for sale in Staveley-in-cartmel is £533,263. This amount is 85% higher than the average price in Ulverston. There are 119 property listings for sale in Staveley-in-cartmel.
What streets have the most expensive properties for sale in Staveley-in-cartmel?
The streets with the most expensive properties for sale in Staveley-in-cartmel are Newby Bridge at an average of £2,486,205, Hazelrigg Lane at an average of £630,000 and Forresters Walk at an average of £380,000.
What streets have the most affordable properties for sale in Staveley-in-cartmel?
The streets with the most affordable properties for sale in Staveley-in-cartmel are The Cottages at an average of £195,000, Abbots Vue at an average of £196,250 and Brow Side at an average of £200,000.
Which train stations are available in or near Staveley-in-cartmel?
Some of the train stations available in or near Staveley-in-cartmel are Grange-Over-Sands, Cark and Cartmel and Kents Bank.
Property Price Paid in Staveley-in-cartmel by Year
The average sold property price by year was:
| Year | Average Sold Price | Price Change |
Sold Properties
|
|---|---|---|---|
| 2025 | £330,111 | -157% |
9 Properties |
| 2024 | £848,200 | 44% |
16 Properties |
| 2023 | £471,608 | 11% |
14 Properties |
| 2022 | £421,480 | 0,3% |
21 Properties |
| 2021 | £420,250 | 26% |
24 Properties |
| 2020 | £310,382 | -9% |
14 Properties |
| 2019 | £337,809 | -19% |
21 Properties |
| 2018 | £401,892 | 24% |
14 Properties |
| 2017 | £305,616 | 24% |
21 Properties |
| 2016 | £233,735 | -20% |
17 Properties |
| 2015 | £280,750 | -4% |
18 Properties |
| 2014 | £291,071 | 8% |
14 Properties |
| 2013 | £267,227 | -24% |
11 Properties |
| 2012 | £332,390 | 23% |
5 Properties |
| 2011 | £254,850 | 12% |
10 Properties |
| 2010 | £223,458 | -58% |
12 Properties |
| 2009 | £352,222 | 14% |
11 Properties |
| 2008 | £304,545 | -1% |
11 Properties |
| 2007 | £308,718 | -9% |
24 Properties |
| 2006 | £336,861 | 24% |
18 Properties |
| 2005 | £254,662 | 5% |
18 Properties |
| 2004 | £240,973 | 22% |
21 Properties |
| 2003 | £187,932 | 37% |
23 Properties |
| 2002 | £117,625 | -120% |
22 Properties |
| 2001 | £258,941 | 56% |
30 Properties |
| 2000 | £112,926 | -1% |
25 Properties |
| 1999 | £114,375 | -8% |
24 Properties |
| 1998 | £122,978 | 15% |
26 Properties |
| 1997 | £104,547 | 2% |
37 Properties |
| 1996 | £102,570 | 5% |
20 Properties |
| 1995 | £97,325 | - |
10 Properties |
Property Price per Property Type in Staveley-in-cartmel
Here you can find historic sold price data in order to help with your property search.
The average Property Paid Price for specific property types in the last three years are:
| Property Type | Average Sold Price | Sold Properties |
|---|---|---|
| Semi Detached House | £391,859.00 | 19 Semi Detached Houses |
| Detached House | £867,125.00 | 24 Detached Houses |
| Terraced House | £231,433.00 | 15 Terraced Houses |
| Flat | £134,000.00 | 2 Flats |

