
Houses for sale & to rent in Staveley-in-cartmel, Grange-over-sands
House Prices in Staveley-in-cartmel
Properties in Staveley-in-cartmel have an average house price of £471,978.00 and had 25 Property Transactions within the last 3 years¹.
Staveley-in-cartmel is an area in Grange-over-sands, Cumbria with 308 households², where the most expensive property was sold for £840,000.00.
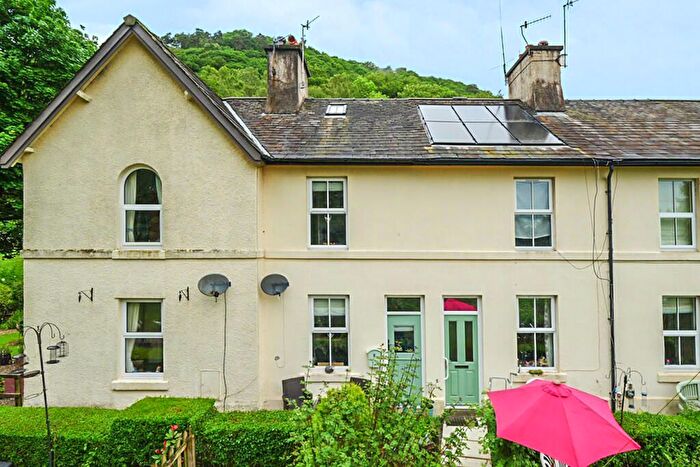
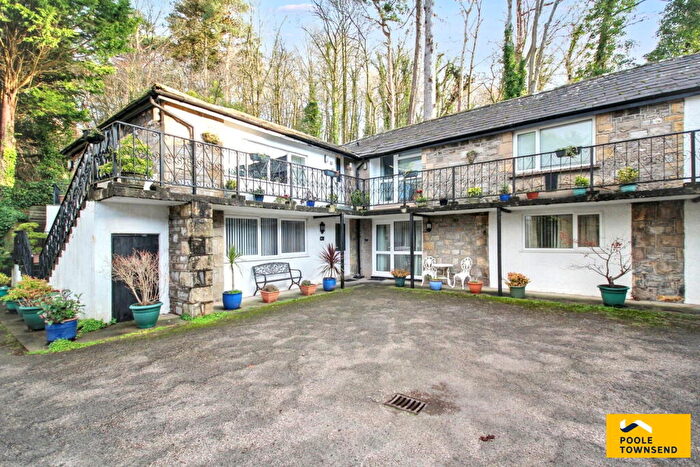
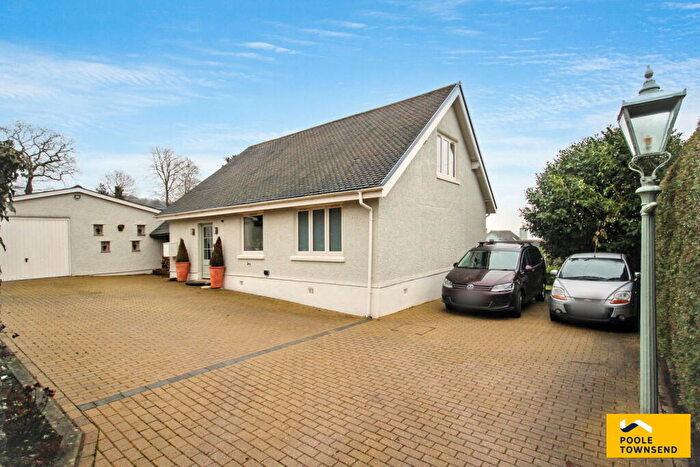
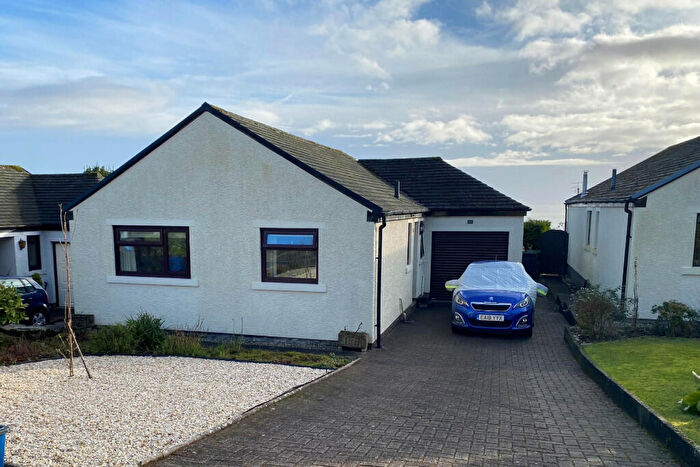
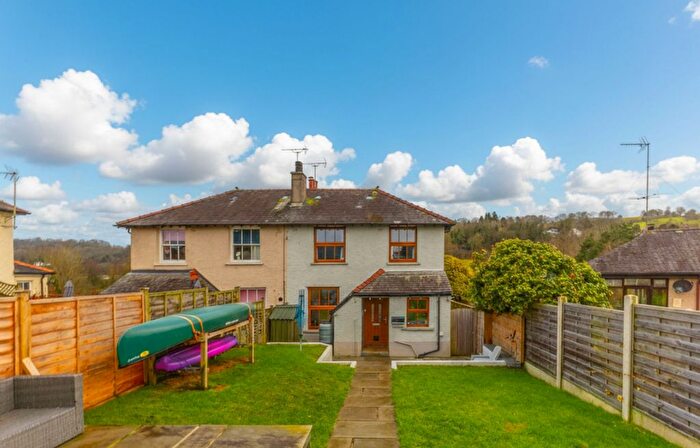
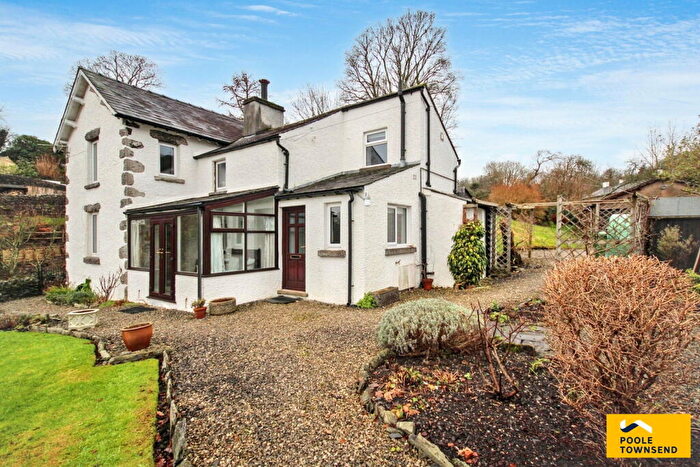
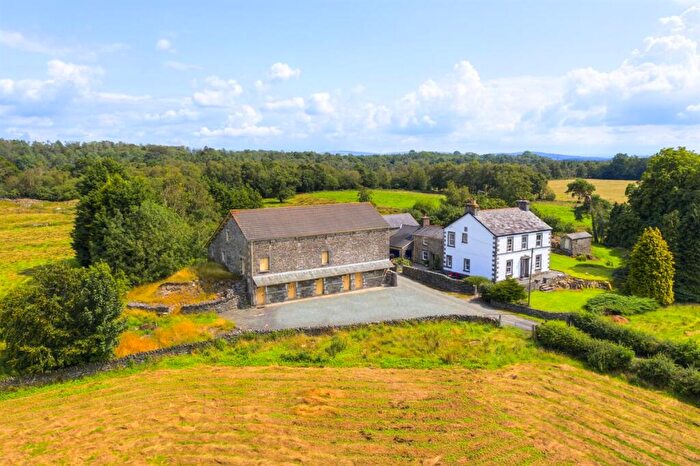
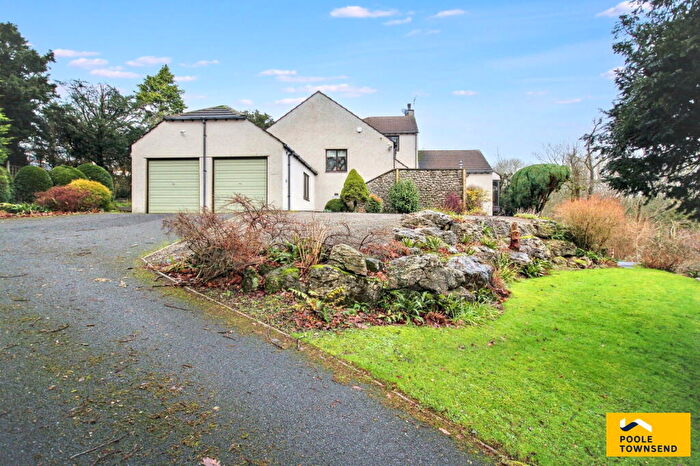
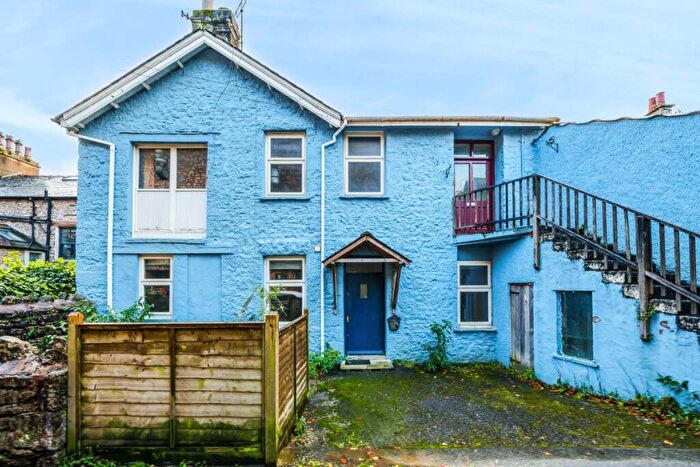
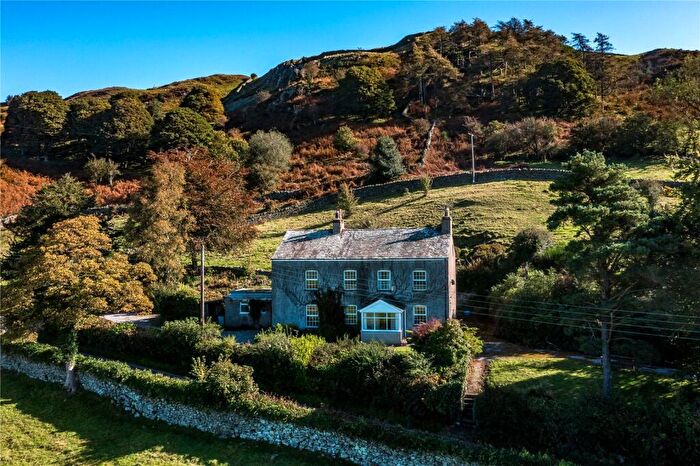
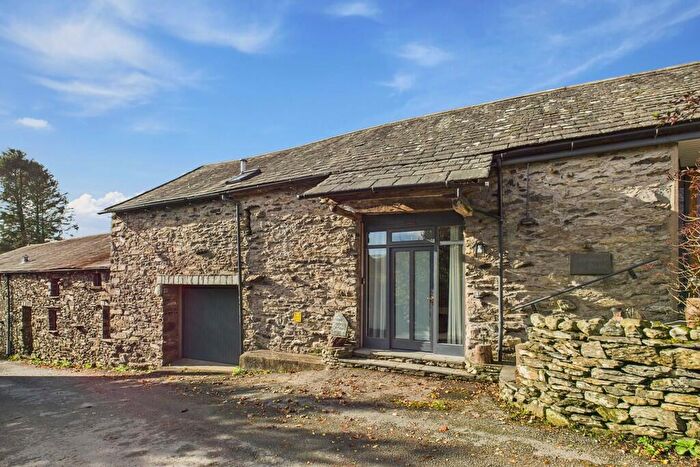
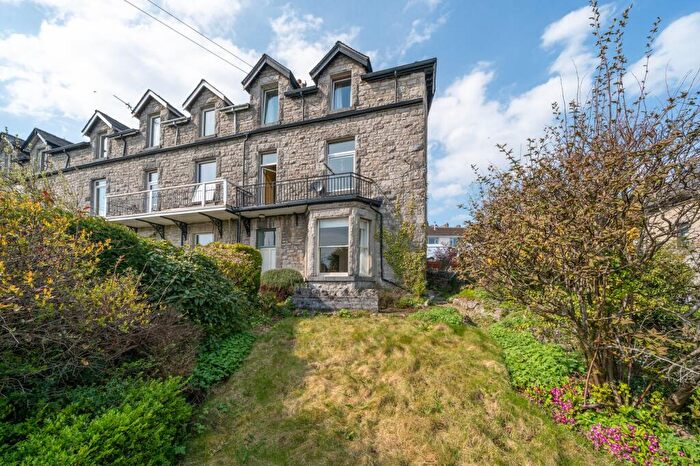
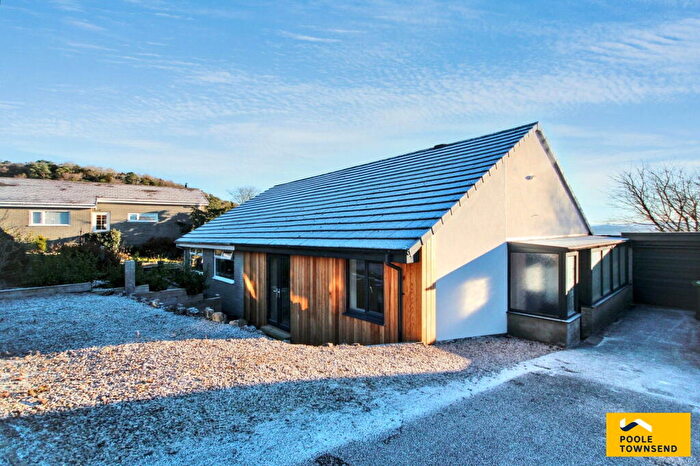
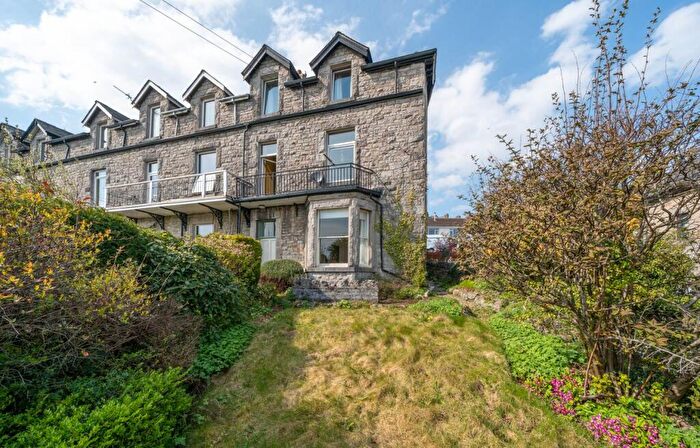
Properties for sale in Staveley-in-cartmel

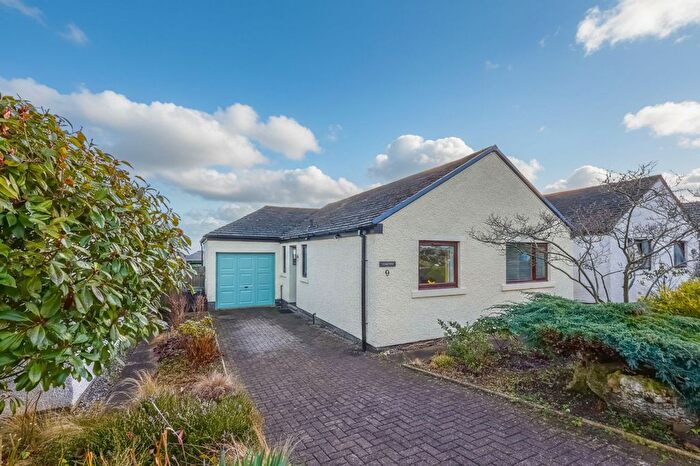
![]()
If you are looking to sell your house, let it out, or receive a property valuation, an expert can help you.
Click the button below to get started.


Roads and Postcodes in Staveley-in-cartmel
Navigate through our locations to find the location of your next house in Staveley-in-cartmel, Grange-over-sands for sale or to rent.
| Streets | Postcodes |
|---|---|
| Aynsome Manor Park | LA11 6HH |
| Ayside | LA11 6HX LA11 6HY LA11 6HZ LA11 6JB LA11 6JE |
| Barber Green | LA11 6HU |
| Cartmel Road | LA11 6LZ |
| High Hampsfield | LA11 6LY |
| Windermere Road | LA11 6JX |
| Wood Broughton | LA11 7SJ |
| LA11 6HL LA11 6HN LA11 6HP LA11 6HR LA11 6HS LA11 6HT LA11 6HW LA11 6JH LA11 6JJ LA11 6JL LA11 6JP LA11 6JQ LA11 6NE LA11 6NF LA11 6NH LA11 6NL LA11 6NP LA11 6NQ LA11 6NS LA11 6NT LA11 6NU LA11 6NZ LA11 6RZ LA11 7SH |
Transport near Staveley-in-cartmel
-
 Grange-Over-Sands Station
 -
Arnside Station
-
Kents Bank Station
-
Cark and Cartmel Station
-
Silverdale Station
-
Ulverston Station
-
Oxenholme Lake District Station
-
Windermere Station
-
Kendal Station
-
Burneside Station
- FAQ
- Price Paid By Year
- Property Type Price
Frequently asked questions about Staveley-in-cartmel
What is the average price for a property for sale in Staveley-in-cartmel?
The average price for a property for sale in Staveley-in-cartmel is £471,978. This amount is 51% higher than the average price in Grange-over-sands. There are 265 property listings for sale in Staveley-in-cartmel.
What streets have the most expensive properties for sale in Staveley-in-cartmel?
The streets with the most expensive properties for sale in Staveley-in-cartmel are Ayside at an average of £668,750 and Barber Green at an average of £545,828.
What streets have the most affordable properties for sale in Staveley-in-cartmel?
The streets with the most affordable properties for sale in Staveley-in-cartmel are Aynsome Manor Park at an average of £313,250 and Windermere Road at an average of £348,333.
Which train stations are available in or near Staveley-in-cartmel?
Some of the train stations available in or near Staveley-in-cartmel are Grange-Over-Sands, Arnside and Kents Bank.
Property Price Paid in Staveley-in-cartmel by Year
The average sold property price by year was:
| Year | Average Sold Price | Price Change |
Sold Properties
|
|---|---|---|---|
| 2025 | £304,000 | -46% |
3 Properties |
| 2024 | £444,621 | -18% |
8 Properties |
| 2023 | £523,607 | 13% |
14 Properties |
| 2022 | £458,125 | 18% |
16 Properties |
| 2021 | £376,559 | -12% |
19 Properties |
| 2020 | £422,442 | -4% |
13 Properties |
| 2019 | £439,642 | 22% |
7 Properties |
| 2018 | £341,000 | -10% |
14 Properties |
| 2017 | £376,388 | 14% |
17 Properties |
| 2016 | £324,272 | 2% |
11 Properties |
| 2015 | £316,868 | -3% |
8 Properties |
| 2014 | £326,906 | -13% |
16 Properties |
| 2013 | £370,785 | 24% |
7 Properties |
| 2012 | £282,677 | -13% |
9 Properties |
| 2011 | £320,444 | 9% |
9 Properties |
| 2010 | £291,944 | -4% |
9 Properties |
| 2009 | £302,661 | -24% |
9 Properties |
| 2008 | £376,000 | 2% |
10 Properties |
| 2007 | £369,708 | 12% |
12 Properties |
| 2006 | £324,419 | -5% |
23 Properties |
| 2005 | £340,313 | 19% |
11 Properties |
| 2004 | £276,785 | 18% |
14 Properties |
| 2003 | £225,774 | 19% |
23 Properties |
| 2002 | £182,605 | 2% |
19 Properties |
| 2001 | £179,529 | 29% |
17 Properties |
| 2000 | £127,250 | 20% |
10 Properties |
| 1999 | £101,833 | -39% |
15 Properties |
| 1998 | £141,571 | 30% |
14 Properties |
| 1997 | £99,750 | -1% |
13 Properties |
| 1996 | £100,736 | 19% |
18 Properties |
| 1995 | £81,125 | - |
8 Properties |
Property Price per Property Type in Staveley-in-cartmel
Here you can find historic sold price data in order to help with your property search.
The average Property Paid Price for specific property types in the last three years are:
| Property Type | Average Sold Price | Sold Properties |
|---|---|---|
| Semi Detached House | £530,000.00 | 3 Semi Detached Houses |
| Detached House | £582,612.00 | 13 Detached Houses |
| Terraced House | £310,000.00 | 3 Terraced Houses |
| Flat | £284,250.00 | 6 Flats |