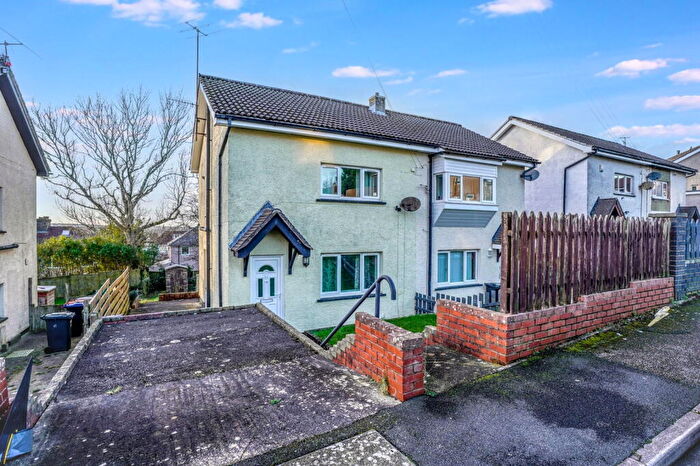
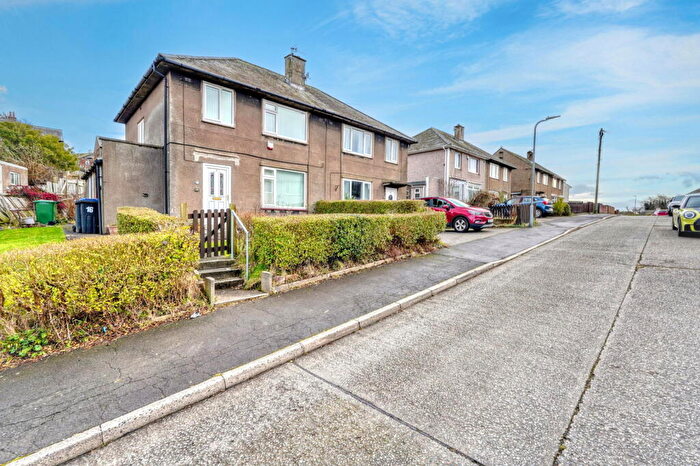
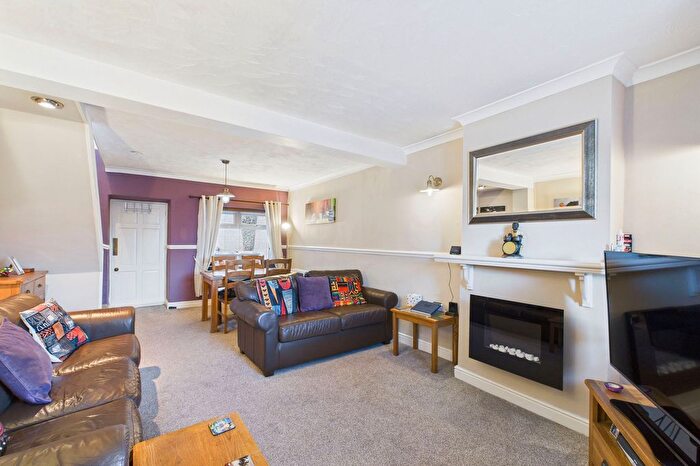
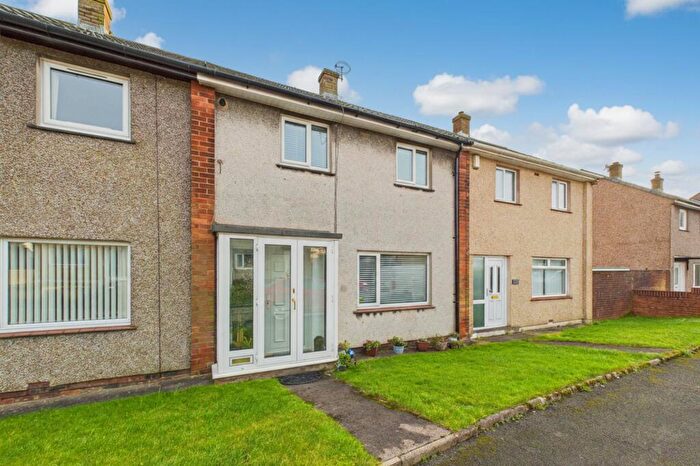
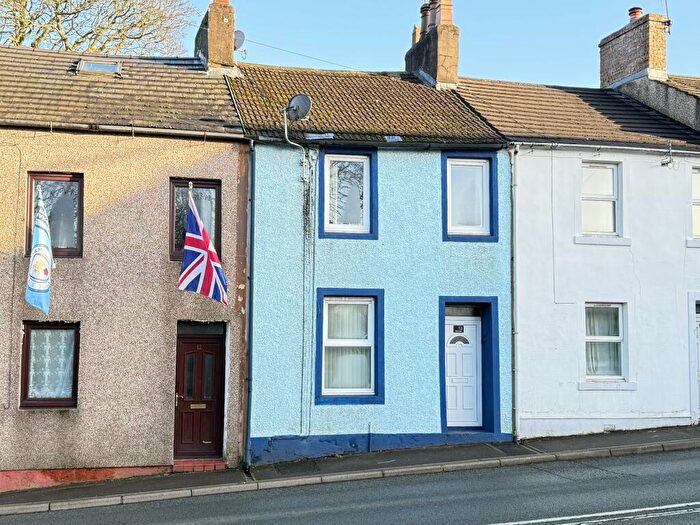
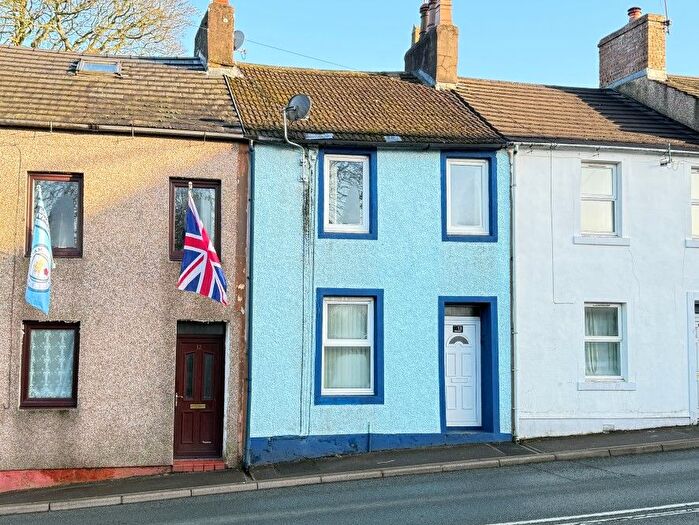
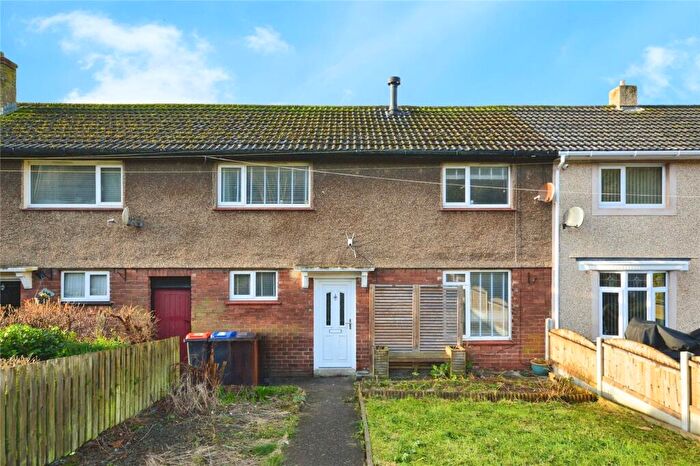
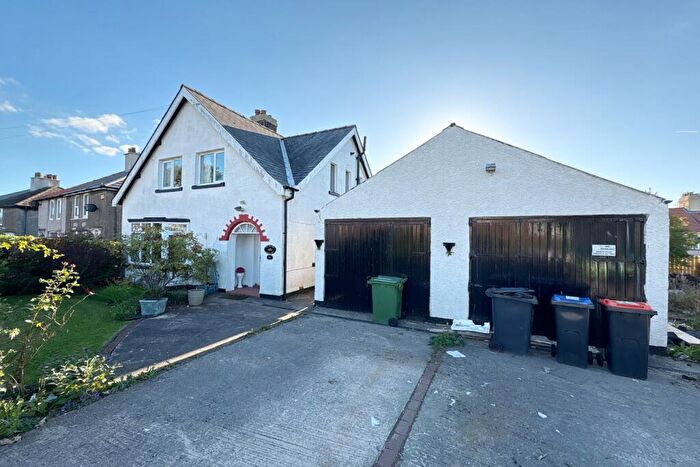
Houses for sale & to rent in Hensingham, Whitehaven
House Prices in Hensingham
Properties in Hensingham have an average house price of £137,673.00 and had 189 Property Transactions within the last 3 years¹.
Hensingham is an area in Whitehaven, Cumbria with 1,720 households², where the most expensive property was sold for £425,000.00.
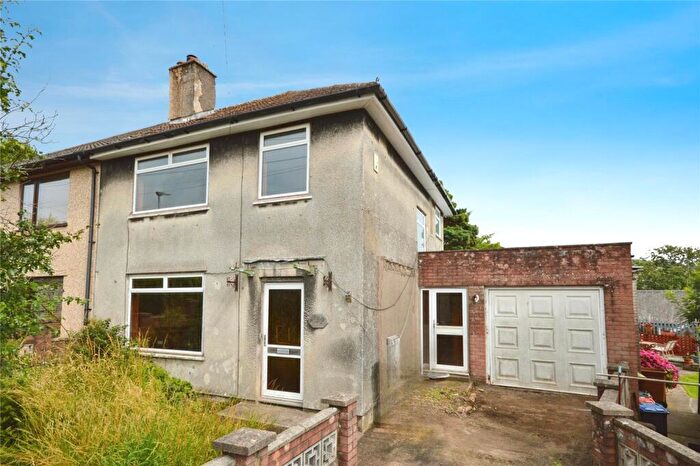
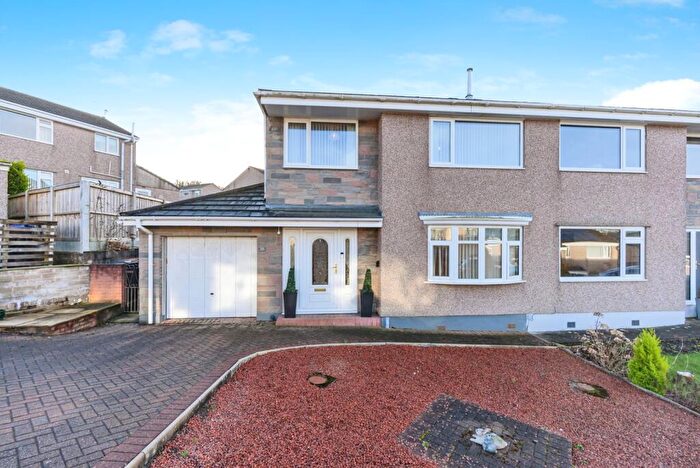
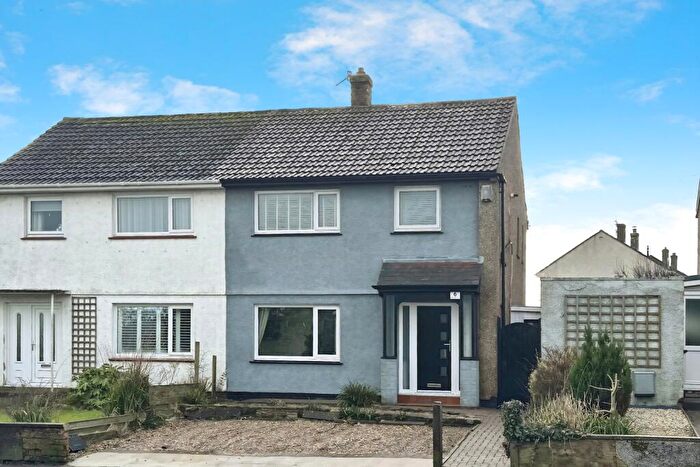
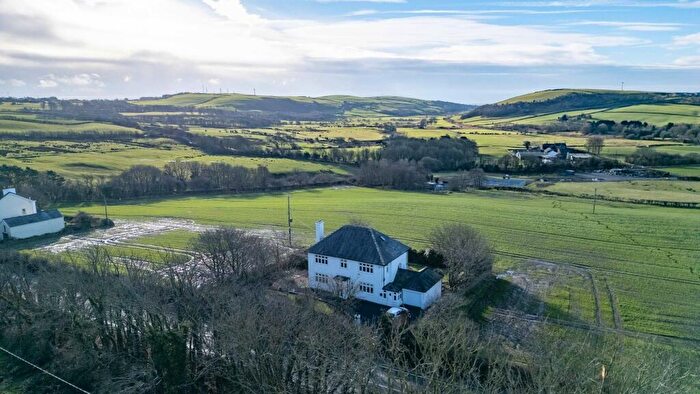
Properties for sale in Hensingham
Roads and Postcodes in Hensingham
Navigate through our locations to find the location of your next house in Hensingham, Whitehaven for sale or to rent.
| Streets | Postcodes |
|---|---|
| Bedford Street | CA28 8QN |
| Bedford Villas | CA28 8QP |
| Brook Bank | CA28 8PZ |
| Caldbeck Road | CA28 6XQ |
| Cambridge Road | CA28 8NX CA28 8PA CA28 8PB |
| Carlton Drive | CA28 6XB |
| Cartgate Road | CA28 8QE |
| Church Hill | CA28 8NE |
| Church Lane | CA28 8RQ |
| Cleator Moor Road | CA28 8RZ |
| Cumberland Road | CA28 8NY CA28 8NZ |
| Devon Road | CA28 8PJ |
| Dorset Close | CA28 8JP |
| Egremont Road | CA28 8NL CA28 8NN CA28 8NQ CA28 8QB CA28 8QR CA28 8QW |
| Garden Villas | CA28 8QS |
| Glenridding Walk | CA28 8SH CA28 8SJ CA28 8SQ |
| Granville Close | CA28 6UN |
| Holly Terrace | CA28 8RF |
| Homewood Drive | CA28 8JG CA28 8JS |
| Homewood Road | CA28 8JH CA28 8JJ CA28 8JL |
| Horsfield Close | CA28 8UA |
| Jubilee Road | CA28 6XJ |
| Lincoln Road | CA28 8NP CA28 8NR CA28 8NW |
| Main Street | CA28 8PX CA28 8PY CA28 8QA CA28 8QD CA28 8QU CA28 8QX CA28 8QZ CA28 8RE CA28 8RG CA28 8TJ |
| Mariners Way | CA28 8QG |
| Martindale Close | CA28 8SL |
| Miterdale Close | CA28 6XH |
| Muncaster Close | CA28 8RP |
| Muncaster Road | CA28 8RR CA28 8RS |
| Overend Road | CA28 8SA CA28 8SB CA28 8SD |
| Oxford Close | CA28 8JW |
| Patterdale Avenue | CA28 8RU CA28 8RX |
| Patterdale Close | CA28 8RT |
| Queens Close | CA28 8RY |
| Red Lonning | CA28 6XE CA28 6XF CA28 6XG |
| Richmond Hill Road | CA28 8SR CA28 8SS CA28 8ST CA28 8SU CA28 8TN |
| Rosebank | CA28 8QJ CA28 8QL |
| Rowangate | CA28 8HX |
| Rutland Avenue | CA28 8LA CA28 8LB CA28 8LD CA28 8LE CA28 8LF CA28 8LG CA28 8LH CA28 8LQ |
| Selby Terrace | CA28 8RA |
| Sneckyeat Grove | CA28 8PQ |
| Sneckyeat Road | CA28 8PD CA28 8PE |
| St Johns Court | CA28 8QH |
| Suffolk Close | CA28 8JR |
| The Groves | CA28 8JT |
| Thornton Road | CA28 6UJ CA28 6UL CA28 6UW |
| Ullswater Avenue | CA28 8SE CA28 8SF CA28 8SG |
| Victoria Villas | CA28 8ND |
| West View | CA28 8QY |
| Westmorland Road | CA28 8JN CA28 8NS CA28 8NT |
| Williamsons Lane | CA28 8TL |
| Winston Drive | CA28 8RB CA28 8RD |
| Wythburn Close | CA28 8SN |
| Wythburn Road | CA28 8SP CA28 8SW |
Transport near Hensingham
- FAQ
- Price Paid By Year
- Property Type Price
Frequently asked questions about Hensingham
What is the average price for a property for sale in Hensingham?
The average price for a property for sale in Hensingham is £137,673. This amount is 13% lower than the average price in Whitehaven. There are 763 property listings for sale in Hensingham.
What streets have the most expensive properties for sale in Hensingham?
The streets with the most expensive properties for sale in Hensingham are Mariners Way at an average of £388,333, Church Hill at an average of £347,500 and Rowangate at an average of £338,000.
What streets have the most affordable properties for sale in Hensingham?
The streets with the most affordable properties for sale in Hensingham are Church Lane at an average of £53,332, Cumberland Road at an average of £68,000 and Suffolk Close at an average of £79,000.
Which train stations are available in or near Hensingham?
Some of the train stations available in or near Hensingham are Corkickle, Whitehaven and Parton.
Property Price Paid in Hensingham by Year
The average sold property price by year was:
| Year | Average Sold Price | Price Change |
Sold Properties
|
|---|---|---|---|
| 2025 | £148,375 | 6% |
64 Properties |
| 2024 | £139,991 | 12% |
68 Properties |
| 2023 | £122,889 | -3% |
57 Properties |
| 2022 | £127,020 | 8% |
92 Properties |
| 2021 | £116,894 | 1% |
92 Properties |
| 2020 | £116,220 | 2% |
55 Properties |
| 2019 | £113,477 | 8% |
64 Properties |
| 2018 | £104,170 | -11% |
55 Properties |
| 2017 | £115,825 | 7% |
47 Properties |
| 2016 | £107,584 | 2% |
70 Properties |
| 2015 | £105,105 | 1% |
68 Properties |
| 2014 | £103,544 | -15% |
43 Properties |
| 2013 | £119,102 | 8% |
51 Properties |
| 2012 | £109,173 | 3% |
45 Properties |
| 2011 | £105,577 | -11% |
46 Properties |
| 2010 | £117,050 | 13% |
47 Properties |
| 2009 | £101,361 | -4% |
32 Properties |
| 2008 | £105,481 | -9% |
60 Properties |
| 2007 | £114,923 | 10% |
79 Properties |
| 2006 | £103,033 | 14% |
80 Properties |
| 2005 | £89,101 | 15% |
82 Properties |
| 2004 | £75,572 | 20% |
89 Properties |
| 2003 | £60,189 | 29% |
104 Properties |
| 2002 | £42,958 | -9% |
91 Properties |
| 2001 | £46,727 | 13% |
70 Properties |
| 2000 | £40,609 | 9% |
71 Properties |
| 1999 | £36,944 | 4% |
59 Properties |
| 1998 | £35,608 | 0,3% |
61 Properties |
| 1997 | £35,500 | 5% |
47 Properties |
| 1996 | £33,787 | -19% |
29 Properties |
| 1995 | £40,298 | - |
46 Properties |
Property Price per Property Type in Hensingham
Here you can find historic sold price data in order to help with your property search.
The average Property Paid Price for specific property types in the last three years are:
| Property Type | Average Sold Price | Sold Properties |
|---|---|---|
| Semi Detached House | £127,523.00 | 101 Semi Detached Houses |
| Detached House | £290,500.00 | 18 Detached Houses |
| Terraced House | £111,870.00 | 67 Terraced Houses |
| Flat | £138,666.00 | 3 Flats |

