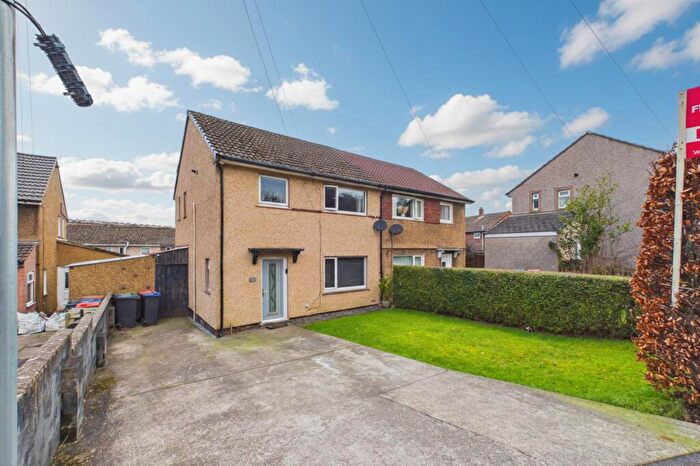
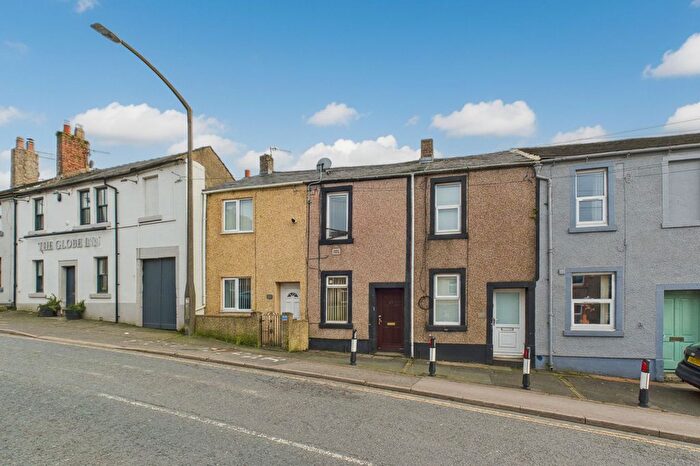
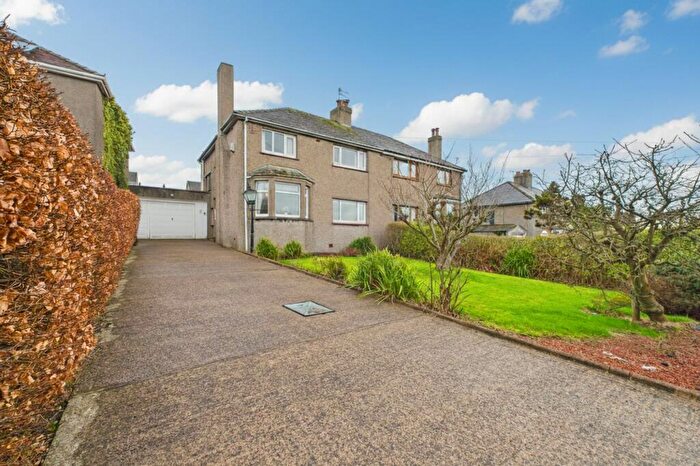
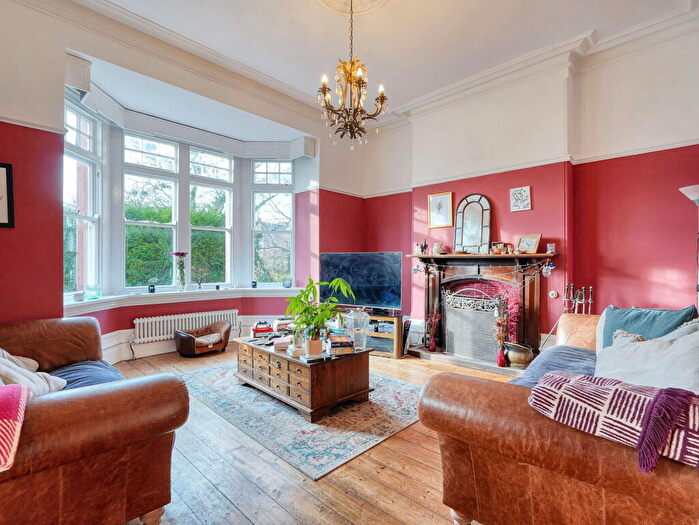
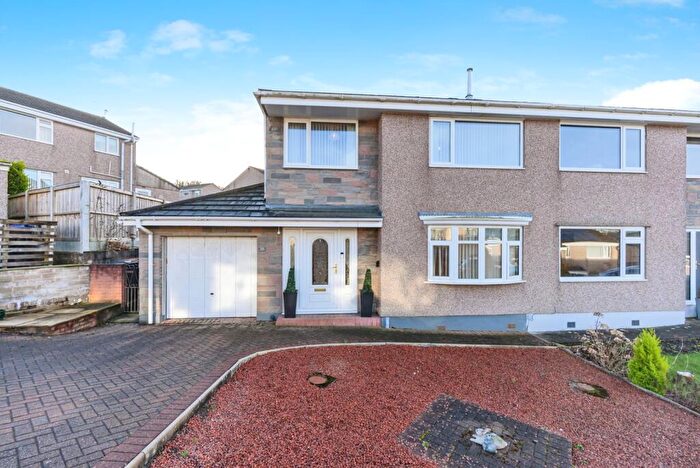
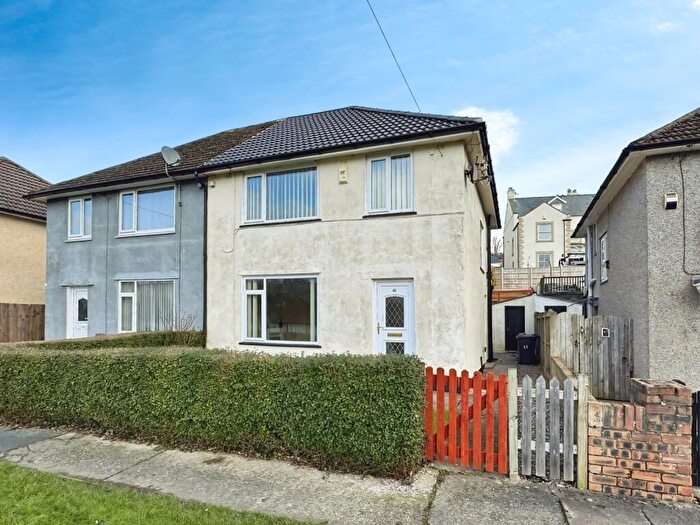
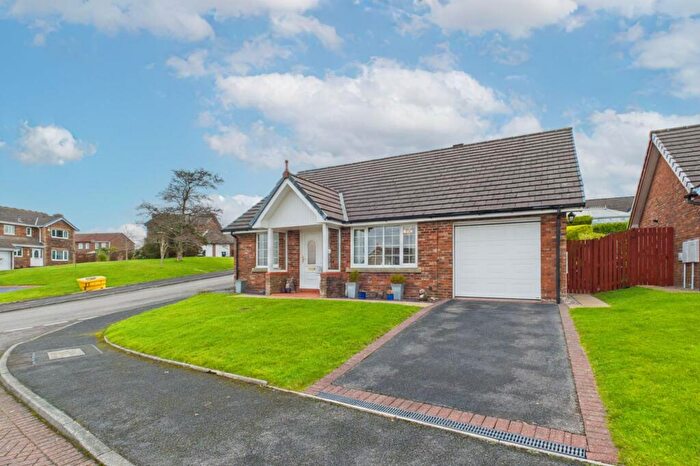
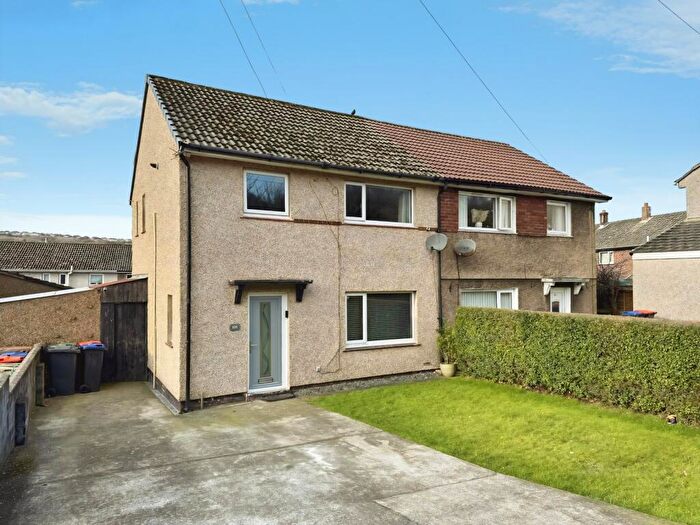
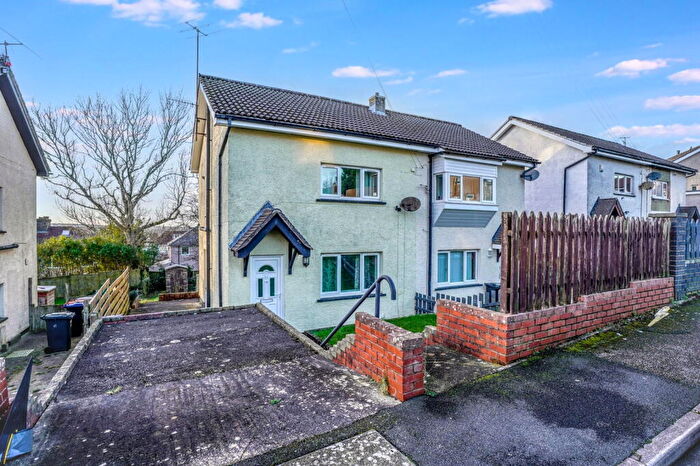
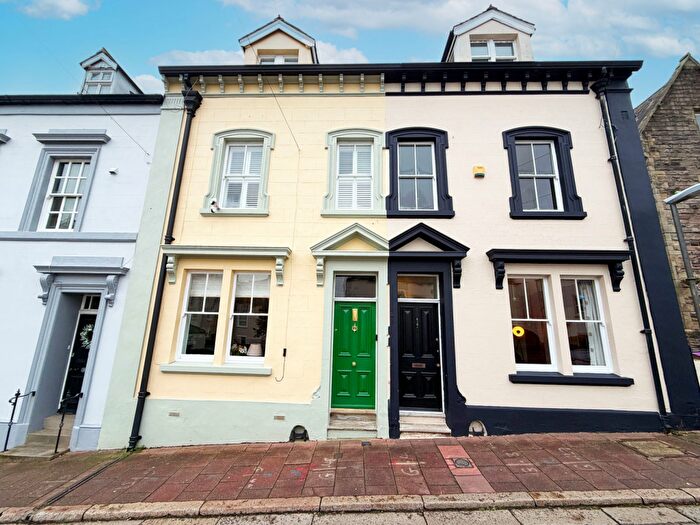
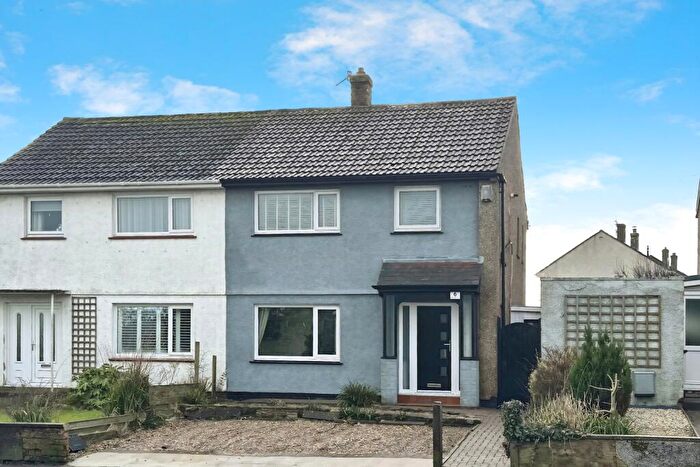
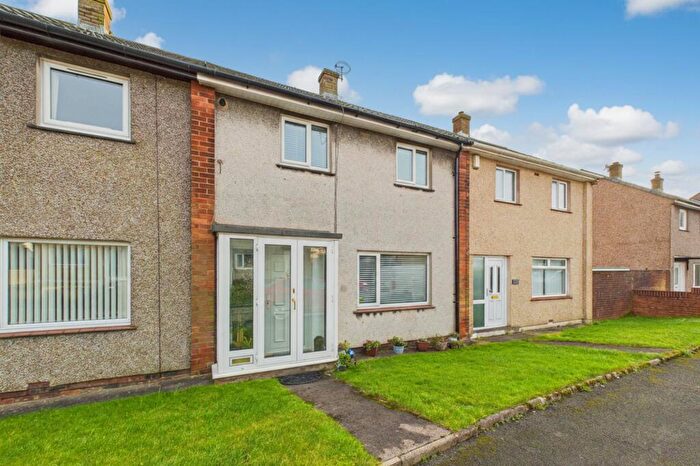
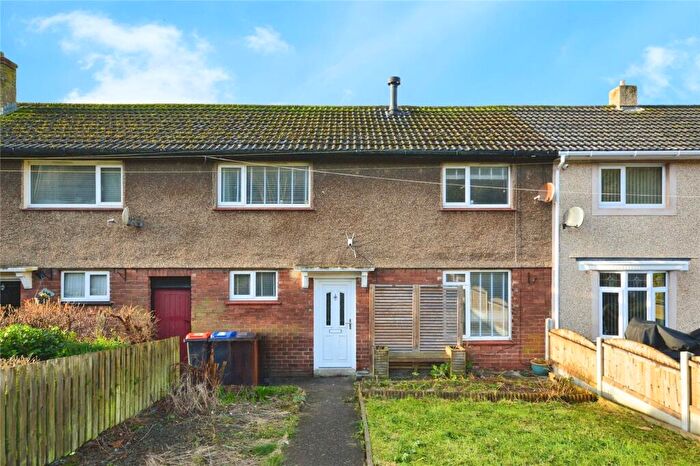
Houses for sale & to rent in Hillcrest, Whitehaven
House Prices in Hillcrest
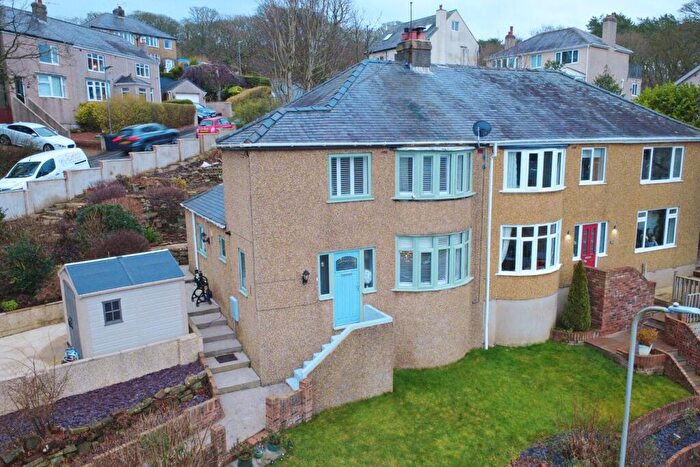
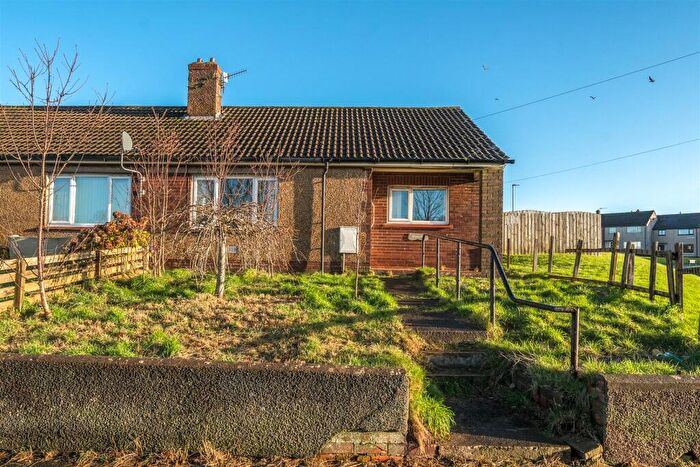
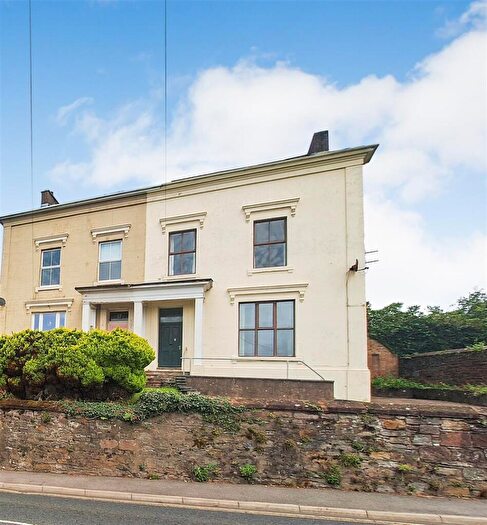
Properties in Hillcrest have an average house price of £198,605.00 and had 123 Property Transactions within the last 3 years¹.
Hillcrest is an area in Whitehaven, Cumbria with 1,073 households², where the most expensive property was sold for £440,000.00.
Properties for sale in Hillcrest
Roads and Postcodes in Hillcrest
Navigate through our locations to find the location of your next house in Hillcrest, Whitehaven for sale or to rent.
| Streets | Postcodes |
|---|---|
| Ashleigh Place | CA28 6TP |
| Balmoral Road | CA28 6UT CA28 6UY CA28 6UZ CA28 6XA |
| Beck Side | CA28 6UE |
| Chatsworth Drive | CA28 6XU |
| Cleator Moor Road | CA28 8RW CA28 8TX CA28 8TY |
| Cross Lane | CA28 6TW |
| Gill Close | CA28 6UQ |
| Greenlands Avenue | CA28 6TY CA28 6TZ |
| Greenlands Close | CA28 6UH |
| Headlands Drive | CA28 6SR |
| Hensingham Road | CA28 8PR CA28 8PS |
| High Grove | CA28 6TA |
| Highfields | CA28 6TH CA28 6TN CA28 6TQ CA28 6TS |
| Highfields Court | CA28 6TR |
| Hillcrest Avenue | CA28 6SS CA28 6ST CA28 6SU |
| Jericho Road | CA28 6UB |
| Lansdowne Grove | CA28 6TD |
| Loop Road South | CA28 7TN CA28 7TW |
| Main Street | CA28 6XD CA28 8TP |
| Moresby Parks | CA28 8XT |
| Moresby Road | CA28 8TS CA28 8TU |
| Oakfield Court | CA28 6TG |
| Red Lonning Industrial Estate | CA28 6SJ |
| Ribton Moorside | CA28 8PU |
| Ruskin Drive | CA28 6SZ CA28 6TB CA28 6TE |
| Sandhurst Drive | CA28 6XX |
| Sandringham Avenue | CA28 6XL |
| Sea View Drive | CA28 6TL |
| Springbank | CA28 6TX |
| Springfield Avenue | CA28 6TT |
| Springfield Grove | CA28 6UD |
| Standings Rise | CA28 6SX CA28 6SY |
| The Crest | CA28 6TJ |
| The Grange | CA28 6RP |
| Thornton Road | CA28 6UG CA28 6UP CA28 6UR |
| Winchester Drive | CA28 6XS CA28 6XT |
| Windsor Court | CA28 6UU CA28 6UX |
| Woodlands Avenue | CA28 6TF |
| Woodside Close | CA28 6TU |
| Wordsworth Road | CA28 6UA |
| Yew Bank Lane | CA28 6UF |
| CA28 6XR CA28 8UD CA28 8UG CA28 8UQ CA28 8YU |
Transport near Hillcrest
- FAQ
- Price Paid By Year
- Property Type Price
Frequently asked questions about Hillcrest
What is the average price for a property for sale in Hillcrest?
The average price for a property for sale in Hillcrest is £198,605. This amount is 25% higher than the average price in Whitehaven. There are 795 property listings for sale in Hillcrest.
What streets have the most expensive properties for sale in Hillcrest?
The streets with the most expensive properties for sale in Hillcrest are The Grange at an average of £385,000, Standings Rise at an average of £278,325 and Ruskin Drive at an average of £271,000.
What streets have the most affordable properties for sale in Hillcrest?
The streets with the most affordable properties for sale in Hillcrest are Greenlands Close at an average of £75,250, Springfield Grove at an average of £133,166 and Sandringham Avenue at an average of £148,500.
Which train stations are available in or near Hillcrest?
Some of the train stations available in or near Hillcrest are Corkickle, Whitehaven and Parton.
Property Price Paid in Hillcrest by Year
The average sold property price by year was:
| Year | Average Sold Price | Price Change |
Sold Properties
|
|---|---|---|---|
| 2025 | £197,011 | 3% |
35 Properties |
| 2024 | £191,414 | -10% |
53 Properties |
| 2023 | £211,088 | 12% |
35 Properties |
| 2022 | £184,917 | 10% |
39 Properties |
| 2021 | £166,842 | -10% |
64 Properties |
| 2020 | £182,785 | 5% |
48 Properties |
| 2019 | £173,690 | 8% |
48 Properties |
| 2018 | £159,102 | -0,4% |
45 Properties |
| 2017 | £159,745 | 3% |
47 Properties |
| 2016 | £155,556 | 6% |
39 Properties |
| 2015 | £145,497 | -5% |
44 Properties |
| 2014 | £153,161 | 8% |
34 Properties |
| 2013 | £141,548 | -2% |
35 Properties |
| 2012 | £144,604 | -5% |
33 Properties |
| 2011 | £152,234 | -0,2% |
38 Properties |
| 2010 | £152,594 | 13% |
29 Properties |
| 2009 | £133,217 | -15% |
23 Properties |
| 2008 | £153,122 | 5% |
24 Properties |
| 2007 | £144,812 | 13% |
70 Properties |
| 2006 | £125,519 | -3% |
53 Properties |
| 2005 | £128,678 | 15% |
57 Properties |
| 2004 | £109,098 | 25% |
47 Properties |
| 2003 | £82,147 | 16% |
53 Properties |
| 2002 | £69,392 | 13% |
70 Properties |
| 2001 | £60,240 | 5% |
66 Properties |
| 2000 | £57,282 | 1% |
53 Properties |
| 1999 | £56,931 | 7% |
69 Properties |
| 1998 | £52,761 | 5% |
59 Properties |
| 1997 | £49,929 | 0,4% |
64 Properties |
| 1996 | £49,722 | 5% |
59 Properties |
| 1995 | £47,382 | - |
41 Properties |
Property Price per Property Type in Hillcrest
Here you can find historic sold price data in order to help with your property search.
The average Property Paid Price for specific property types in the last three years are:
| Property Type | Average Sold Price | Sold Properties |
|---|---|---|
| Semi Detached House | £191,901.00 | 77 Semi Detached Houses |
| Detached House | £257,203.00 | 26 Detached Houses |
| Terraced House | £148,235.00 | 20 Terraced Houses |

