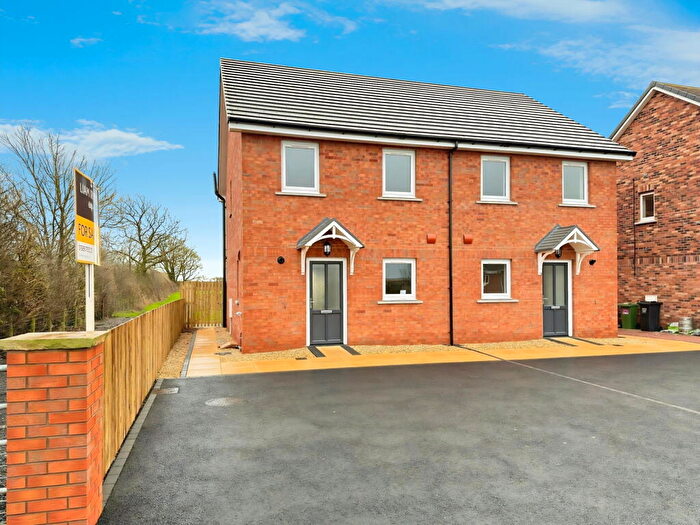
Houses for sale & to rent in Silloth, Wigton
House Prices in Silloth
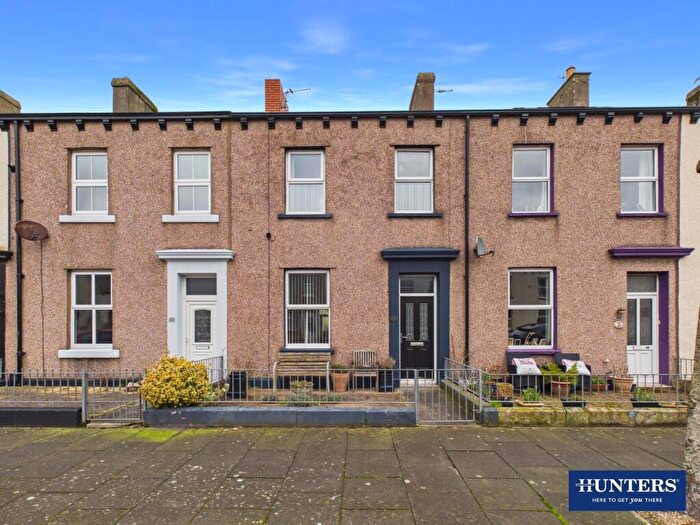
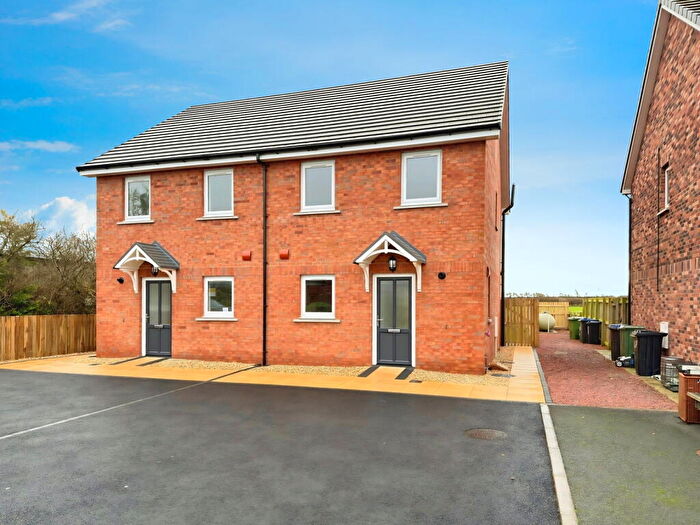
Properties in Silloth have an average house price of £183,968.00 and had 137 Property Transactions within the last 3 years¹.
Silloth is an area in Wigton, Cumbria with 1,338 households², where the most expensive property was sold for £500,000.00.
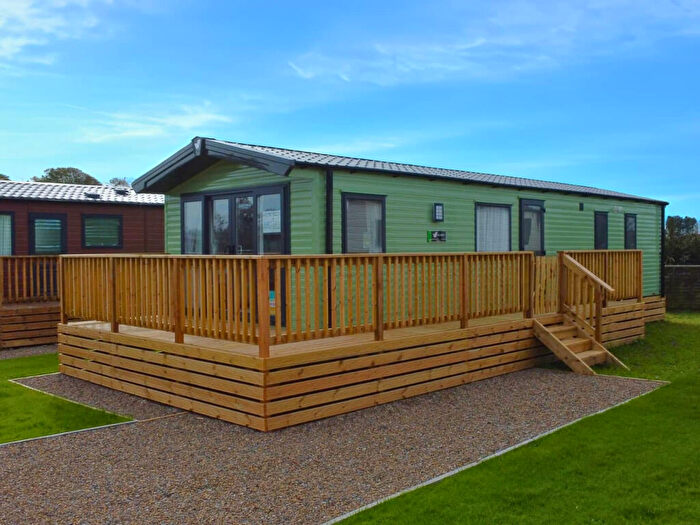
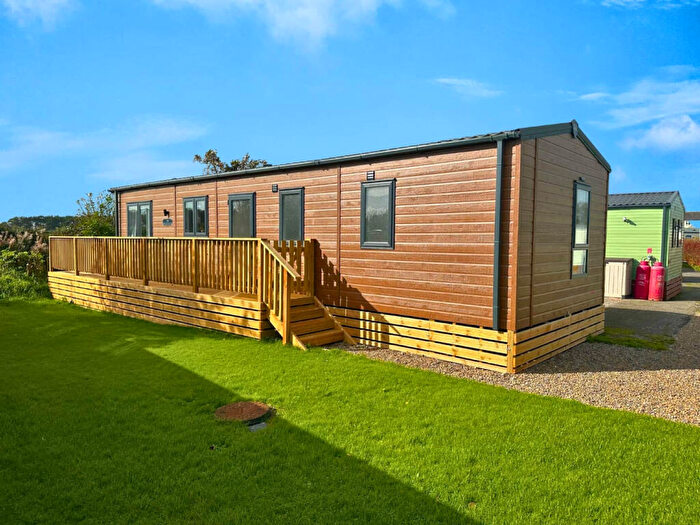
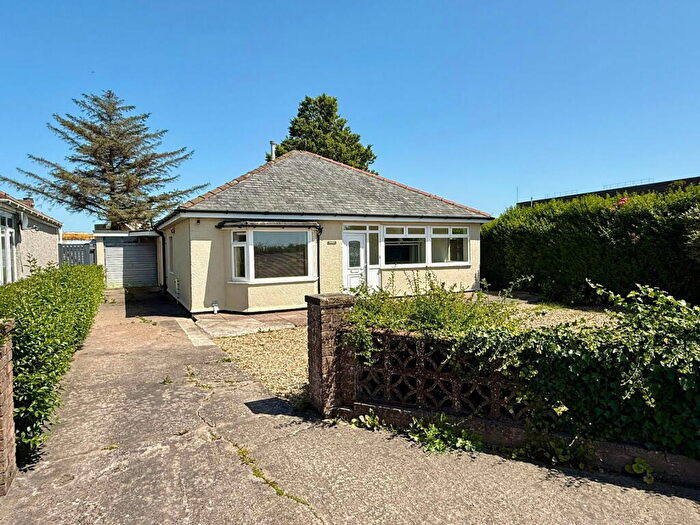
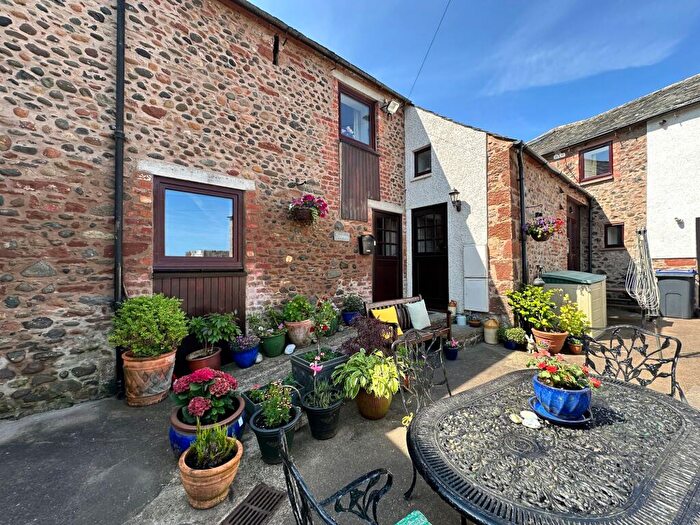
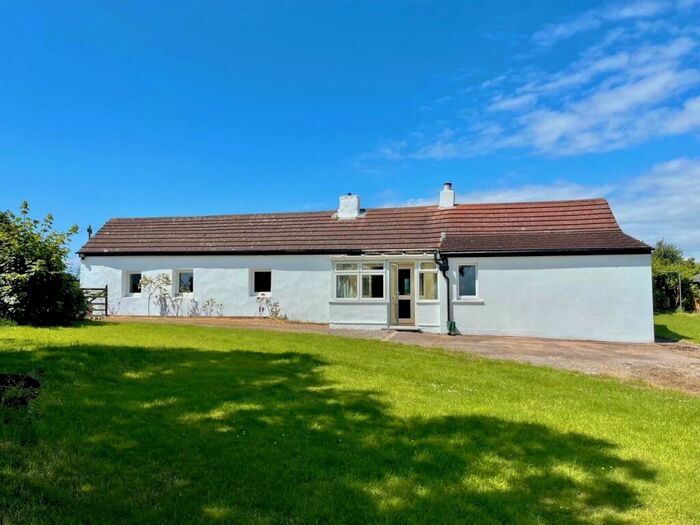
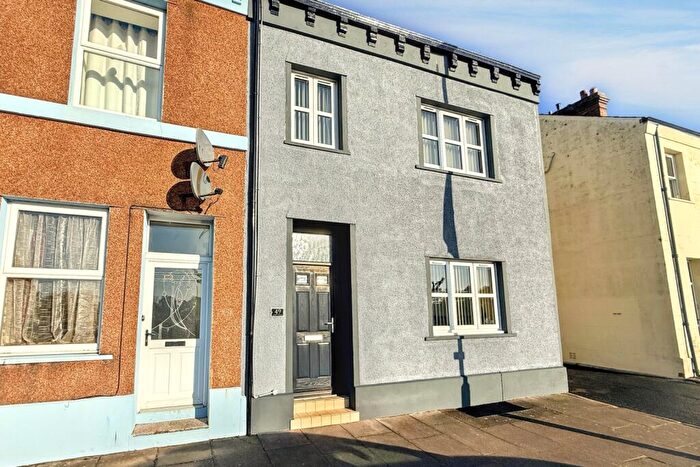
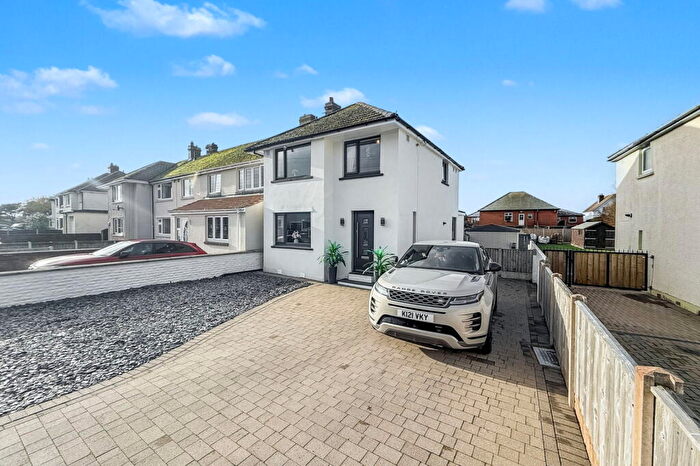
Properties for sale in Silloth
Previously listed properties in Silloth
Roads and Postcodes in Silloth
Navigate through our locations to find the location of your next house in Silloth, Wigton for sale or to rent.
| Streets | Postcodes |
|---|---|
| Acre Bank Close | CA7 4RD |
| Alma Terrace | CA7 4DS |
| Barracks Bridge | CA7 4NR |
| Beaconsfield Terrace | CA7 4HE |
| Blackdyke | CA7 4PL |
| Blitterlees | CA7 4JJ CA7 4JN CA7 4JR CA7 4JT |
| Bridge View | CA7 4AP |
| Burnswark Terrace | CA7 4EF |
| Caldew Street | CA7 4BY CA7 4EL |
| Calvo | CA7 4PJ |
| Causewayhead | CA7 4JG CA7 4PB CA7 4PE |
| Central Terrace | CA7 4BP |
| Church Terrace | CA7 4BX |
| Criffel Street | CA7 4BT |
| Derwent Terrace | CA7 4EN |
| Dicktrod Lane | CA7 4QP CA7 4QZ |
| Eden Street | CA7 4AD CA7 4AS |
| Esk Street | CA7 4BU CA7 4EW |
| Fell View | CA7 4DJ |
| Golf Terrace | CA7 4HN |
| Golf Villas | CA7 4HJ |
| Greenrow | CA7 4HS |
| Greenrow Bungalows | CA7 4HR |
| Greenrow Meadows | CA7 4HY |
| Greenrow Terrace | CA7 4JD |
| Grune Point Close | CA7 4QX |
| Holliday Crescent | CA7 4HW |
| Hylton Terrace | CA7 4DZ |
| Latrigg Street | CA7 4EJ |
| Lawn Terrace | CA7 4AW |
| Links Close | CA7 4ES |
| Marine Terrace | CA7 4BZ |
| Mary Street | CA7 4EH |
| Moricambe Park | CA7 4RB |
| New Street | CA7 4AT |
| Osborne Terrace | CA7 4HG |
| Park Terrace | CA7 4DQ |
| Petteril Street | CA7 4DH |
| Petteril Terrace | CA7 4DN |
| Pine Terrace | CA7 4DT |
| Prospect Place | CA7 4HQ |
| Raglans Court | CA7 4BW |
| Red Gables | CA7 4HU |
| Roddan Terrace | CA7 4HD |
| Ryehills Road | CA7 4QT |
| Seaville | CA7 4PT |
| Skiddaw Street | CA7 4AU CA7 4EP |
| Skinburness Court | CA7 4QN |
| Skinburness Crescent | CA7 4QL |
| Skinburness Drive | CA7 4QG |
| Skinburness Road | CA7 4QE CA7 4QF CA7 4QH CA7 4QS CA7 4QU |
| Solway Street | CA7 4AR CA7 4EB CA7 4EG CA7 4EQ |
| Station Mews | CA7 4AF |
| Station Road | CA7 4AE CA7 4BL |
| The Crofts | CA7 4ET CA7 4EU CA7 4EX CA7 4EY CA7 4EZ CA7 4HA CA7 4HB |
| The Lido Village | CA7 4NN |
| Wampool Street | CA7 4AA CA7 4BN CA7 4BS |
| Waver Court | CA7 4ED |
| Waver Street | CA7 4DF CA7 4DG |
| Wigton Road | CA7 4EA CA7 4NJ |
| CA7 4DU CA7 4LW CA7 4PH CA7 4PQ CA7 4PZ CA7 4QY CA7 4RA |
Transport near Silloth
- FAQ
- Price Paid By Year
- Property Type Price
Frequently asked questions about Silloth
What is the average price for a property for sale in Silloth?
The average price for a property for sale in Silloth is £183,968. This amount is 13% lower than the average price in Wigton. There are 819 property listings for sale in Silloth.
What streets have the most expensive properties for sale in Silloth?
The streets with the most expensive properties for sale in Silloth are Pine Terrace at an average of £340,000, Ryehills Road at an average of £337,500 and Greenrow Terrace at an average of £330,000.
What streets have the most affordable properties for sale in Silloth?
The streets with the most affordable properties for sale in Silloth are Waver Court at an average of £79,000, Mary Street at an average of £90,000 and Prospect Place at an average of £95,000.
Which train stations are available in or near Silloth?
Some of the train stations available in or near Silloth are Aspatria, Wigton and Annan.
Property Price Paid in Silloth by Year
The average sold property price by year was:
| Year | Average Sold Price | Price Change |
Sold Properties
|
|---|---|---|---|
| 2025 | £209,533 | 15% |
45 Properties |
| 2024 | £178,550 | 10% |
54 Properties |
| 2023 | £161,394 | -7% |
38 Properties |
| 2022 | £172,012 | 12% |
45 Properties |
| 2021 | £151,924 | -13% |
56 Properties |
| 2020 | £172,010 | 10% |
48 Properties |
| 2019 | £155,069 | 10% |
51 Properties |
| 2018 | £139,054 | -3% |
55 Properties |
| 2017 | £143,085 | 13% |
57 Properties |
| 2016 | £123,818 | 2% |
48 Properties |
| 2015 | £120,985 | 1% |
62 Properties |
| 2014 | £119,774 | -9% |
56 Properties |
| 2013 | £129,979 | -2% |
43 Properties |
| 2012 | £132,920 | 3% |
25 Properties |
| 2011 | £129,259 | 9% |
48 Properties |
| 2010 | £118,195 | -13% |
41 Properties |
| 2009 | £133,896 | -6% |
28 Properties |
| 2008 | £142,505 | -8% |
34 Properties |
| 2007 | £154,063 | 9% |
79 Properties |
| 2006 | £139,670 | 12% |
79 Properties |
| 2005 | £122,597 | 22% |
64 Properties |
| 2004 | £95,153 | 21% |
54 Properties |
| 2003 | £75,518 | 2% |
74 Properties |
| 2002 | £74,020 | 14% |
67 Properties |
| 2001 | £63,753 | 27% |
72 Properties |
| 2000 | £46,491 | -3% |
64 Properties |
| 1999 | £47,980 | -0,5% |
55 Properties |
| 1998 | £48,203 | -0,5% |
65 Properties |
| 1997 | £48,431 | 19% |
72 Properties |
| 1996 | £39,003 | -13% |
63 Properties |
| 1995 | £43,954 | - |
53 Properties |
Property Price per Property Type in Silloth
Here you can find historic sold price data in order to help with your property search.
The average Property Paid Price for specific property types in the last three years are:
| Property Type | Average Sold Price | Sold Properties |
|---|---|---|
| Semi Detached House | £162,398.00 | 27 Semi Detached Houses |
| Detached House | £260,738.00 | 42 Detached Houses |
| Terraced House | £146,476.00 | 65 Terraced Houses |
| Flat | £115,666.00 | 3 Flats |

