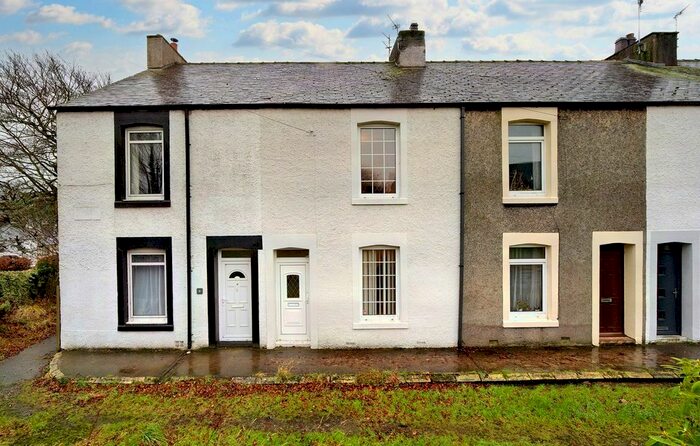
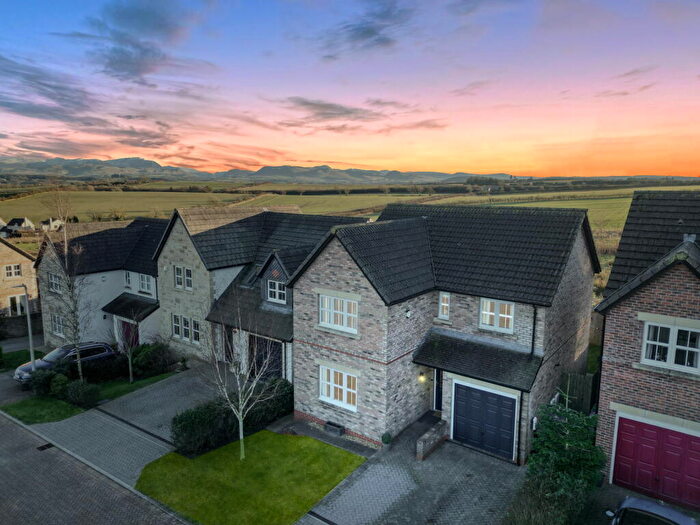
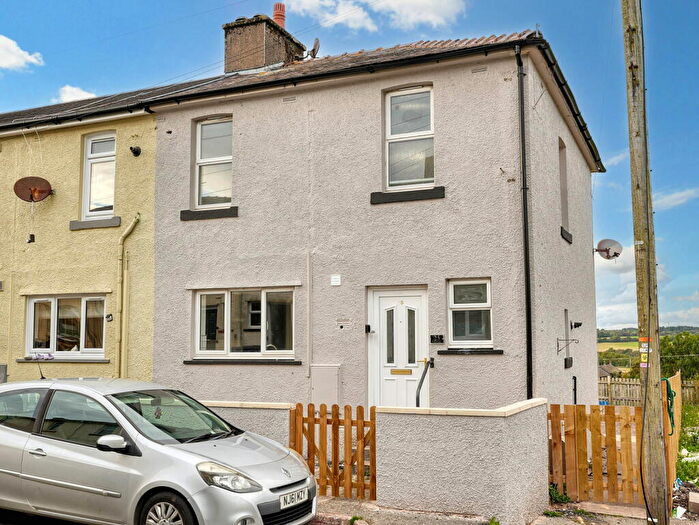
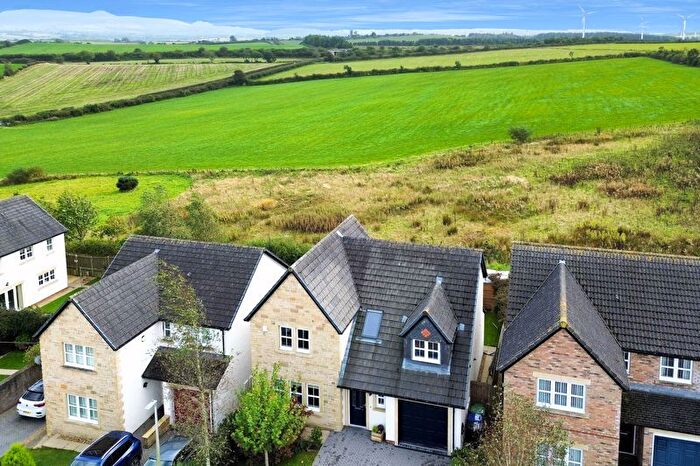
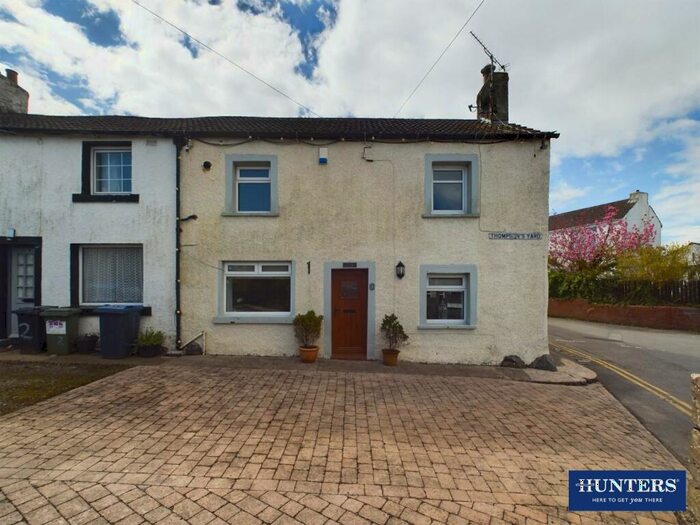
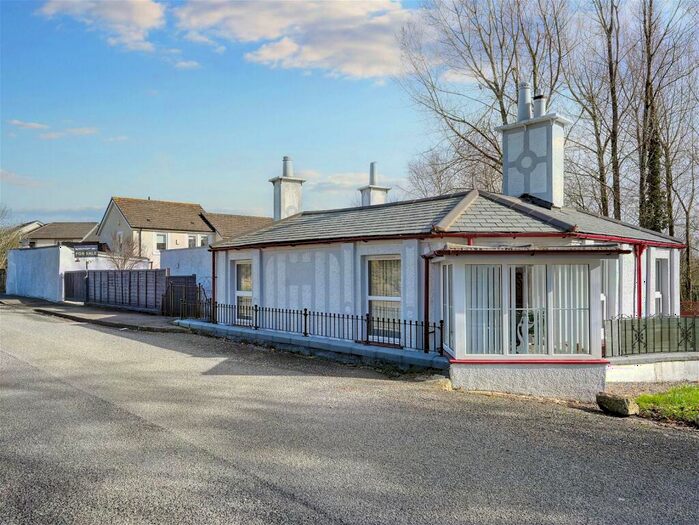
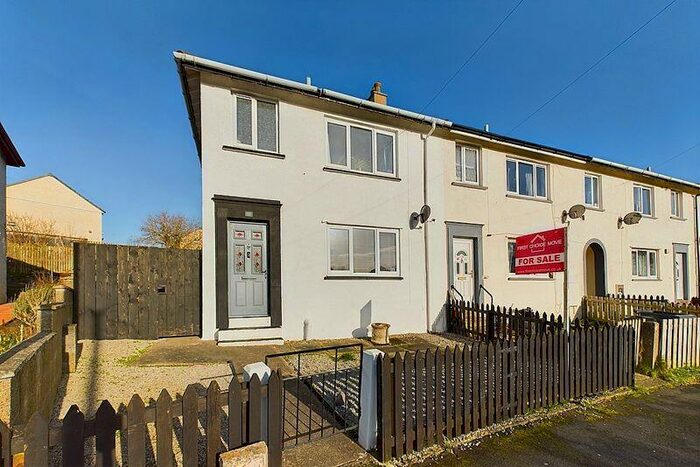
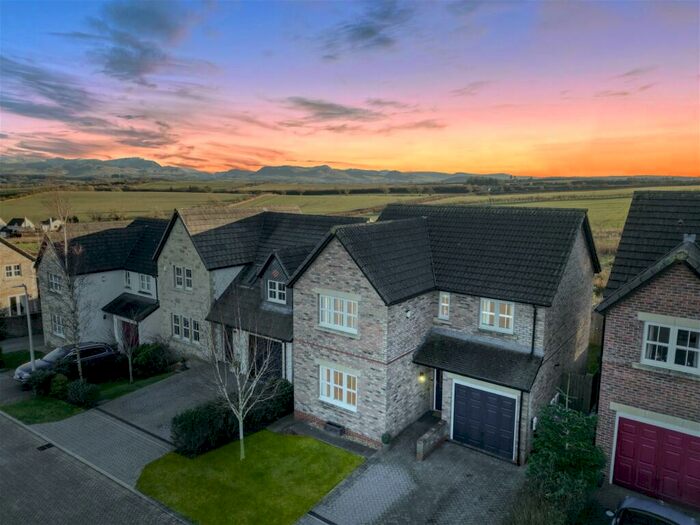
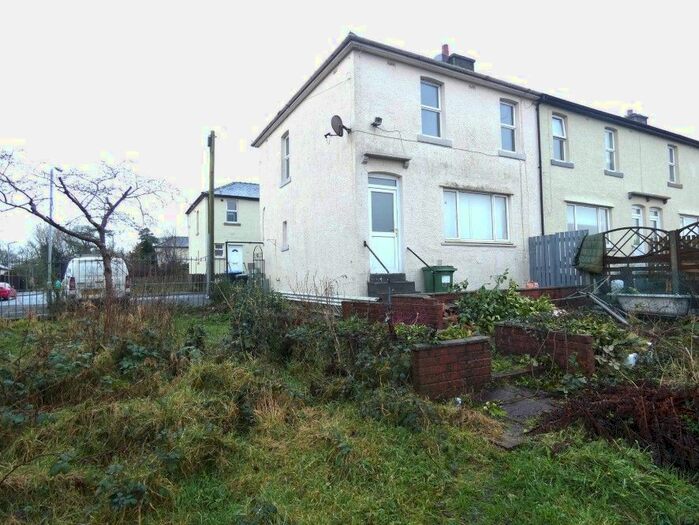
Houses for sale & to rent in Clifton, Workington
House Prices in Clifton
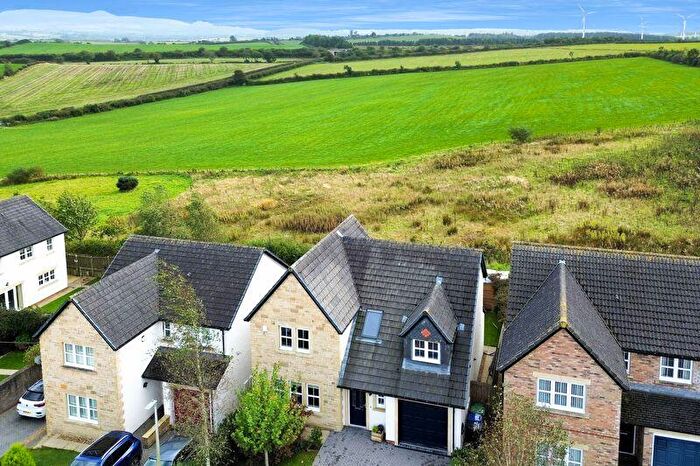
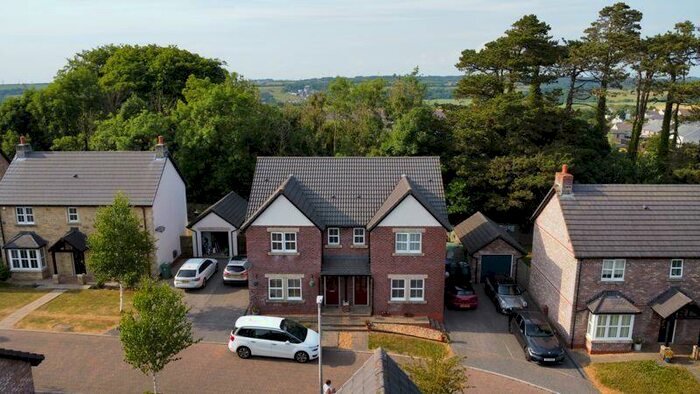
Properties in Clifton have an average house price of £178,266.00 and had 67 Property Transactions within the last 3 years¹.
Clifton is an area in Workington, Cumbria with 647 households², where the most expensive property was sold for £399,950.00.
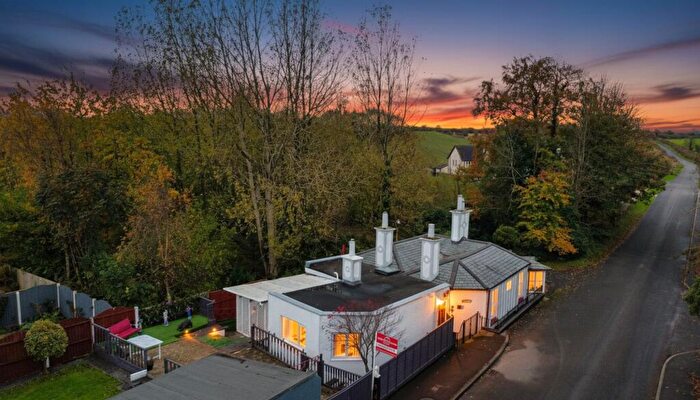
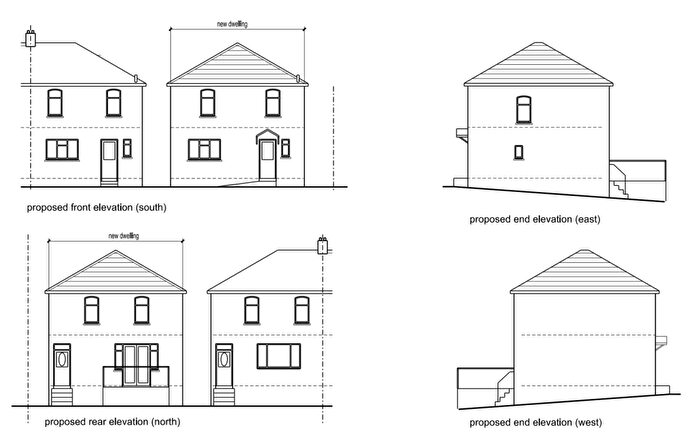
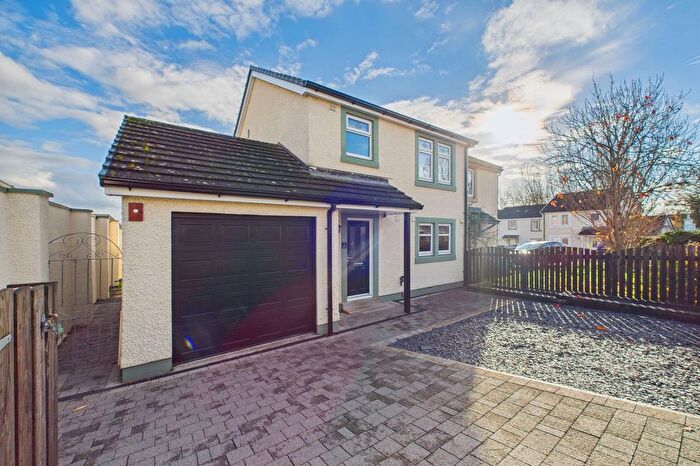
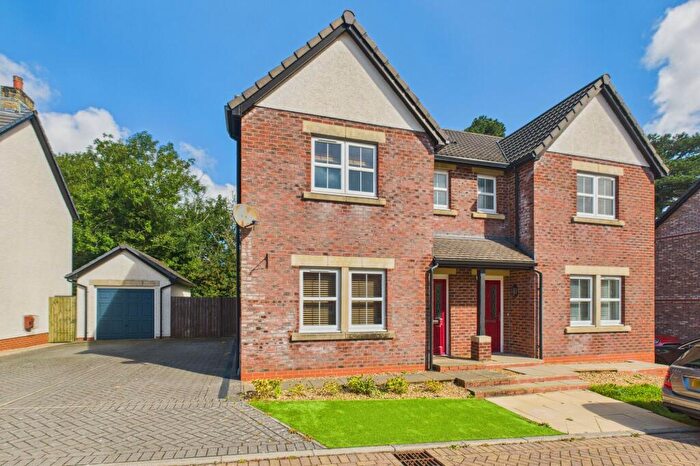
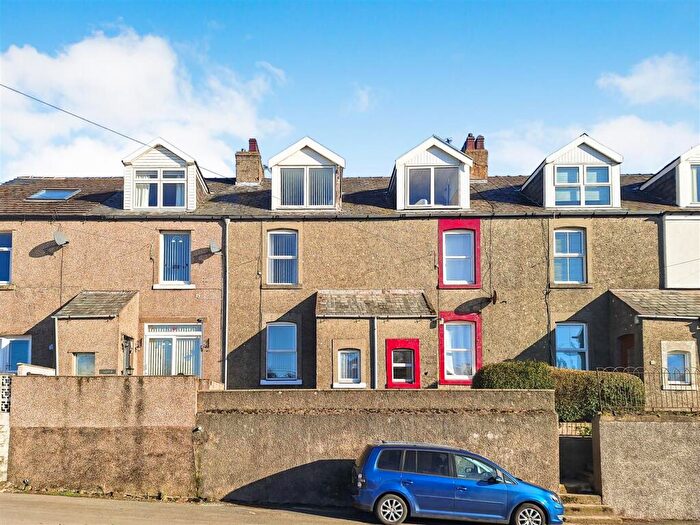
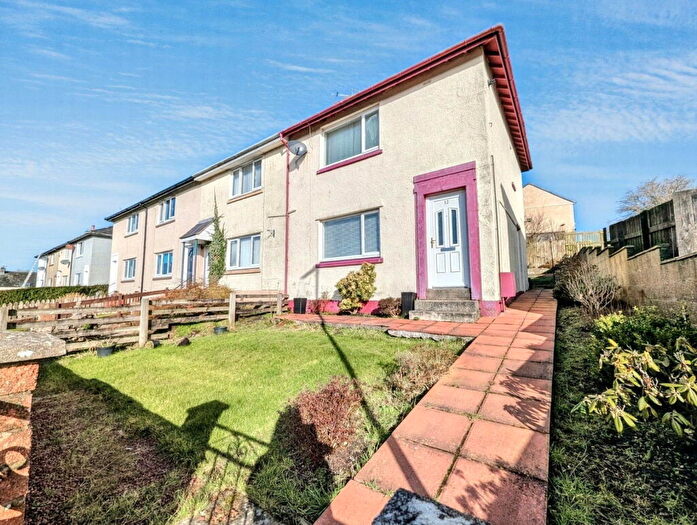
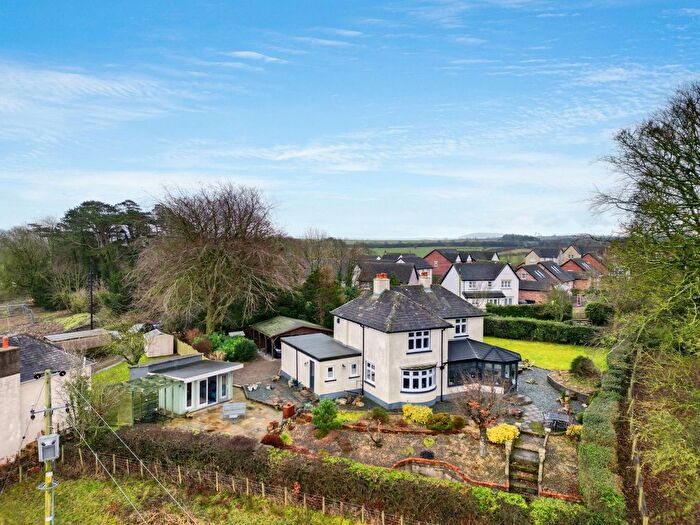
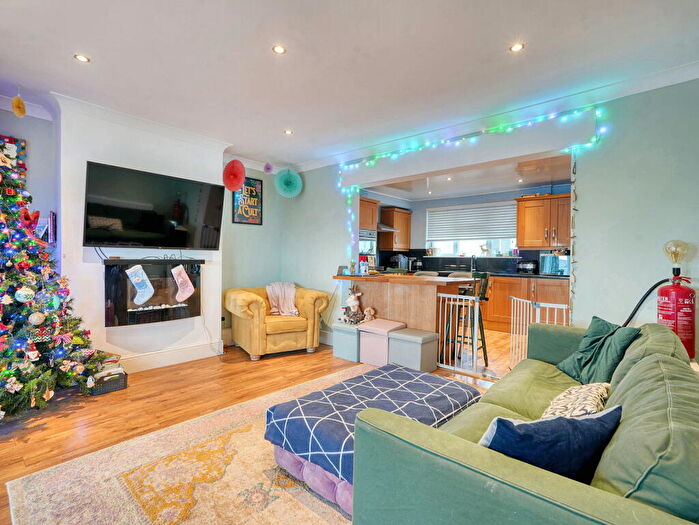
Properties for sale in Clifton
Previously listed properties in Clifton
Roads and Postcodes in Clifton
Navigate through our locations to find the location of your next house in Clifton, Workington for sale or to rent.
| Streets | Postcodes |
|---|---|
| Abbott Wood | CA14 1TP CA14 1TW |
| Bowflatts | CA14 1TA CA14 1TB CA14 1TD |
| Carter Garth | CA14 1UA |
| Catbank | CA14 1YB |
| Chapel Brow | CA14 1XT |
| Chapel Terrace | CA14 1XU |
| Cinder Hill | CA14 1YU |
| Clifton Gardens | CA14 1TT |
| Clifton Green | CA14 1ZB |
| Clifton Hall Close | CA14 1SJ |
| Clifton Lodge | CA14 1UR CA14 1UT CA14 1UW |
| Dalzell Gardens | CA14 1SU |
| Fell View | CA14 1YL |
| Gatehead | CA14 1TN |
| Gaythorne Terrace | CA14 1YT |
| Greengarth | CA14 1TH CA14 1TL CA14 1TQ |
| Hall Garth | CA14 1UN |
| Hall Lodge Lane | CA14 1SE |
| Hunterbank | CA14 1UD |
| Irving Vale | CA14 1TX |
| Kirkfoot | CA14 1XX |
| Lodge Close | CA14 1QD |
| Lostrigg Close | CA14 1WD |
| Mabel Wood Close | CA14 1BF |
| Main Road | CA14 1TR |
| Middlegate | CA14 1TU |
| Moor Road | CA14 1TS |
| Oak Drive | CA14 1WY |
| Oldfield Road | CA14 1YP |
| Pow Cottages | CA14 1TY |
| Riverside | CA14 1TE CA14 1TF CA14 1TG |
| Rosemary Gardens | CA14 1TZ |
| Rosemary Lane | CA14 1UE |
| Scotscroft | CA14 1YZ |
| Station Terrace | CA14 1YD |
| Stoneycroft | CA14 1UU CA14 1UX CA14 1UY CA14 1XA |
| Sycamore Garth | CA14 1WF |
| The Gavels | CA14 1XB CA14 1XD CA14 1XF |
| Thompsons Yard | CA14 1UJ |
| Underview | CA14 1XY |
| Valley View | CA14 1YS |
| William Street | CA14 1UH |
| Wilson Cottages | CA14 1YR |
| Winscales Road | CA14 1XS |
| CA14 1SQ CA14 1SX CA14 1YE CA14 1YF CA14 1YW CA14 1YX |
Transport near Clifton
- FAQ
- Price Paid By Year
- Property Type Price
Frequently asked questions about Clifton
What is the average price for a property for sale in Clifton?
The average price for a property for sale in Clifton is £178,266. This amount is 16% higher than the average price in Workington. There are 55 property listings for sale in Clifton.
What streets have the most expensive properties for sale in Clifton?
The streets with the most expensive properties for sale in Clifton are Lodge Close at an average of £354,975, Main Road at an average of £324,250 and Abbott Wood at an average of £280,000.
What streets have the most affordable properties for sale in Clifton?
The streets with the most affordable properties for sale in Clifton are Gatehead at an average of £83,833, Wilson Cottages at an average of £86,500 and Carter Garth at an average of £88,142.
Which train stations are available in or near Clifton?
Some of the train stations available in or near Clifton are Workington, Flimby and Harrington.
Property Price Paid in Clifton by Year
The average sold property price by year was:
| Year | Average Sold Price | Price Change |
Sold Properties
|
|---|---|---|---|
| 2025 | £179,394 | 9% |
19 Properties |
| 2024 | £164,123 | -16% |
23 Properties |
| 2023 | £190,420 | 8% |
25 Properties |
| 2022 | £174,720 | 9% |
20 Properties |
| 2021 | £159,159 | -9% |
22 Properties |
| 2020 | £174,075 | -8% |
26 Properties |
| 2019 | £188,657 | 13% |
19 Properties |
| 2018 | £163,581 | 27% |
24 Properties |
| 2017 | £119,062 | -68% |
23 Properties |
| 2016 | £199,978 | 14% |
37 Properties |
| 2015 | £172,601 | -5% |
44 Properties |
| 2014 | £180,968 | 6% |
30 Properties |
| 2013 | £169,494 | 0,5% |
62 Properties |
| 2012 | £168,681 | 25% |
11 Properties |
| 2011 | £127,078 | 8% |
16 Properties |
| 2010 | £117,487 | -21% |
20 Properties |
| 2009 | £142,687 | 3% |
8 Properties |
| 2008 | £138,772 | -2% |
20 Properties |
| 2007 | £141,967 | - |
26 Properties |
| 2006 | £141,975 | 16% |
43 Properties |
| 2005 | £119,709 | 24% |
32 Properties |
| 2004 | £90,596 | 39% |
34 Properties |
| 2003 | £54,963 | -6% |
18 Properties |
| 2002 | £58,341 | -5% |
36 Properties |
| 2001 | £61,000 | 28% |
16 Properties |
| 2000 | £43,875 | -28% |
11 Properties |
| 1999 | £56,247 | 24% |
19 Properties |
| 1998 | £43,020 | 4% |
16 Properties |
| 1997 | £41,375 | 18% |
16 Properties |
| 1996 | £34,125 | -18% |
12 Properties |
| 1995 | £40,208 | - |
12 Properties |
Property Price per Property Type in Clifton
Here you can find historic sold price data in order to help with your property search.
The average Property Paid Price for specific property types in the last three years are:
| Property Type | Average Sold Price | Sold Properties |
|---|---|---|
| Semi Detached House | £158,783.00 | 21 Semi Detached Houses |
| Detached House | £308,309.00 | 16 Detached Houses |
| Terraced House | £123,791.00 | 29 Terraced Houses |
| Flat | £86,500.00 | 1 Flat |

