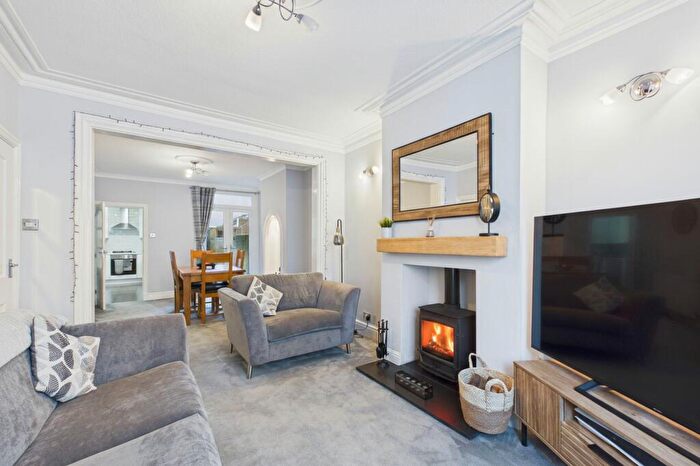
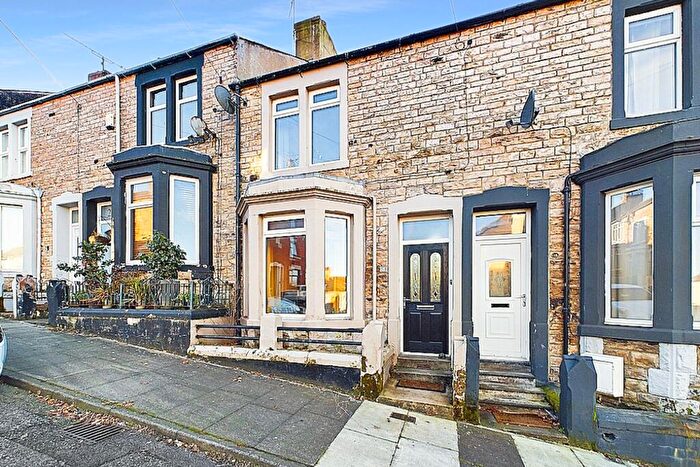
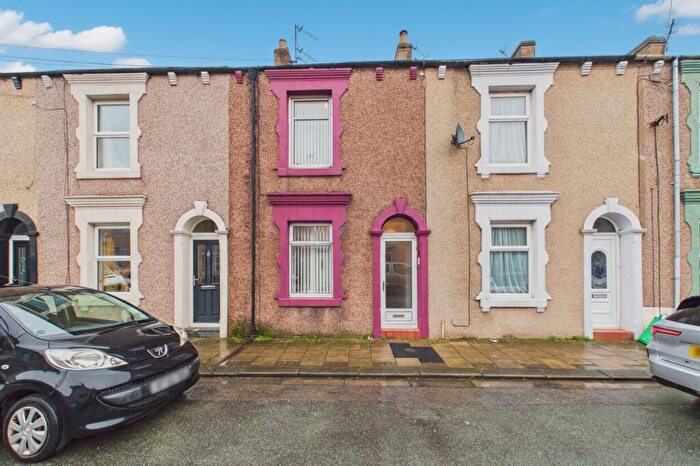
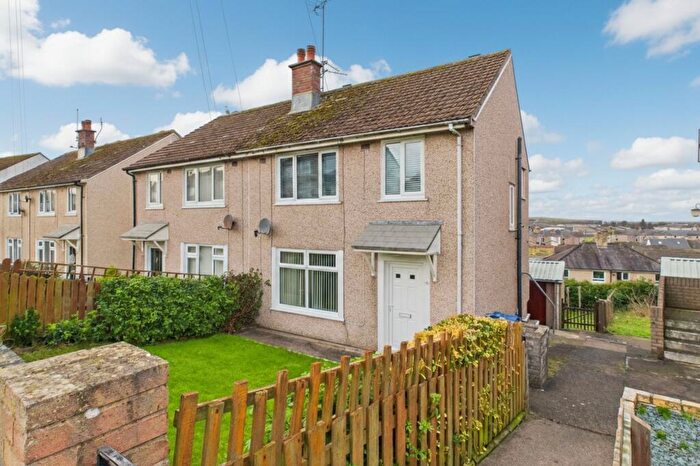
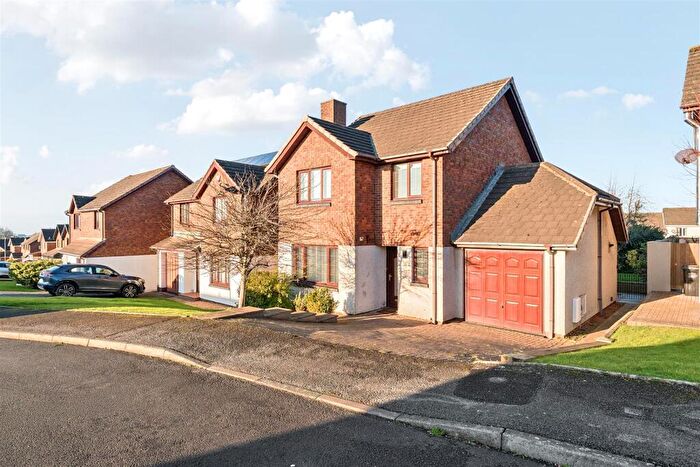
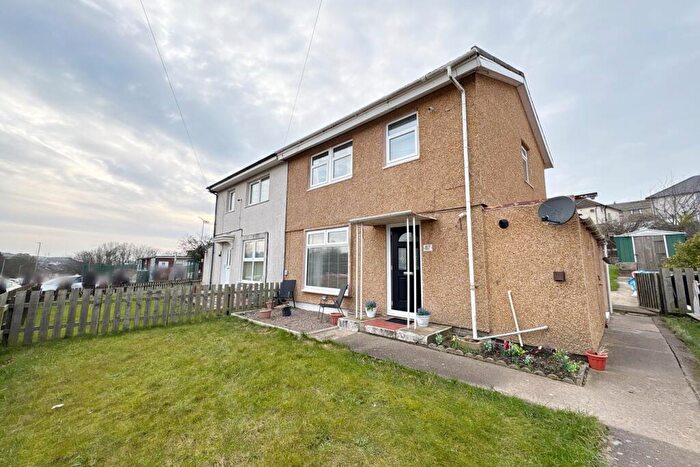
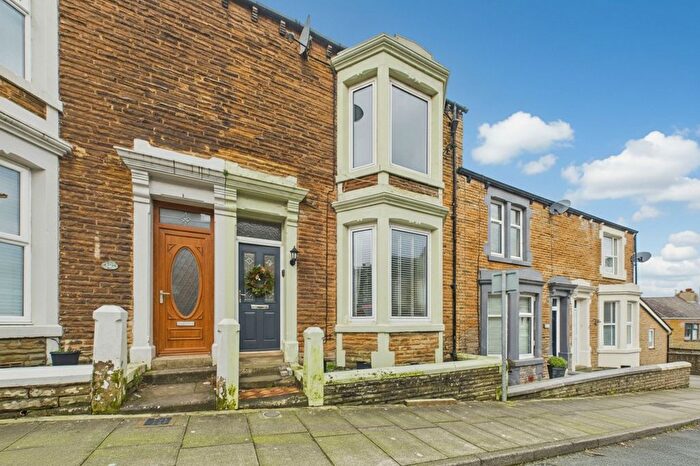
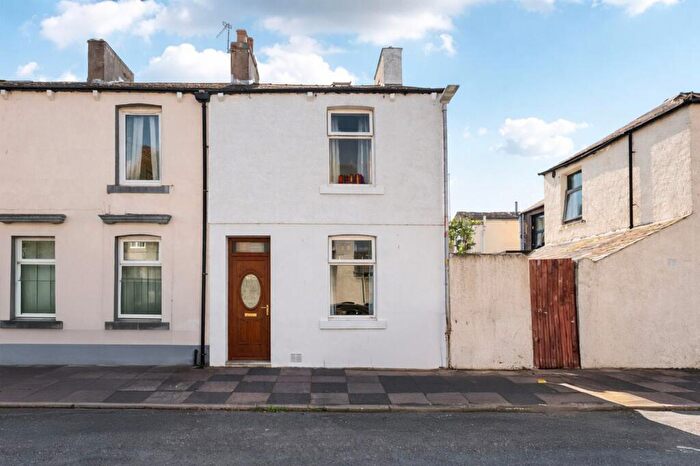
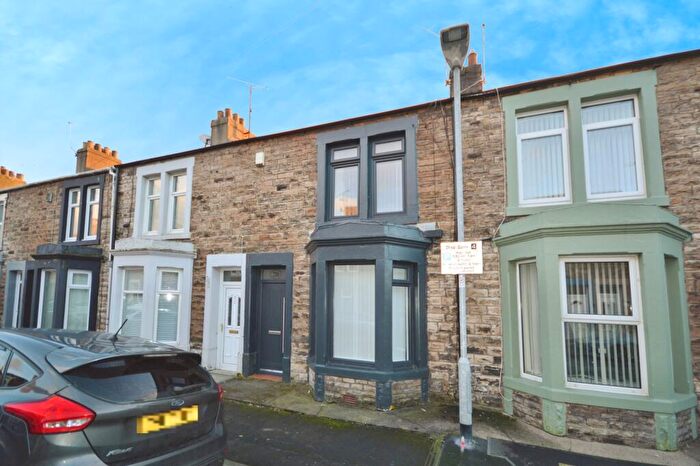
Houses for sale & to rent in Moorclose, Workington
House Prices in Moorclose
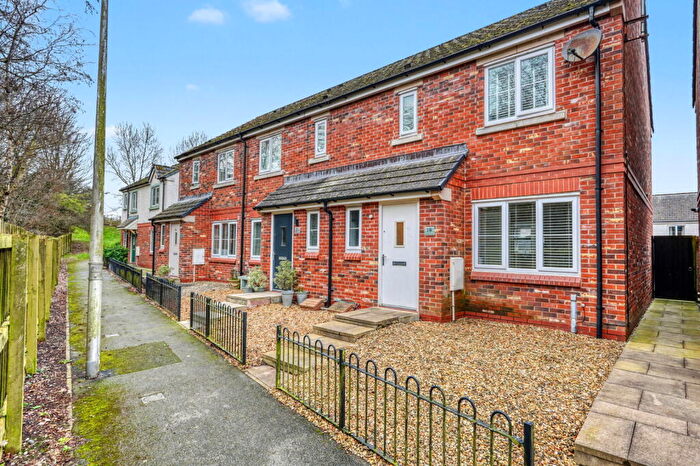
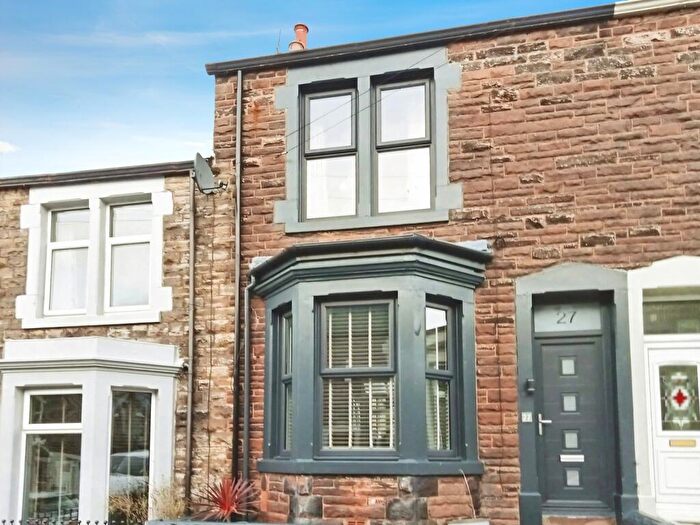
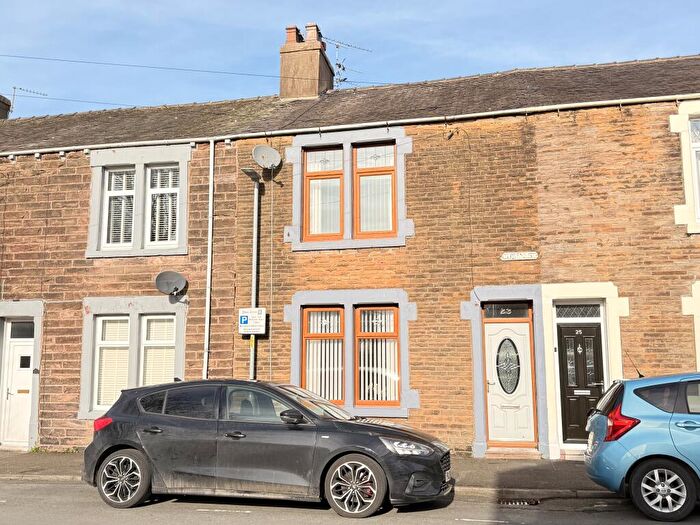
Properties in Moorclose have an average house price of £128,370.00 and had 99 Property Transactions within the last 3 years¹.
Moorclose is an area in Workington, Cumbria with 2,111 households², where the most expensive property was sold for £300,000.00.
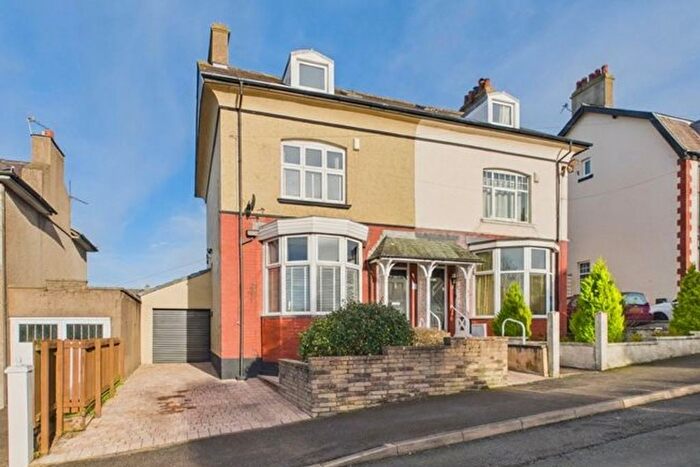
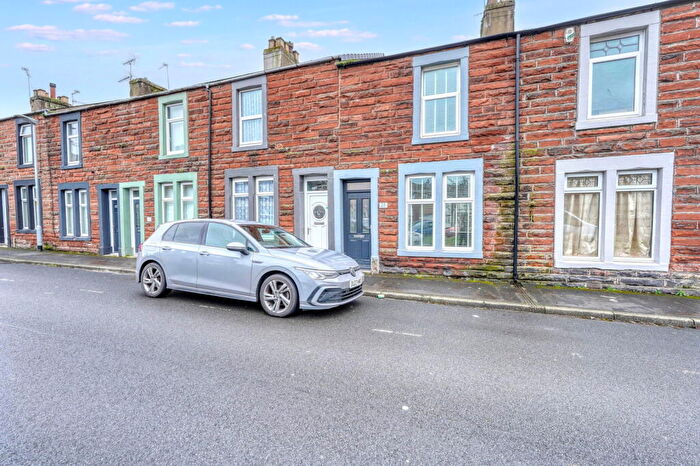
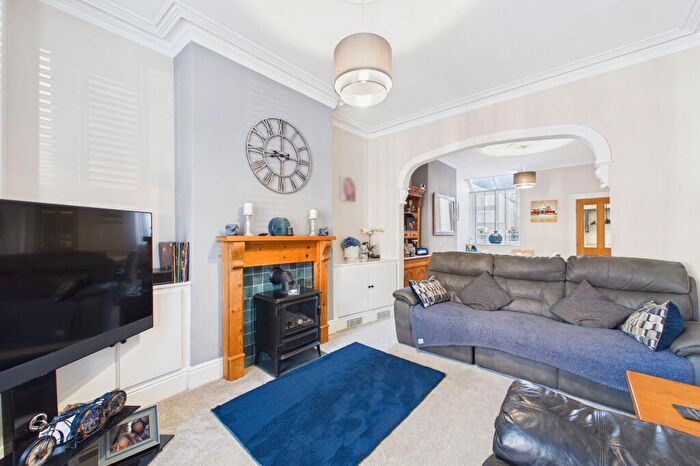
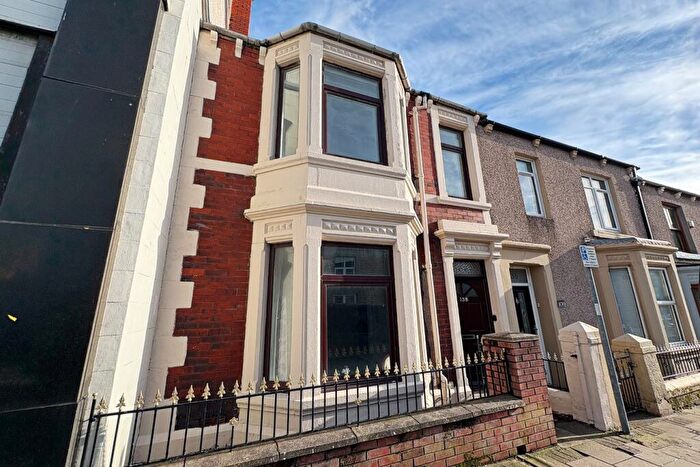
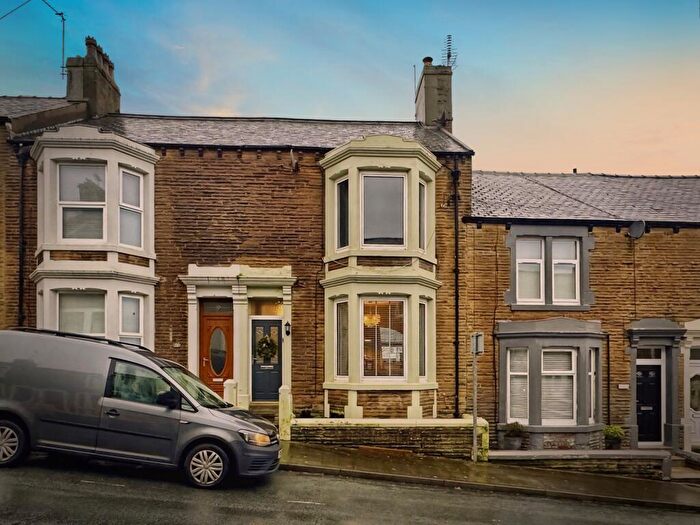
Properties for sale in Moorclose
Roads and Postcodes in Moorclose
Navigate through our locations to find the location of your next house in Moorclose, Workington for sale or to rent.
| Streets | Postcodes |
|---|---|
| Abbey Close | CA14 3PB |
| Alexander Close | CA14 3HQ |
| Beverley Close | CA14 3PW |
| Birch Close | CA14 3RY |
| Bowness Court | CA14 3SG |
| Calder Drive | CA14 3NZ |
| Carlisle Walk | CA14 3QA |
| Chaucer Road | CA14 4HP CA14 4HQ CA14 4HR |
| Cockfield Drive | CA14 5BL |
| Coniston Close | CA14 3PL |
| Coniston Crescent | CA14 3NN |
| Coniston Drive | CA14 3PH |
| Crosthwaite Court | CA14 3SQ |
| Derwent Avenue | CA14 3LX |
| Edinburgh Avenue | CA14 3NT CA14 3NU CA14 3NY CA14 3PR |
| Elterwater Avenue | CA14 3JY CA14 3JZ CA14 3LD CA14 3LE |
| Ely Close | CA14 3PP |
| Eskdale Crescent | CA14 3LJ CA14 3LQ |
| Everest Mount | CA14 5BY |
| Fell View Walk | CA14 5BE |
| Fountains Avenue | CA14 3QG |
| Furness Road | CA14 3PA CA14 3QF CA14 3QJ |
| Garth Road | CA14 5AQ |
| Ghyll Road | CA14 5AL |
| Glen Road | CA14 3RU |
| Grasmere Avenue | CA14 3LN CA14 3LP CA14 3LR CA14 3LS CA14 3LU CA14 3LY |
| Honister Drive | CA14 3JS |
| Hunday Court | CA14 3SL |
| Lady Court | CA14 3SW |
| Lakeland View | CA14 3PJ |
| Laybourn Court | CA14 3SN |
| Loweswater Avenue | CA14 3LA |
| Minster Close | CA14 3NX |
| Needham Drive | CA14 3SB CA14 3SD CA14 3SE |
| Newlands Gardens | CA14 3PE CA14 3PG |
| Newlands Lane South | CA14 3NJ CA14 3NR CA14 3NS CA14 3NW CA14 3QD CA14 3QQ CA14 3RX CA14 3RZ |
| Nilsson Drive | CA14 5BB |
| Richmond Croft | CA14 5BT |
| Richmond Road | CA14 5BU |
| Sarsfield Road | CA14 5BZ CA14 5DA |
| Sycamore Court | CA14 3PT |
| Udale Court | CA14 3SH CA14 3SJ |
| Ullswater Avenue | CA14 3LB |
| Westfield Drive | CA14 3RJ CA14 3RL CA14 3RQ CA14 5AS CA14 5AT CA14 5AY CA14 5BA |
| Windsor Road | CA14 5BJ CA14 5BN CA14 5BP CA14 5BQ CA14 5BS CA14 5BW |
| Woodside | CA14 3LH |
Transport near Moorclose
- FAQ
- Price Paid By Year
- Property Type Price
Frequently asked questions about Moorclose
What is the average price for a property for sale in Moorclose?
The average price for a property for sale in Moorclose is £128,370. This amount is 17% lower than the average price in Workington. There are 1,009 property listings for sale in Moorclose.
What streets have the most expensive properties for sale in Moorclose?
The streets with the most expensive properties for sale in Moorclose are Chaucer Road at an average of £226,687, Garth Road at an average of £161,728 and Newlands Lane South at an average of £151,545.
What streets have the most affordable properties for sale in Moorclose?
The streets with the most affordable properties for sale in Moorclose are Newlands Gardens at an average of £72,700, Coniston Close at an average of £76,250 and Edinburgh Avenue at an average of £84,750.
Which train stations are available in or near Moorclose?
Some of the train stations available in or near Moorclose are Workington, Harrington and Flimby.
Property Price Paid in Moorclose by Year
The average sold property price by year was:
| Year | Average Sold Price | Price Change |
Sold Properties
|
|---|---|---|---|
| 2025 | £138,913 | 16% |
32 Properties |
| 2024 | £116,611 | -11% |
31 Properties |
| 2023 | £129,125 | 10% |
36 Properties |
| 2022 | £115,910 | 9% |
53 Properties |
| 2021 | £105,590 | -7% |
55 Properties |
| 2020 | £112,585 | 15% |
31 Properties |
| 2019 | £95,292 | -1% |
28 Properties |
| 2018 | £96,703 | -4% |
41 Properties |
| 2017 | £100,252 | 8% |
47 Properties |
| 2016 | £92,234 | -5% |
41 Properties |
| 2015 | £97,154 | -0,3% |
42 Properties |
| 2014 | £97,405 | -2% |
40 Properties |
| 2013 | £99,238 | -4% |
31 Properties |
| 2012 | £103,293 | 11% |
22 Properties |
| 2011 | £91,959 | -10% |
40 Properties |
| 2010 | £101,371 | -1% |
45 Properties |
| 2009 | £101,956 | -1% |
23 Properties |
| 2008 | £102,997 | 5% |
32 Properties |
| 2007 | £97,946 | -1% |
61 Properties |
| 2006 | £99,371 | 19% |
48 Properties |
| 2005 | £80,925 | 22% |
61 Properties |
| 2004 | £63,231 | 18% |
65 Properties |
| 2003 | £52,100 | 21% |
53 Properties |
| 2002 | £41,401 | -4% |
50 Properties |
| 2001 | £43,130 | 8% |
50 Properties |
| 2000 | £39,791 | -34% |
41 Properties |
| 1999 | £53,162 | 18% |
43 Properties |
| 1998 | £43,383 | -0,4% |
57 Properties |
| 1997 | £43,569 | 20% |
39 Properties |
| 1996 | £34,927 | -12% |
24 Properties |
| 1995 | £39,252 | - |
22 Properties |
Property Price per Property Type in Moorclose
Here you can find historic sold price data in order to help with your property search.
The average Property Paid Price for specific property types in the last three years are:
| Property Type | Average Sold Price | Sold Properties |
|---|---|---|
| Semi Detached House | £132,085.00 | 37 Semi Detached Houses |
| Terraced House | £98,116.00 | 47 Terraced Houses |
| Flat | £47,000.00 | 1 Flat |
| Detached House | £225,928.00 | 14 Detached Houses |

