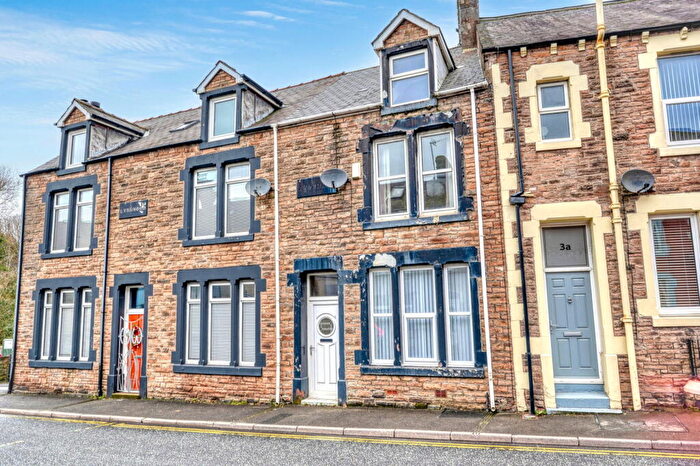
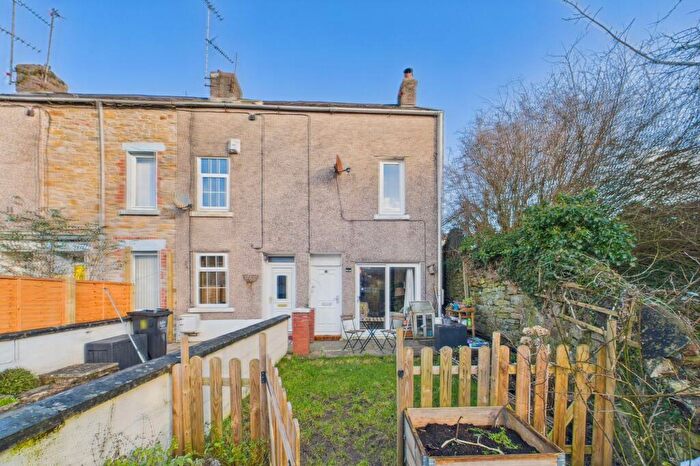
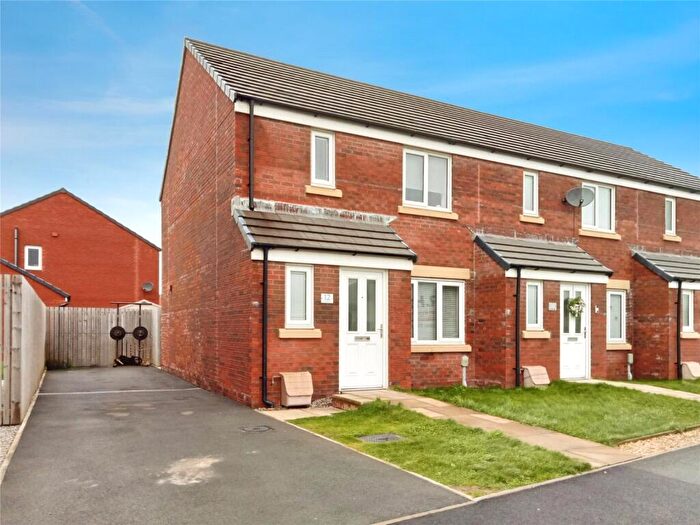
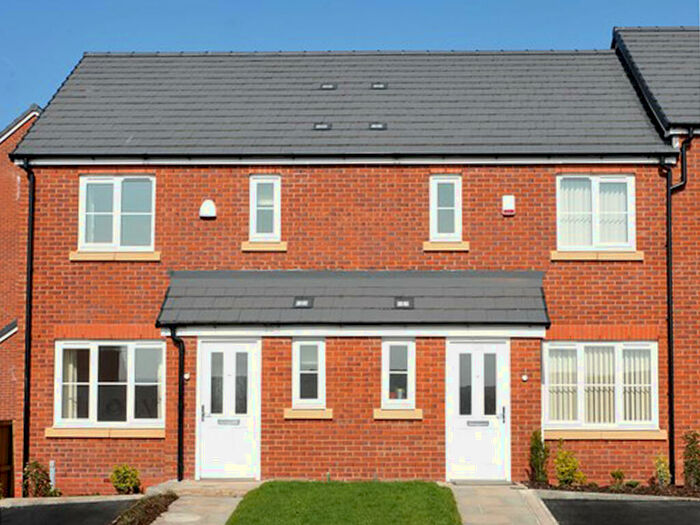
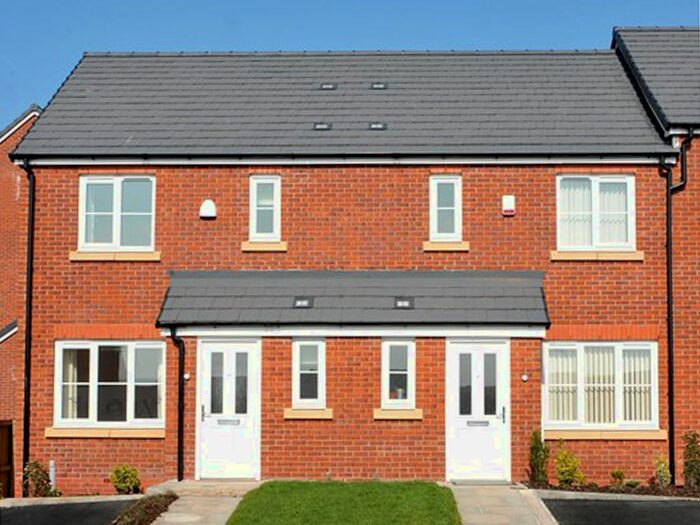
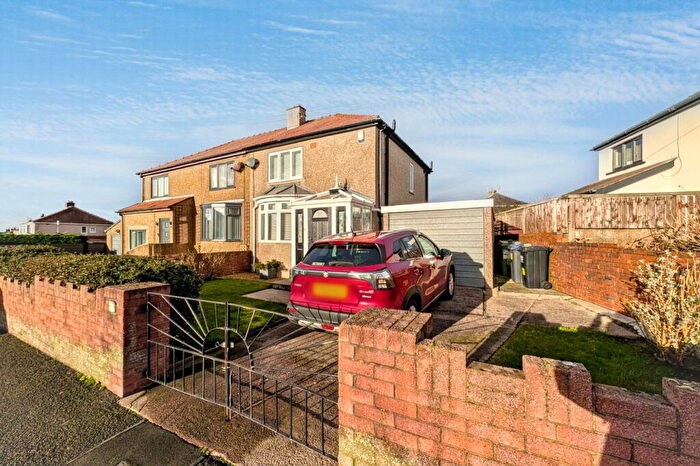
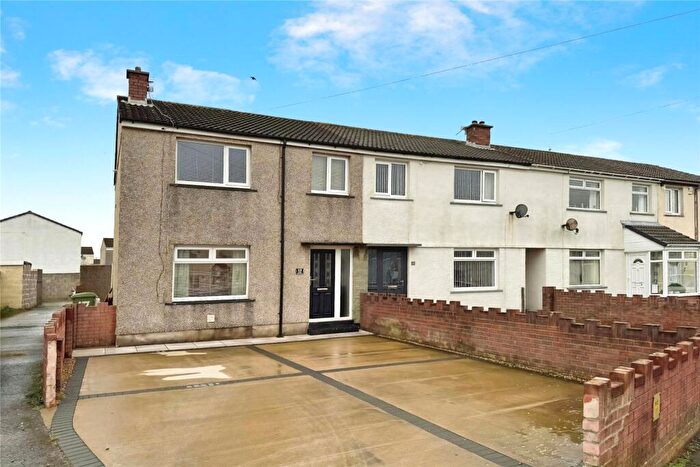
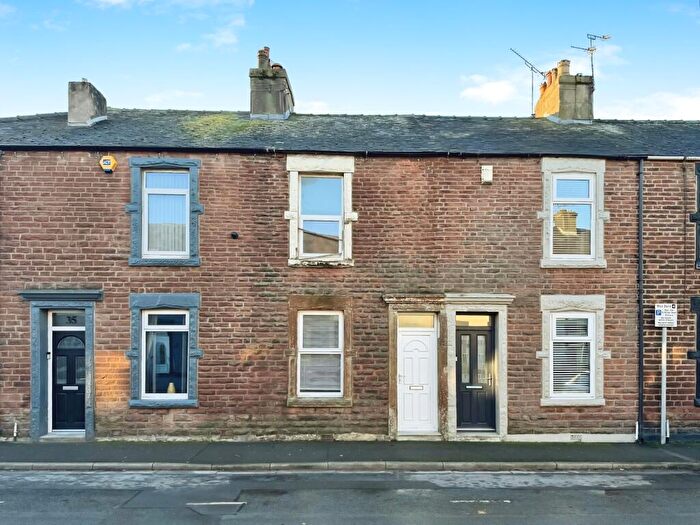
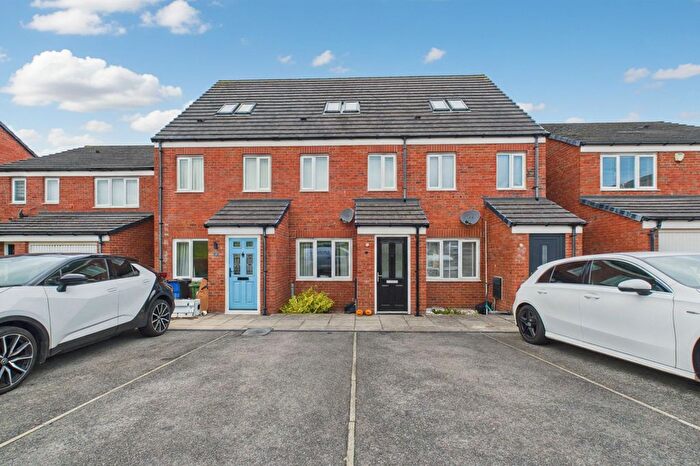
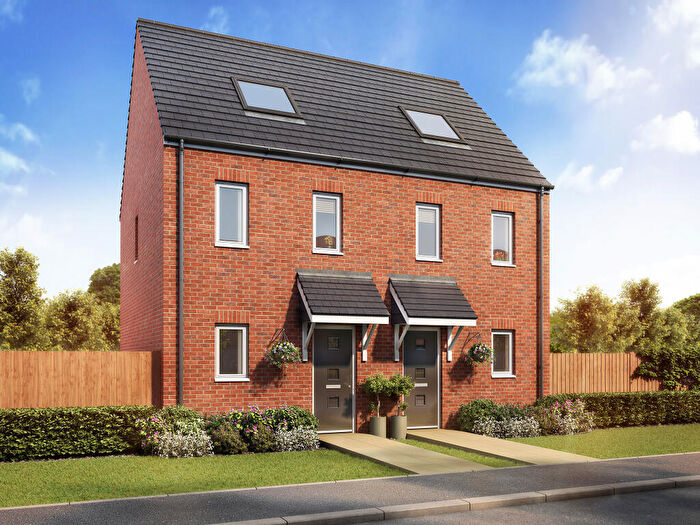
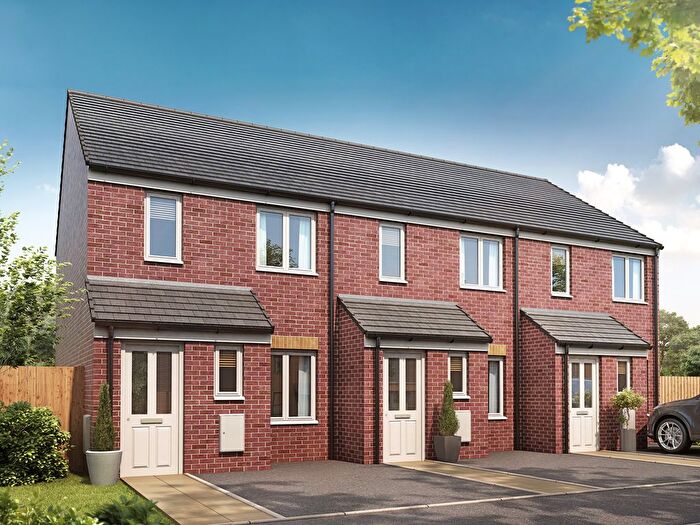
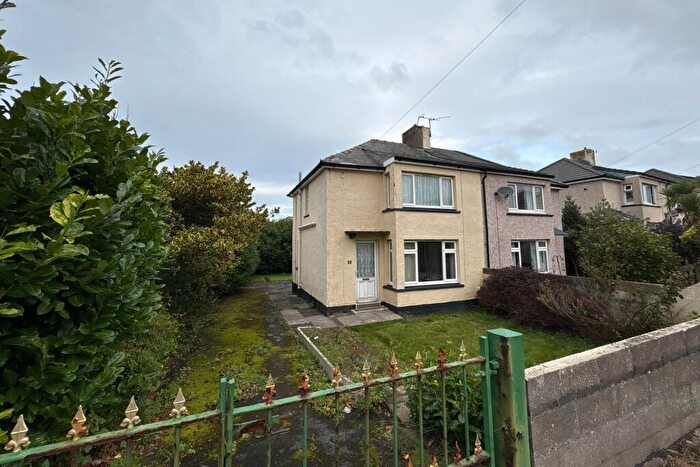
Houses for sale & to rent in Moss Bay, Workington
House Prices in Moss Bay
Properties in Moss Bay have an average house price of £108,955.00 and had 118 Property Transactions within the last 3 years¹.
Moss Bay is an area in Workington, Cumbria with 1,719 households², where the most expensive property was sold for £212,500.00.
Properties for sale in Moss Bay
Roads and Postcodes in Moss Bay
Navigate through our locations to find the location of your next house in Moss Bay, Workington for sale or to rent.
| Streets | Postcodes |
|---|---|
| Beach Street | CA14 3TP |
| Brierydale | CA14 5LH CA14 5LJ CA14 5LL CA14 5LQ |
| Cain Street | CA14 3XX |
| Casson Road | CA14 3XJ CA14 3XN |
| Coronation Drive | CA14 5LS |
| Cranbourne Street | CA14 3TZ CA14 3UA |
| Cross Street | CA14 3TW |
| Cusack Crescent | CA14 3XR |
| Derwent Road | CA14 3TT |
| Doura Cottages | CA14 5JW |
| Firth View Walk | CA14 3RA |
| Garnet Crescent | CA14 5ER |
| Grasmoor Road | CA14 5JB |
| Hillary Close | CA14 5LR |
| Holden Road | CA14 5LN CA14 5LZ CA14 5NB |
| Holyoake Terrace | CA14 3XE |
| Iredale Crescent | CA14 3XT |
| Jackson Road | CA14 5NA |
| Laverock Terrace | CA14 3QP |
| Mckeating Croft | CA14 3SX |
| Mitchell Cottages | CA14 5JY |
| Mona Road | CA14 5JH |
| Monkhouse Road | CA14 5EU |
| Moorclose Road | CA14 5LD CA14 5LE CA14 5LF CA14 5LG |
| Moss Bay Road | CA14 3TE CA14 3TF CA14 3TG CA14 3TH CA14 3TL CA14 3TN CA14 3TQ CA14 3XF CA14 3XG CA14 5AB CA14 5AD CA14 5AF |
| Mountain View | CA14 5JX |
| Northcote Street | CA14 3TY |
| Pearl Road | CA14 5ED CA14 5EE CA14 5EF |
| Poole Road | CA14 5DJ CA14 5DL CA14 5DN CA14 5DP CA14 5DW |
| Railbank Drive | CA14 5DD |
| Rowe Terrace | CA14 3SR CA14 3SS CA14 3SU |
| Ruby Road | CA14 5EG CA14 5EQ |
| Salisbury Street | CA14 3TR CA14 3TS |
| Salterbeck Road | CA14 5HW CA14 5JF CA14 5JG CA14 5JJ CA14 5JT CA14 5JU |
| Salterbeck Terrace | CA14 5HP |
| Sea View Drive | CA14 5DF |
| Shore Road | CA14 5HL |
| Smith Road | CA14 5ET |
| The Crescent | CA14 5JQ |
| Walker Brow | CA14 5JS |
| Walls Road | CA14 5JA CA14 5JD |
| Wastwater Avenue | CA14 3QR CA14 3QS CA14 3QT CA14 3QU |
| West View Walk | CA14 3RE CA14 3RG CA14 3RN |
| Westfield Drive | CA14 5AR CA14 5AX CA14 5AZ |
| Wether Riggs Road | CA14 5HR CA14 5HS |
Transport near Moss Bay
- FAQ
- Price Paid By Year
- Property Type Price
Frequently asked questions about Moss Bay
What is the average price for a property for sale in Moss Bay?
The average price for a property for sale in Moss Bay is £108,955. This amount is 29% lower than the average price in Workington. There are 803 property listings for sale in Moss Bay.
What streets have the most expensive properties for sale in Moss Bay?
The streets with the most expensive properties for sale in Moss Bay are Sea View Drive at an average of £201,899, Railbank Drive at an average of £153,500 and Moorclose Road at an average of £146,500.
What streets have the most affordable properties for sale in Moss Bay?
The streets with the most affordable properties for sale in Moss Bay are Cross Street at an average of £66,000, Holyoake Terrace at an average of £75,000 and Salisbury Street at an average of £80,000.
Which train stations are available in or near Moss Bay?
Some of the train stations available in or near Moss Bay are Harrington, Workington and Parton.
Property Price Paid in Moss Bay by Year
The average sold property price by year was:
| Year | Average Sold Price | Price Change |
Sold Properties
|
|---|---|---|---|
| 2025 | £104,999 | -8% |
30 Properties |
| 2024 | £113,678 | 6% |
44 Properties |
| 2023 | £106,930 | 18% |
44 Properties |
| 2022 | £87,248 | -12% |
34 Properties |
| 2021 | £97,741 | 6% |
55 Properties |
| 2020 | £91,498 | 12% |
32 Properties |
| 2019 | £80,456 | -6% |
44 Properties |
| 2018 | £85,141 | -8% |
39 Properties |
| 2017 | £91,743 | 7% |
39 Properties |
| 2016 | £85,124 | -8% |
37 Properties |
| 2015 | £91,845 | -16% |
68 Properties |
| 2014 | £106,666 | -11% |
50 Properties |
| 2013 | £118,911 | 24% |
52 Properties |
| 2012 | £90,028 | 13% |
32 Properties |
| 2011 | £78,601 | -7% |
30 Properties |
| 2010 | £84,348 | 17% |
30 Properties |
| 2009 | £70,240 | -13% |
33 Properties |
| 2008 | £79,210 | -3% |
33 Properties |
| 2007 | £81,324 | 13% |
58 Properties |
| 2006 | £70,868 | 20% |
55 Properties |
| 2005 | £56,776 | 26% |
57 Properties |
| 2004 | £42,219 | 12% |
70 Properties |
| 2003 | £37,077 | 26% |
38 Properties |
| 2002 | £27,331 | -3% |
46 Properties |
| 2001 | £28,159 | 24% |
30 Properties |
| 2000 | £21,413 | -6% |
29 Properties |
| 1999 | £22,735 | -4% |
27 Properties |
| 1998 | £23,582 | -16% |
23 Properties |
| 1997 | £27,322 | 15% |
32 Properties |
| 1996 | £23,207 | -8% |
27 Properties |
| 1995 | £25,039 | - |
24 Properties |
Property Price per Property Type in Moss Bay
Here you can find historic sold price data in order to help with your property search.
The average Property Paid Price for specific property types in the last three years are:
| Property Type | Average Sold Price | Sold Properties |
|---|---|---|
| Semi Detached House | £117,025.00 | 60 Semi Detached Houses |
| Detached House | £194,082.00 | 6 Detached Houses |
| Terraced House | £89,823.00 | 52 Terraced Houses |

