
Houses for sale & to rent in Haughton East, Darlington
House Prices in Haughton East
Properties in Haughton East have an average house price of £159k and had 113 Property Transactions within the last 3 years¹.
Haughton East is an area in Darlington, Darlington with 1,555 households², where the most expensive property was sold for £525k.
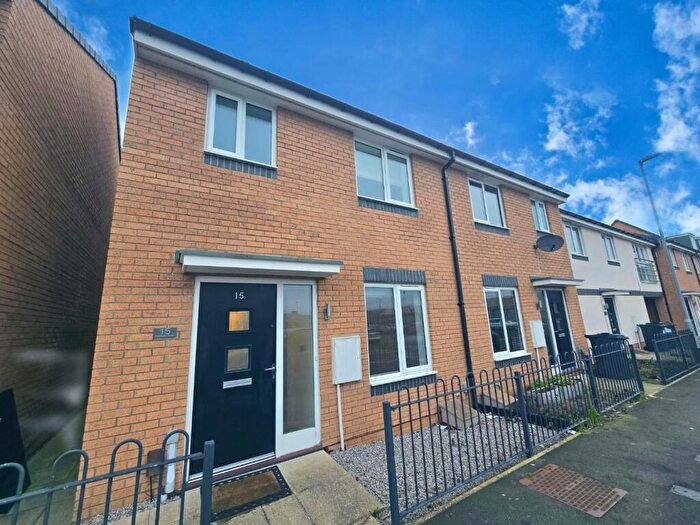
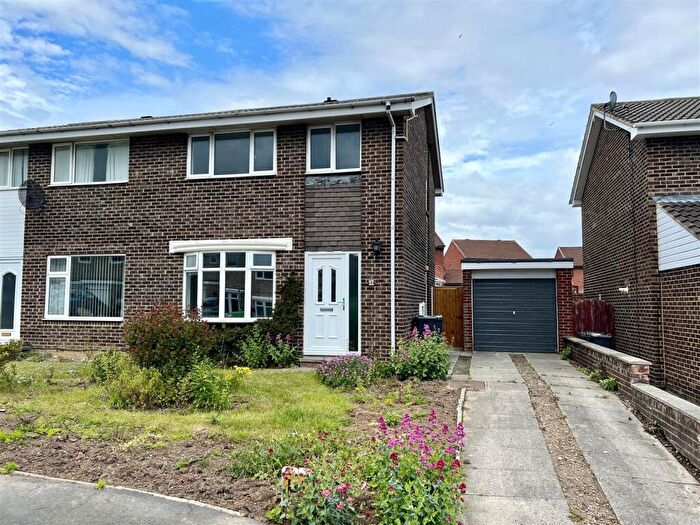
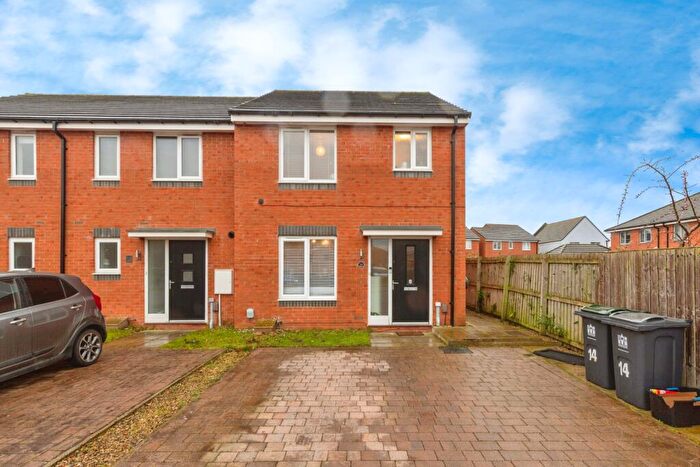
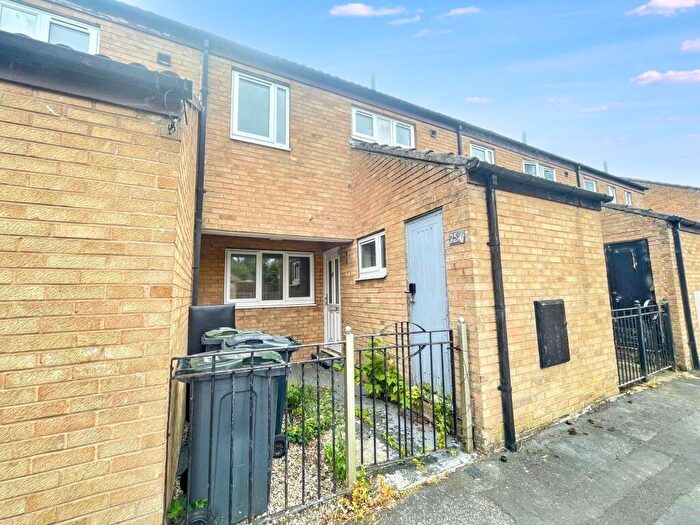
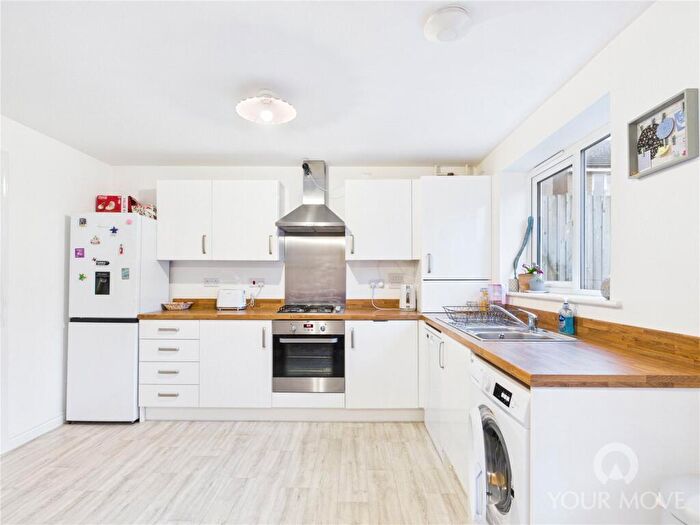
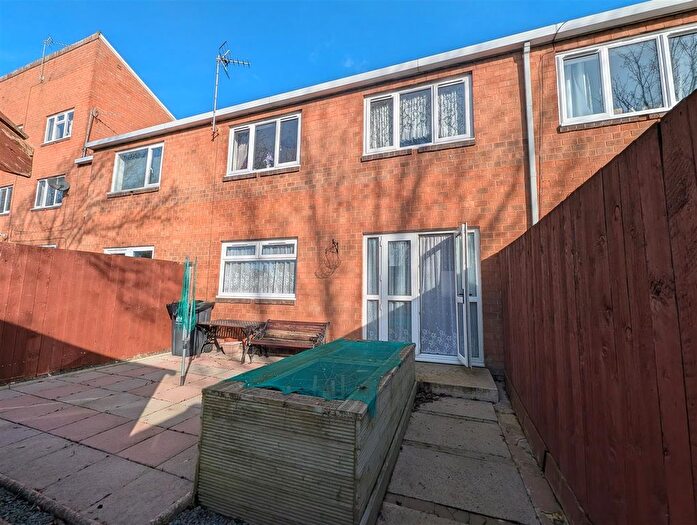
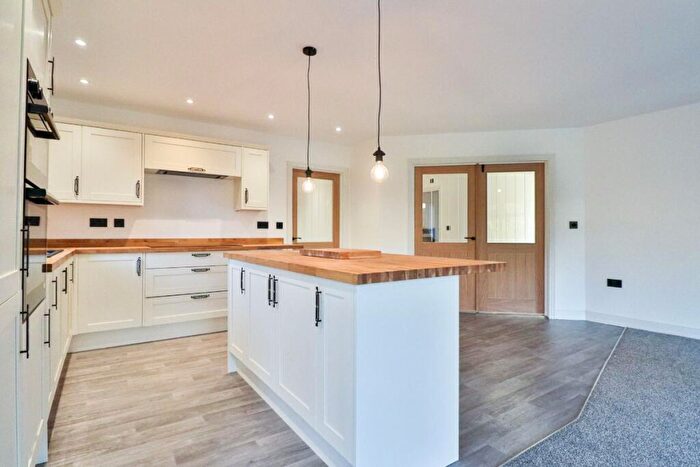
Properties for sale in Haughton East
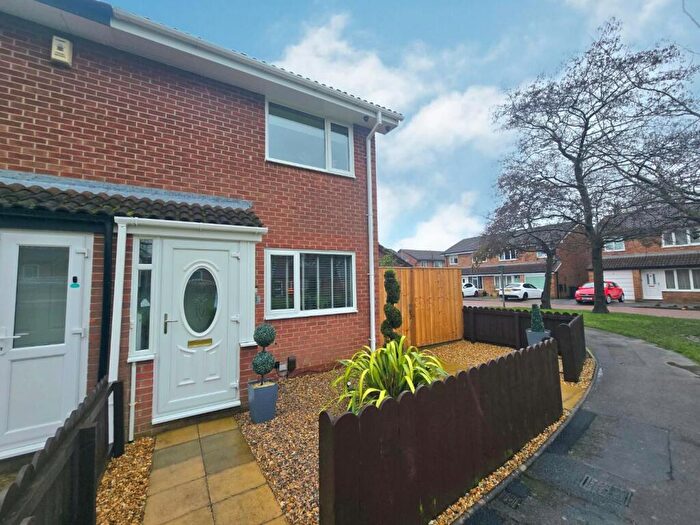
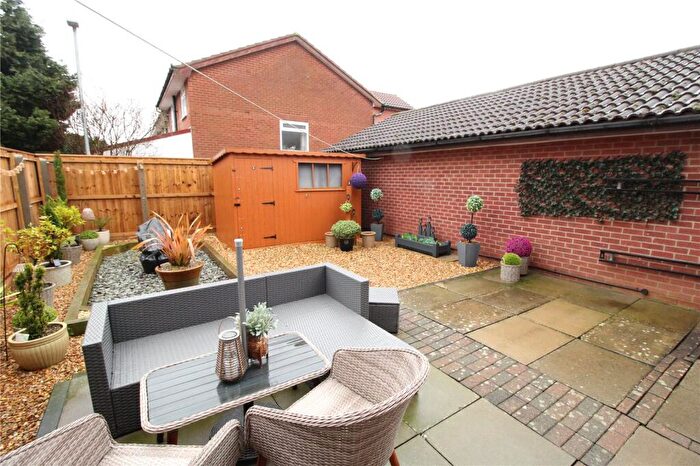
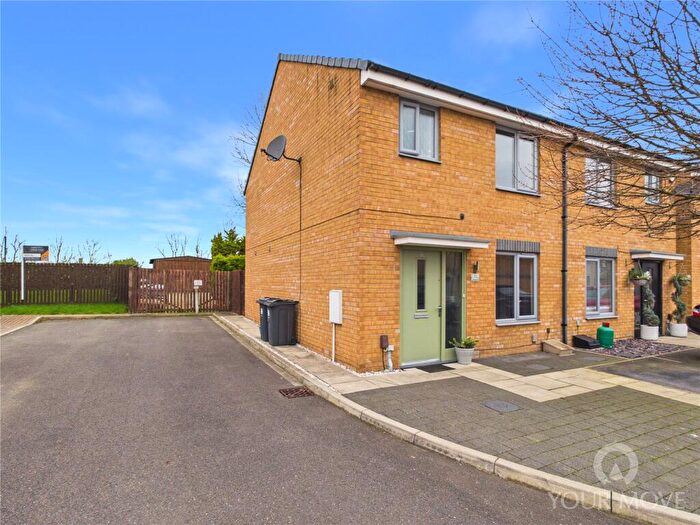
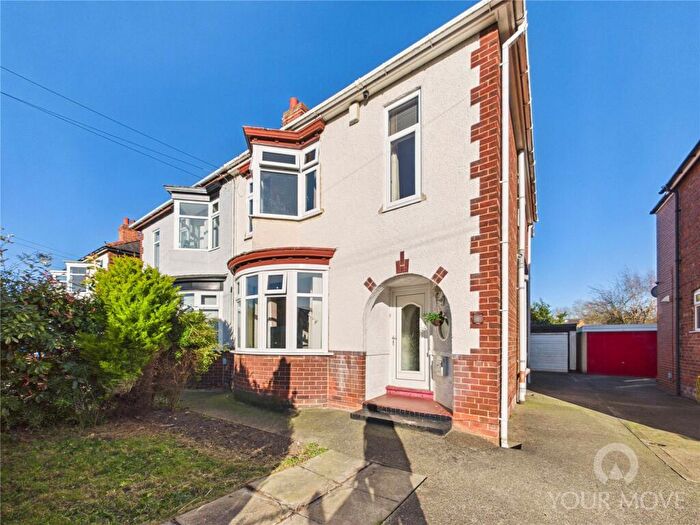
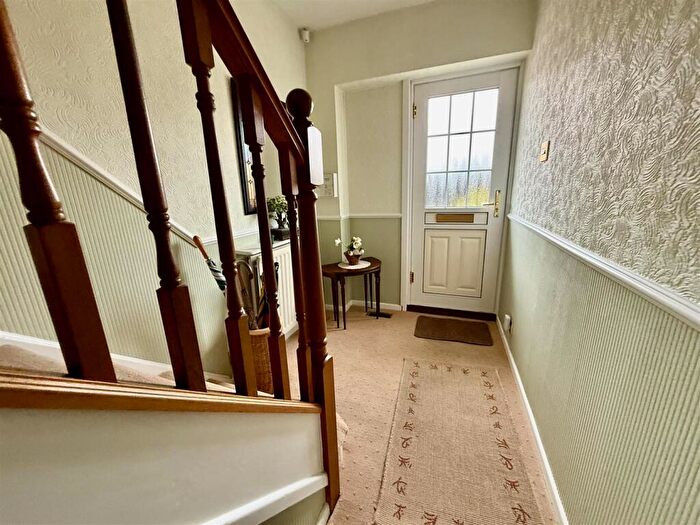
![]()
If you are looking to sell your house, let it out, or receive a property valuation, an expert can help you.
Click the button below to get started.
Roads and Postcodes in Haughton East
Navigate through our locations to find the location of your next house in Haughton East, Darlington for sale or to rent.
| Streets | Postcodes |
|---|---|
| Anfield Court | DL1 2TE |
| Aviemore Court | DL1 2TF |
| Bangor Grove | DL1 2XL |
| Bishops Close | DL1 2DH |
| Bramall Lane | DL1 2SZ |
| Brecon Side | DL1 2UZ |
| Canterbury Grove | DL1 2SD |
| Chichester Walk | DL1 2SG |
| Cottage Mews | DL1 2FX |
| Deepdale Way | DL1 2TA |
| Dunelm Walk | DL1 2DJ DL1 2DL |
| Ely Close | DL1 2SQ |
| Exeter Drive | DL1 2SE |
| Feetham Avenue | DL1 2DY |
| Fryer Crescent | DL1 2DT DL1 2DX |
| Goodison Way | DL1 2SU |
| Gouldsmith Gardens | DL1 2DU |
| Guildford Close | DL1 2XG |
| Harringay Crescent | DL1 2SW |
| Haughton Green | DL1 2DD DL1 2DF |
| Haughton Road | DL1 2EA |
| Headingley Crescent | DL1 2SR DL1 2ST |
| Hickstead Court | DL1 2UB |
| Kempton Court | DL1 2UD |
| Kennel Lane | DL1 2DG |
| Latimer Road | DL1 2AE |
| Leicester Grove | DL1 2XW |
| Lincoln Court | DL1 2XN |
| Mcmullen Road | DL1 2GA DL1 2TB |
| Mill Lane | DL1 2XQ |
| Murrayfield Way | DL1 2SY |
| Newport Court | DL1 2XD |
| Norwich Grove | DL1 2SF |
| Portsmouth Place | DL1 2XH |
| Ramsey Walk | DL1 2DN |
| Rochester Way | DL1 2UX DL1 2XJ |
| Roker Close | DL1 2SL |
| Rose Lane | DL1 2DE |
| Rymers Court | DL1 2GB |
| Salters Avenue | DL1 2AB |
| Salters Lane South | DL1 2AA DL1 2AD DL1 2AN |
| Southwell Green | DL1 2XE |
| Springwell Terrace | DL1 2AL |
| St Albans Green | DL1 2UY |
| St Andrews Close | DL1 2EB |
| St Davids Green | DL1 2XA |
| Stockton Road | DL1 2RX DL1 2RY DL1 2RZ |
| Trafford Close | DL1 2SS |
| Truro Close | DL1 2XF |
| Welbeck Avenue | DL1 2DP DL1 2DQ DL1 2DR DL1 2DS DL1 2DW |
| Wells Close | DL1 2XB |
| Whinfield Road | DL1 3HP DL1 3HS |
| White Hart Crescent | DL1 2SX |
| Wimbledon Close | DL1 2SP |
| Winchester Way | DL1 2SB DL1 2UT DL1 2UU |
Transport near Haughton East

- FAQ
- Price Paid By Year
- Property Type Price
Frequently asked questions about Haughton East
What is the average price for a property for sale in Haughton East?
The average price for a property for sale in Haughton East is £158,741. This amount is 3% lower than the average price in Darlington. There are 434 property listings for sale in Haughton East.
What streets have the most expensive properties for sale in Haughton East?
The streets with the most expensive properties for sale in Haughton East are St Andrews Close at an average of £525,000, Haughton Green at an average of £287,285 and Portsmouth Place at an average of £265,000.
What streets have the most affordable properties for sale in Haughton East?
The streets with the most affordable properties for sale in Haughton East are Wimbledon Close at an average of £55,000, Deepdale Way at an average of £64,000 and White Hart Crescent at an average of £65,500.
Which train stations are available in or near Haughton East?
Some of the train stations available in or near Haughton East are North Road, Darlington and Dinsdale.
Property Price Paid in Haughton East by Year
The average sold property price by year was:
| Year | Average Sold Price | Price Change |
Sold Properties
|
|---|---|---|---|
| 2026 | £198,000 | 21% |
1 Property |
| 2025 | £156,277 | -9% |
36 Properties |
| 2024 | £169,957 | 12% |
38 Properties |
| 2023 | £148,826 | 8% |
38 Properties |
| 2022 | £137,408 | -4% |
41 Properties |
| 2021 | £143,066 | 19% |
54 Properties |
| 2020 | £115,763 | -14% |
58 Properties |
| 2019 | £131,793 | - |
34 Properties |
| 2018 | £131,737 | -6% |
40 Properties |
| 2017 | £139,454 | 9% |
47 Properties |
| 2016 | £126,535 | 11% |
39 Properties |
| 2015 | £112,840 | 1% |
49 Properties |
| 2014 | £111,594 | 1% |
44 Properties |
| 2013 | £110,280 | 3% |
36 Properties |
| 2012 | £106,820 | -11% |
27 Properties |
| 2011 | £118,289 | 3% |
25 Properties |
| 2010 | £114,657 | 15% |
19 Properties |
| 2009 | £97,150 | -37% |
10 Properties |
| 2008 | £133,369 | 1% |
35 Properties |
| 2007 | £131,450 | 3% |
50 Properties |
| 2006 | £128,065 | 7% |
77 Properties |
| 2005 | £119,544 | 9% |
46 Properties |
| 2004 | £109,288 | 20% |
57 Properties |
| 2003 | £87,767 | 16% |
51 Properties |
| 2002 | £73,925 | 12% |
60 Properties |
| 2001 | £65,314 | 15% |
61 Properties |
| 2000 | £55,573 | -5% |
54 Properties |
| 1999 | £58,571 | 10% |
44 Properties |
| 1998 | £52,517 | -6% |
53 Properties |
| 1997 | £55,552 | 15% |
53 Properties |
| 1996 | £47,164 | -7% |
43 Properties |
| 1995 | £50,464 | - |
41 Properties |
Property Price per Property Type in Haughton East
Here you can find historic sold price data in order to help with your property search.
The average Property Paid Price for specific property types in the last three years are:
| Property Type | Average Sold Price | Sold Properties |
|---|---|---|
| Semi Detached House | £144,717.00 | 52 Semi Detached Houses |
| Detached House | £225,672.00 | 29 Detached Houses |
| Terraced House | £124,133.00 | 30 Terraced Houses |
| Flat | £72,000.00 | 2 Flats |