
Houses for sale in Darlington, Darlington
House Prices in Darlington
Properties in Darlington have an average house price of £164k and had 5,289 Property Transactions within the last 3 years.¹
Darlington is an area in Darlington with 47,529 households², where the most expensive property was sold for £1.1M.
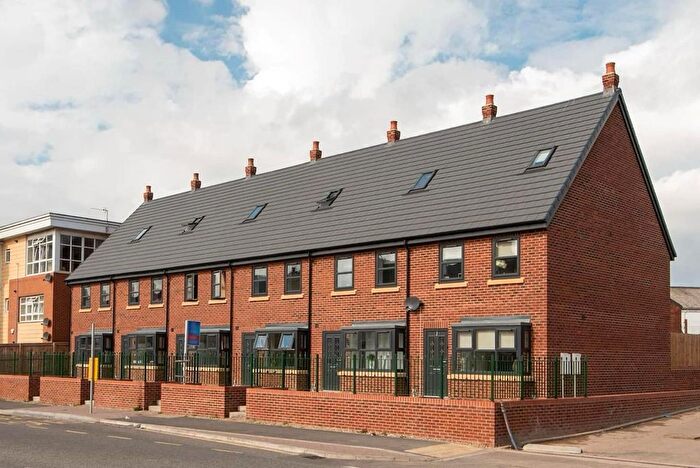
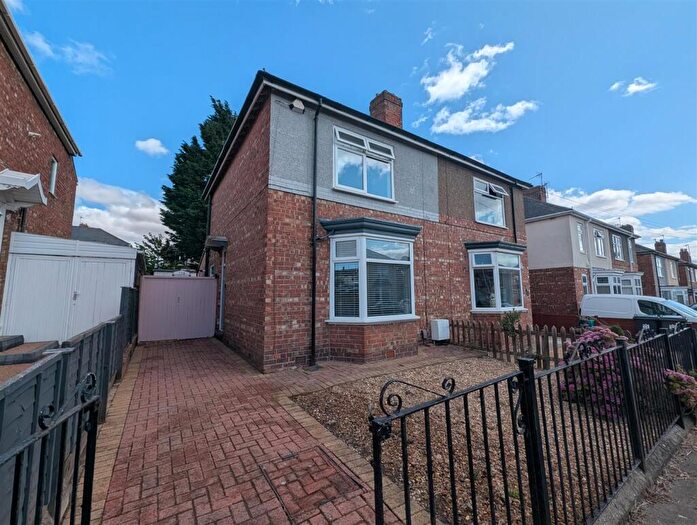
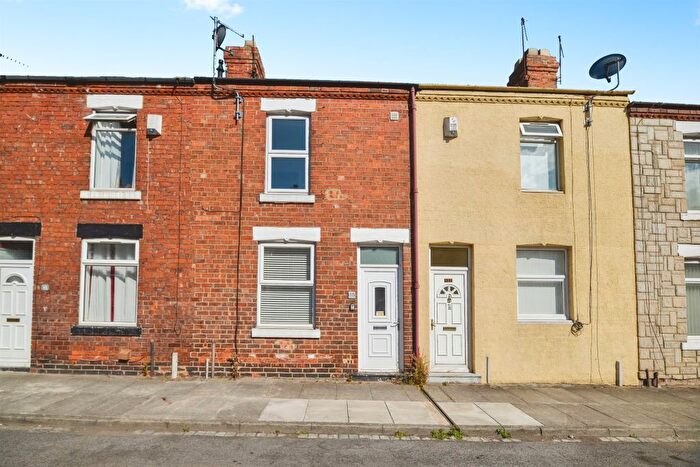
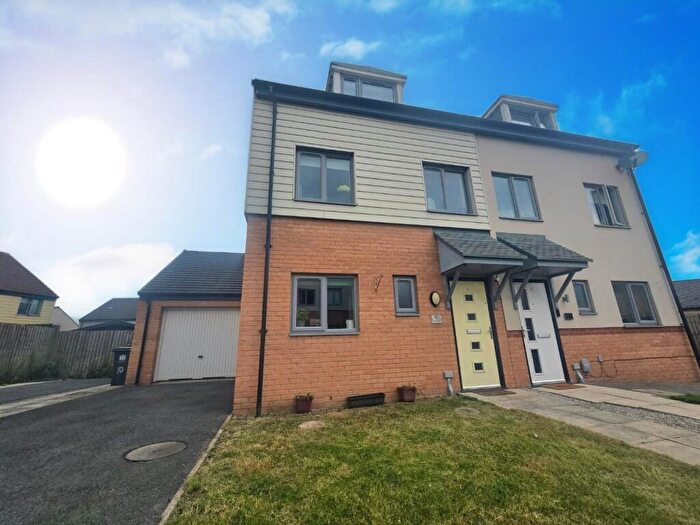
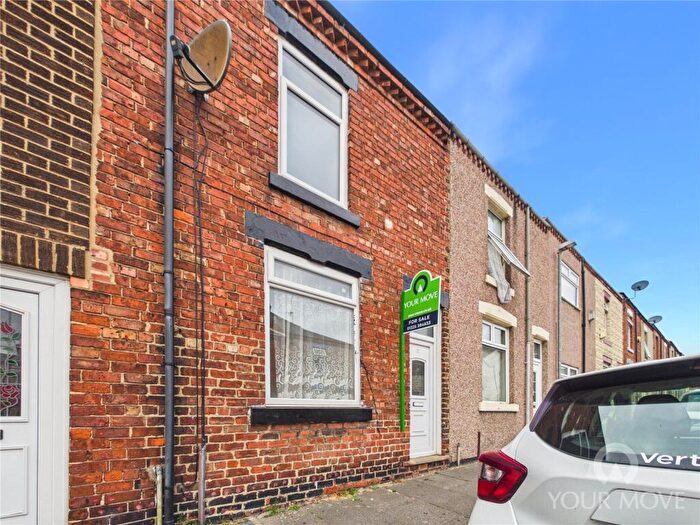
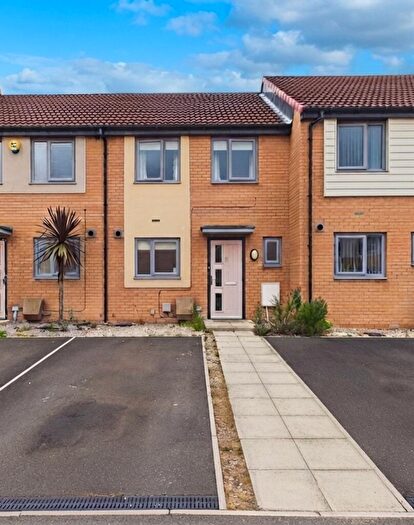
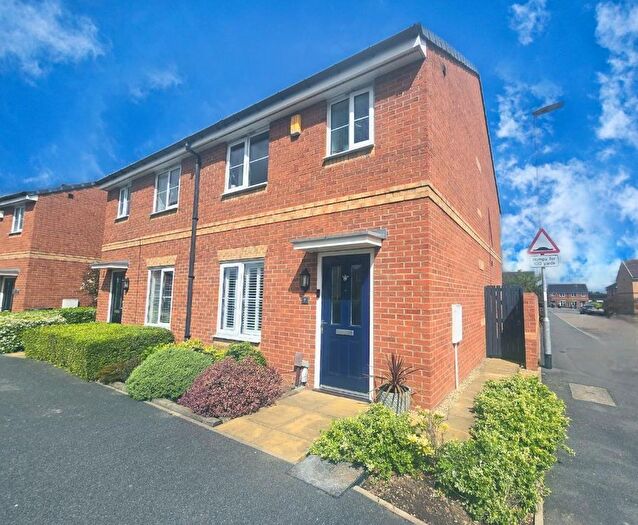
Properties for sale in Darlington
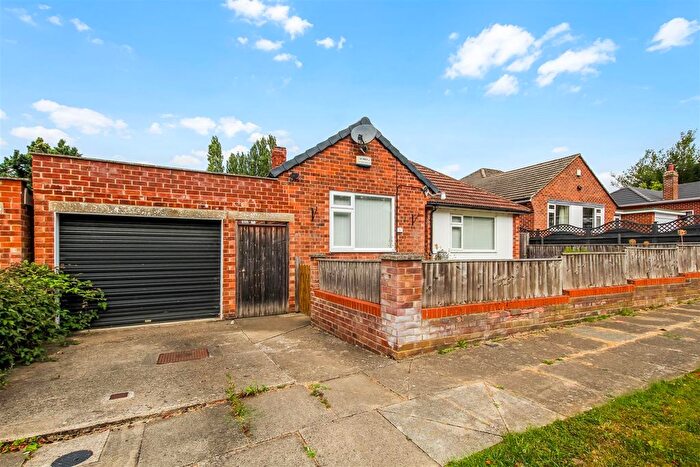
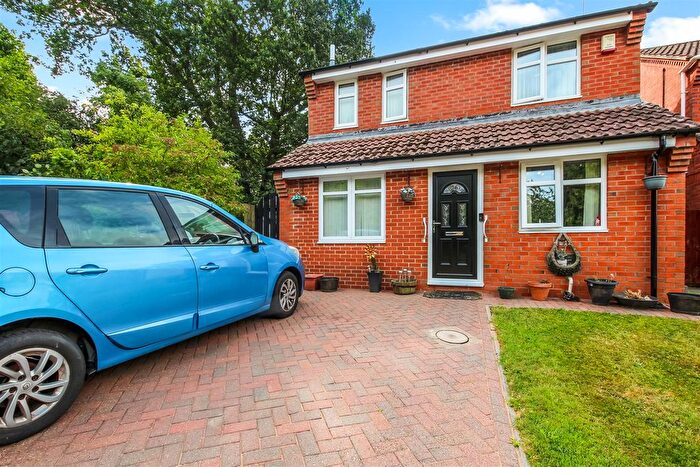
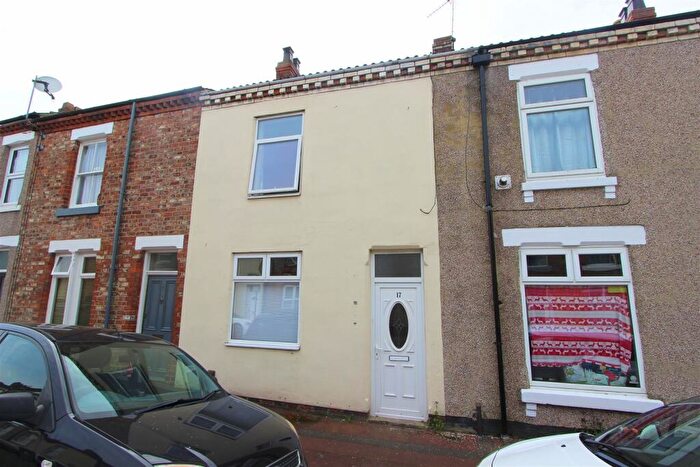
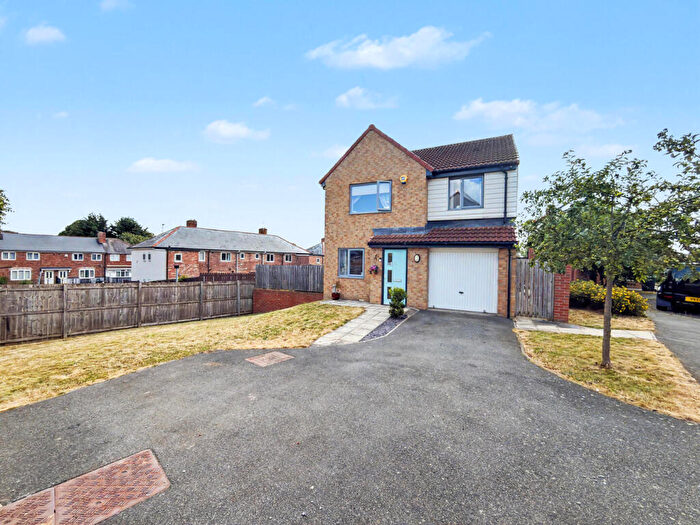
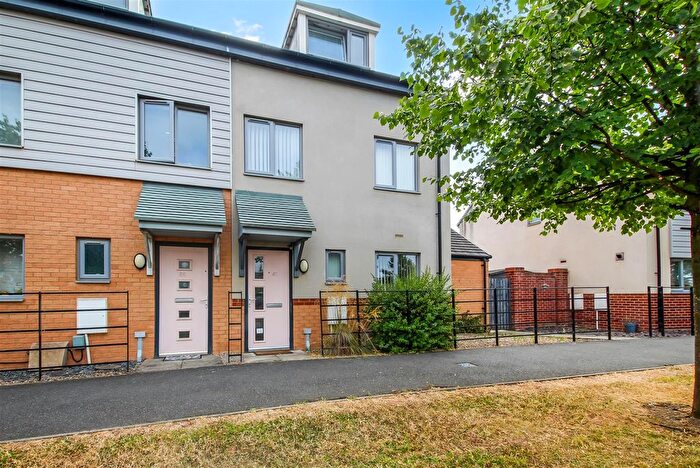
![]()
If you are looking to sell your house, let it out, or receive a property valuation, an expert can help you.
Click the button below to get started.

Neighbourhoods in Darlington
Navigate through our locations to find the location of your next house in Darlington, Darlington for sale or to rent.
- Bank Top
- Central
- Cockerton East
- Cockerton West
- College
- Eastbourne
- Faverdale
- Harrowgate Hill
- Haughton East
- Haughton North
- Haughton West
- Heighington And Coniscliffe
- Hummersknott
- Hurworth
- Lascelles
- Lingfield
- Middleton St George
- Mowden
- North Road
- Northgate
- Park East
- Park West
- Pierremont
- Sadberge And Whessoe
- Bank Top & Lascelles
- Red Hall & Lingfield
- Stephenson
- Haughton & Springfield
- Sadberge & Middleton St George
- Heighington & Coniscliffe
- Whinfield
- Brinkburn & Faverdale
- Cockerton
Property price trends in Darlington
According to the latest Land Registry data, the average home in Darlington sold for £150,482 in 2026. That figure comes from a substantial record of 61,558 sales logged over the past 31 years.
Prices have softened over the last three years. Compared with 2023, when the typical sale came in around £158,739, that's a fall of roughly 5.2%.
Looking back five years, average prices are down about 8.4% since 2021, a drop of around £13,808 in cash terms.
Zoom out to the past decade for the fuller picture. Back in 2016, homes here averaged £143,977, so the typical sold price has climbed about 4.5% since then, roughly 0.4% a year. Stretch the view to fifteen years and that annual pace edges up closer to 0.7%.
Frequently asked questions about Darlington
What is the average price for a property for sale in Darlington?
The average price for a property for sale in Darlington is £163,556. This amount is 2% lower than the average price in Darlington. There are 9,502 property listings for sale in Darlington.
What locations have the most expensive properties for sale in Darlington?
The locations with the most expensive properties for sale in Darlington are Whinfield at an average of £555,000, Heighington And Coniscliffe at an average of £355,773 and Park West at an average of £321,241.
What locations have the most affordable properties for sale in Darlington?
The locations with the most affordable properties for sale in Darlington are Bank Top & Lascelles at an average of £75,000, Bank Top at an average of £92,048 and Northgate at an average of £95,005.
Which train stations are available in or near Darlington?
Some of the train stations available in or near Darlington are North Road, Darlington and Dinsdale.
Property Price Paid in Darlington by Year
The average sold property price by year was:
| Year | Average Sold Price | Price Change |
Sold Properties
|
|---|---|---|---|
| 2026 | £150,482 | -14% |
139 Properties |
| 2025 | £171,596 | 6% |
1,684 Properties |
| 2024 | £161,550 | 2% |
1,769 Properties |
| 2023 | £158,739 | -7% |
1,697 Properties |
| 2022 | £169,246 | 3% |
2,009 Properties |
| 2021 | £164,290 | 2% |
2,497 Properties |
| 2020 | £160,582 | 4% |
1,766 Properties |
| 2019 | £154,805 | 3% |
1,864 Properties |
| 2018 | £150,596 | - |
1,794 Properties |
| 2017 | £150,666 | 4% |
1,801 Properties |
Property Price per Property Type in Darlington
Here you can find historic sold price data in order to help with your property search.
The average Property Paid Price for specific property types in the last three years are:
| Property Type | Average Sold Price | Sold Properties |
|---|---|---|
| Semi Detached House | £172,883.00 | 1,964 Semi Detached Houses |
| Terraced House | £116,748.00 | 2,179 Terraced Houses |
| Detached House | £300,910.00 | 758 Detached Houses |
| Flat | £110,878.00 | 388 Flats |
Transport in Darlington
Please see below transportation links in this area:
