
Houses for sale in Darlington, England
House Prices in Darlington
Properties in Darlington have
an average house price of
£166k
and had 5,752 Property Transactions
within the last 3 years.¹
Darlington is a location in
England with
48,847 households², where the most expensive property was sold for £1.1M.
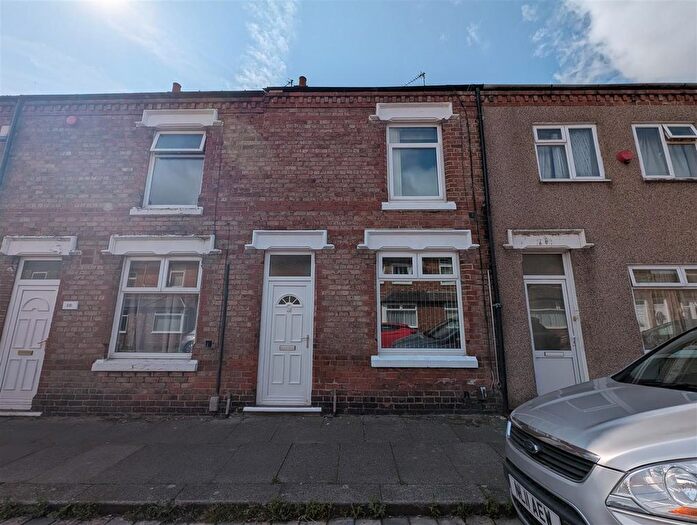
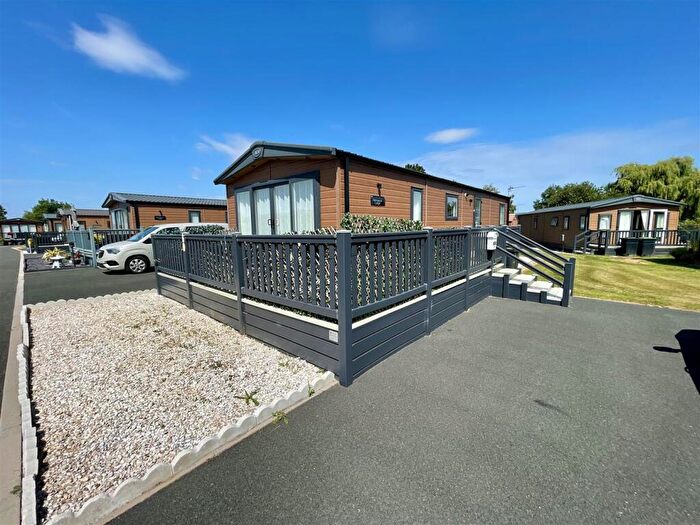
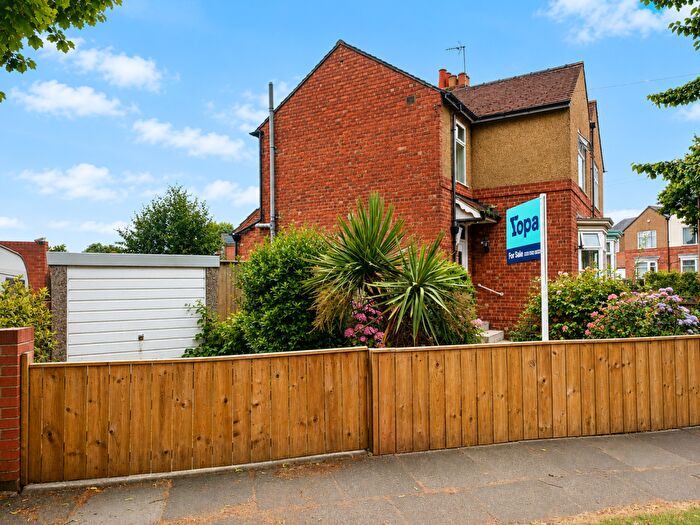
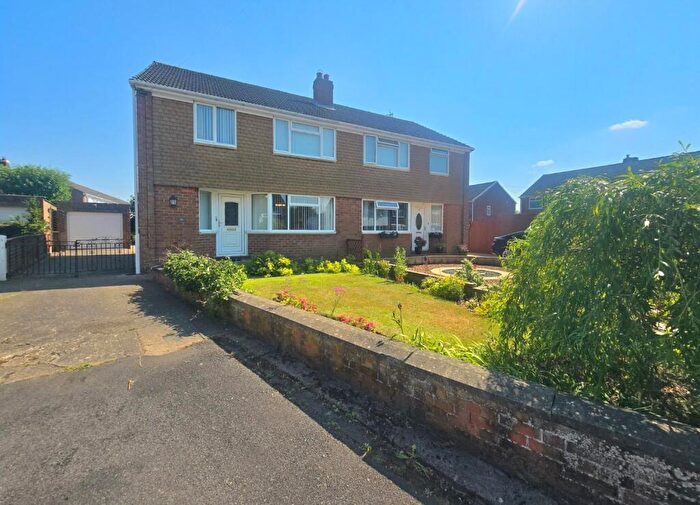
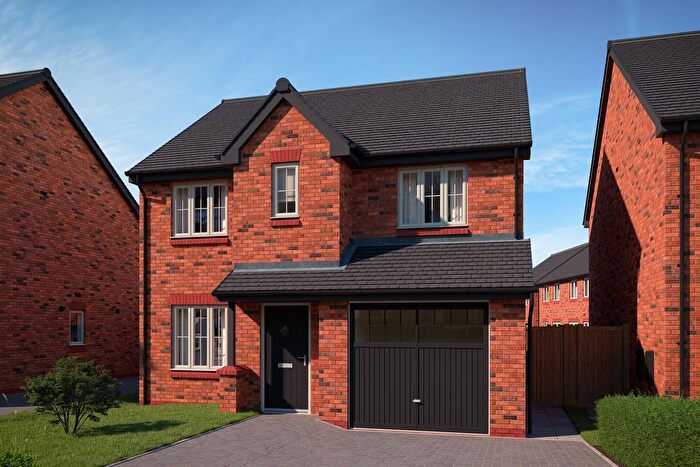
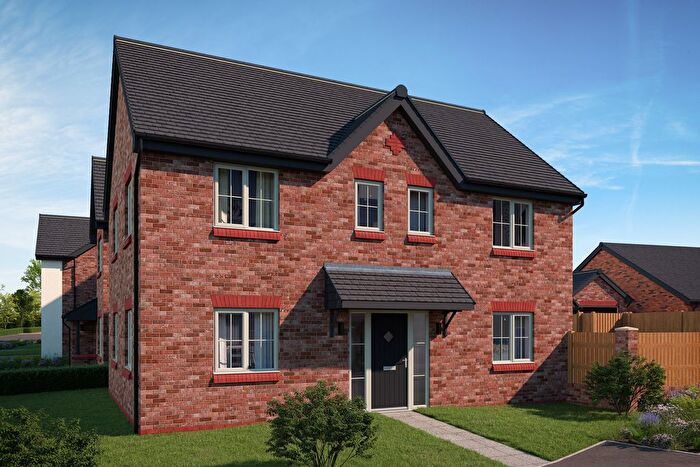
Properties for sale in Darlington
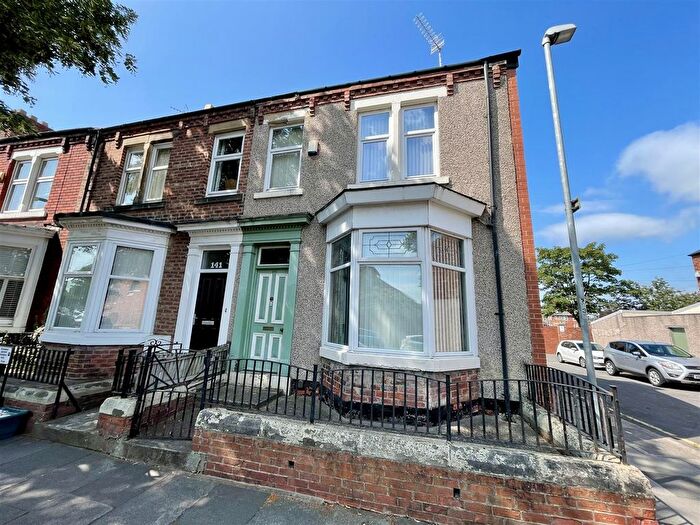
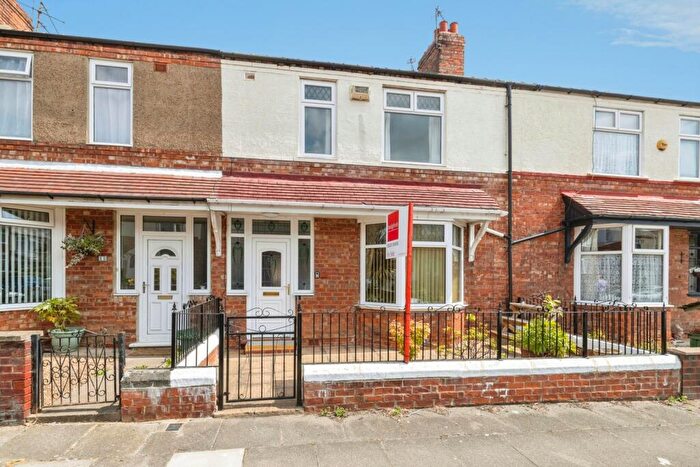
![]()
If you are looking to sell your house, let it out, or receive a property valuation, an expert can help you.
Click the button below to get started.

Towns in Darlington
Navigate through our locations to find the location of your next house in Darlington, England for sale or to rent.
Property price trends in Darlington
According to the latest Land Registry data, the average home in Darlington sold for £161,405 in 2026. That figure comes from a substantial record of 63,583 sales logged over the past 31 years.
Prices have held fairly steady over the last three years. Compared with 2023, when the typical sale came in around £162,323, values are broadly unchanged.
Looking back five years, average prices are down about 5% since 2021, a drop of around £8,481 in cash terms.
Zoom out to the past decade for the fuller picture. Back in 2016, homes here averaged £145,859, so the typical sold price has climbed about 10.7% since then, roughly 1% a year. Stretch the view to fifteen years and that annual pace holds at about 1.1%.
Frequently asked questions about Darlington
What is the average price for a property for sale in Darlington?
The average price for a property for sale in Darlington is £166,401. This amount is 54% lower than the average price in England. There are more than 10,000 property listings for sale in Darlington.
What locations have the most expensive properties for sale in Darlington?
The locations with the most expensive properties for sale in Darlington are Stockton-on-tees at an average of £366,313 and Newton Aycliffe at an average of £264,342.
What locations have the most affordable properties for sale in Darlington?
The location with the most affordable properties for sale in Darlington is Darlington at an average of £163,556.
Which train stations are available in or near Darlington?
Some of the train stations available in or near Darlington are North Road, Darlington and Dinsdale.
Property Price Paid in Darlington by Year
The average sold property price by year was:
| Year | Average Sold Price | Price Change |
Sold Properties
|
|---|---|---|---|
| 2026 | £161,405 | -7% |
346 Properties |
| 2025 | £173,270 | 5% |
1,850 Properties |
| 2024 | £164,267 | 1% |
1,812 Properties |
| 2023 | £162,323 | -6% |
1,744 Properties |
| 2022 | £171,908 | 1% |
2,058 Properties |
| 2021 | £169,886 | 3% |
2,614 Properties |
| 2020 | £164,879 | 3% |
1,862 Properties |
| 2019 | £159,755 | 4% |
1,964 Properties |
| 2018 | £153,739 | 1% |
1,849 Properties |
| 2017 | £152,034 | 4% |
1,849 Properties |
Property Price per Property Type in Darlington
Here you can find historic sold price data in order to help with your property search.
The average Property Paid Price for specific property types in the last three years are:
| Property Type | Average Sold Price | Sold Properties |
|---|---|---|
| Semi Detached House | £174,538.00 | 2,104 Semi Detached Houses |
| Terraced House | £117,405.00 | 2,351 Terraced Houses |
| Detached House | £302,445.00 | 888 Detached Houses |
| Flat | £110,810.00 | 409 Flats |
Transport in Darlington
Please see below transportation links in this area:
